AFM Measurement of Step Kinetics for the Growth and Dissolution of Crystallites
This paper discusses two atomic force microscopy (AFM) techniques that have been used successfully to quantify step movement: direct and indirect measurement. The benefits and difficulties associated with each method are discussed.
Since the invention of scanning tunneling microscopy (STM) in 1982 (1), a family of similar techniques known as scanning probe microscopy (SPM) has developed quickly into a powerful tool for surface science. Among these techniques is atomic force microscopy (AFM), introduced in 1986 (2). Similar to STM, AFM uses a sharp probe that scans the sample in a raster-fashion to detect changes in surface properties such as topography and charge distribution. Unlike STM, AFM does not require conductive samples; rather than measuring the tunneling current, AFM senses the interactive forces (Van der Waals, electrostatic, and magnetic forces, for example) that range from 10-9 to 10-6 N (3), between the tip and the sample surface. Excellent three-dimensional spatial resolution (nanometer scales) can be achieved, in contrast to other forms of microscopy that typically can offer only high resolution in lateral dimensions. AFM imaging operations can be conducted in ambient environments or in solution flowthrough conditions with minimal sample preparation. These advantages have made AFM a unique and popular technique to study a variety of surface phenomena.
One of the most unique features of AFM is its ability to perform in situ experiments in fluid environments. This is useful particularly in studying the growth and dissolution process of water-soluble crystallites in which the speed of step movement commonly is the subject interest. However, measuring step speed on AFM images proves difficult and inaccurate due to the following two factors:
- Spatial uncertainties associated with the electronics and mechanics of AFM. A common problem for sequential AFM imaging is the thermal drift of piezos that causes the scanner to move away from the original field of view (4).
- Lack of stationary reference marks within the imaging area due to surface growth–dissolution. Because the entire imaging area is subject to mass addition or reduction during growth–dissolution, most existing surface features constantly will undergo changes in sizes and positions and therefore cannot be used as fixed reference points.
The combination of these two factors poses a practical challenge to quantifying step motion. This article describes two methods that have been used successfully in AFM studies of step kinetics. These methods either take advantage of the ubiquitous presence of imperfections in crystallites or make use of the dynamic characteristics of dissolving–growing steps. Together, they provide a pragmatic means for effective measurements of step movement.
Method Description
The two techniques presented here include a direct measurement of step speed as step displacement over time and an indirect measurement of step speed from the angles of moving steps with reference to their still positions.
Step displacement method. This method measures the changes of step positions relative to a fixed reference point on consecutive images (Figure 1). Step speed then is calculated simply as the ratio of the position change to the time elapsed between the two images. It is a straightforward operation but requires effort to identify at least one immobile reference mark on the surface. A good reference mark should be insensitive to surface reactions. Specifically, its position should not shift with changing surface morphology, and its presence should not fade away with each surface layer forming or dissolving. A best candidate for this purpose is linear defects terminated at surfaces. Defects are a common occurrence in crystals. Although the actual density of dislocations estimated by different techniques can vary to a certain extent, the quantity in general ranges from below 102 dislocations/cm2 in the best germanium and silicon crystals to 1011 – 1012 dislocations/cm2 in highly deformed metal crystals (5).
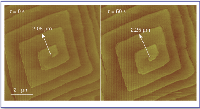
Figure 1. Sequential AFM images of a growing calcite crystal face exemplifying the measurement of step displacement over time. Note that the measurements were made using the center of the spiral (that is, a screw dislocation) as a reference.
Linear defects root inside the bulk crystals and therefore do not drift significantly within adjacent layers even if the dislocation axis is not perpendicular to the surface. A particularly ideal defect to be used as a fixed reference point is a screw dislocation (Figure 2a). Unlike other types of linear defects such as edge dislocations, screw dislocations have a displacement vector (that is, the Burgers vector) component normal to the crystal face at which they emerge (6). Frank (7) showed that the screw component makes moving steps winding in a spiraling fashion around the dislocation axis so that the defect is preserved to be a "permanent" landmark on surfaces. Screw dislocations are best recognized on atomically flat surfaces such as cleavage crystal faces. For materials that have fast growth kinetics, screw dislocations can be found relatively easily by spiking the flat sample surface using solutions with high supersaturation to quickly generate spiral hillocks (Figure 2b). The centers of the spirals where the first legs come into view usually are where the screw dislocations are located. For materials that do not respond quickly to supersaturated solutions, one must trace the edges of existing steps. Screw dislocations usually are where steps end suddenly on flat surfaces (Figure 2c).

Figure 2. Screw dislocation shown (a) in a schematic view; (b) as growth hillocks on calcite surface; and (c) at the inward termination of a single step on feldspar surface. Dx and b in (a) are the dislocation axis and the Burgers vector. The arrows in (b) and (c) point to the approximate locations of the screw dislocations.
After a fixed reference mark is identified, step displacement over time can be measured on consecutive images to compute step speed. However, caution must be exercised if the step speed is higher than or even just comparable to the scan rate. This is because a moving step will either chase or migrate away from the tip during an AFM scan, depending upon the original step orientation and the scan direction, so that the apparent step orientation appears differently on upward and downward scan images (Figure 3). A common technique to compensate for this error is to adjust the scan angle so that the fast scan direction is perpendicular to the step edges before steps move (that is, step edges are adjusted to be parallel to the y-direction). This allows the step displacement to be measured as the distance in the x-direction between the dislocation and the step edges.
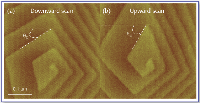
Figure 3. Consecutive AFM images of a growing spiral on calcite surface demonstrating image distortion due to the difference in scan direction. The measurements of θD and θU in equation 2 are given on (a) downward scan and (b) upward scan images, respectively.
Angle method. This technique makes use of the time the AFM tips take to complete an end-to-end scan on a single image. Consider a straight step that starts to move with a constant speed at the time a scan begins (Figure 4). What the tip records during the scan is the position of the step edge at different times along the pathway that the tip travels across the surface. The recorded step (that is, a line that connects the initial position of the step at the starting end and the final position at the finishing end on the completed image) therefore does not represent the actual position and orientation of the step. In fact, the apparent step orientation on the image intersects the true step direction (or the step before movement) at an angle θ. If the original step is not made perpendicular to the fast scan directions, the values of θ will differ on images of upward and downward scans (see Figure 3 in reference 8).
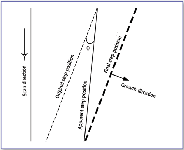
Figure 4. Schematic illustration of the relationship between the actual and the apparent step directions on AFM images.
Assuming that there are measurable values for θ on AFM images, step speed vs can be determined by (8):

where R is the scan rate (line/s), S the scan size, and N the number of lines in the image; θD and θU are the angles between the horizontal axis and the apparent step direction on images of downward and upward scans (Figure 3); θT is the angle between the horizontal axis and the real step direction and can be computed through:

The measurement and calculation can be simplified significantly if the sample orientation or the scan angle is adjusted so that the original step direction is parallel to the y-axis (9). In this case, only the angle between the apparent step direction and the x-axis, θx, is needed for step speed determination (Figure 5a). Upheld by geometry, it can be shown that step speed and θx are related by:

Notice that the readings for θx should be the same on upward and downward scans (in fact, this equality is a convenient check for the truthfulness of the parallel relationship between the genuine step direction and the y-axis). This eliminates the need to make measurements on consecutive images, as in the cases of applying equations 1 and 2.
Another method for measuring θx is to perform an AFM scan with the slow scan axis disabled (9). This allows the tip to scan back and forth only in one dimension. For a moving step, what the tip records consequently is the movement of an individual point (more accurately, a step segment of the size of the tip diameter) on the step edge. The positions of this point at different times constitute a straight line (provided that the speed of movement is constant) and the angle between this line and the x-axis on AFM images is equivalent to θx (Figure 5b). At a constant scan rate, the more deviated θx is from 90°, the faster the step moves. For example, at a typical scanning rate of 6 Hz and a scan size of 5 μm, the measurements of θx at the <441>+ step on calcite {1014} faces changed from approximately 87° to 79° when the saturation index IAP/Ksp (ion activity product/solubility product) increased from ~1.6 to ~4.1, corresponding to a step speed increase from ~3 nm/s to ~11 nm/s (9). This technique is useful particularly for curved or rough steps that might not have a uniform step speed due to the occurrence of curvature at step edges. Application of equation 3 in these cases allows the determination of the speed of different step segments.
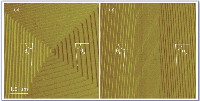
Figure 5. Apparent step orientations on AFM images with (a) full scan and (b) slow scan disabled, showing the angles needed to compute step speed.
Discussion
Although both methods are capable of giving reliable measurements of step speed, each has its own pros and cons. The most important advantage of the indirect method is that it does not require the presence of any fixed reference frames. This often brings significant convenience to experiments. In addition, the indirect method is less prone to errors because it requires only one experimental reading (that is, θ
x
), as opposed to three for the direct method (two readings for distance and one for the time elapsed in between). This might be particularly important on images that have tip-related artifact. For example, when the tip of an AFM probe becomes dull and rough, or the tip breaks and results in irregular tip geometry, blurred (Figure 6a) or multiple (Figure 6b) edges might appear at the steps. This often contributes significant errors to step position measurements in the direct method, but has little effect on angle measurements because the step orientation is not affected by the artifacts.
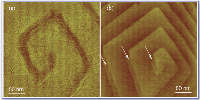
Figure 6. Samples of artifacts that can affect step position measurements on AFM images. (a) Broadened edges due to the tip losing sharpness. (b) Double steps (indicated by the arrows) when the tip has an irregular geometry
As far as step motion is concerned, while the direct method serves better at low step speed, the indirect method is more effective when the step moves fast. When the step speed is so high that the targeted step can grow out of the viewing area between consecutive images, the direct method becomes difficult to use because it is not always easy to locate the same step on different images for displacement measurement. In this situation, the angle method becomes valuable. On the other hand, if step speed is so low that no measurable movement is obtainable within the time span (defined by the N/S ratio) of one AFM scan, the indirect method becomes inoperable because of the unavailability of angle measurements. Quite the opposite, the direct method fits well into this situation as the slow speed makes step displacement an easy measurement.
It is helpful to note that AFM measurements of step kinetics often are limited to atomically flat surfaces, such as cleavage faces of crystals, where mono-molecular layers are present. For rough surfaces (for example, polished or fracture surfaces) or high index crystal faces that are characterized by high density steps or kinks, the growth or dissolution of related materials might not be controlled by a layer spreading/retracting mechanism; therefore, the kinetic processes taking place on these surfaces might not be measured effectively by the methods described in this article.
Acknowledgments
This work was supported by the Office of Basic Energy Science, Department of Energy (Washington, DC), through Grant DE-FG02-02ER15366, and the National Science Foundation (Washington, DC), through Grant EAR 0229763. Thanks go to D. Teng for proofreading the manuscript.
Henry Teng is with the department of chemistry at George Washington University (Washington, DC). E-mail: hteng@gwu.edu.
References
1. G. Binnig, H. Rohrer, Ch. Gerber, and E. Weibel,
Phys. Rev. Lett
.
49,
57–61 (1982).
2. G. Binnig, C.F. Quate, and Ch. Gerber, Phys. Rev. Lett. 56, 930–933 (1986).
3. G.J. Leggett, In Surface Analysis: The Principal Techniques, J.C. Vickerman, Ed. (Wiley & Sons, Chichester, UK, 1997), pp. 393–449.
4. K. Henriksen and S.L.S. Stipp, Am. Min. 87, 5 (2002).
5. C. Kittel, Introduction to Solid State Physics, 6th ed., (Wiley, Hoboken, NJ, 1986), p. 570.
6. W.K. Burton, N. Cabrera, and F.C. Frank, Royal Soc. London Philos. Trans.A243, 299–358 (1951).
7. F.C. Frank, Discussions Faraday Soc., 5, 48–67 (1949).
8. T.A. Land, J.J. De Yoreo, and J.D. Lee, Surf. Sci. 384, 136–155 (1997).
9. H.H. Teng, P.M. Dove, and J.J. De Yoreo, Geochim. Cosmochim. Acta64, 2255–2266 (2000).
High-Speed Laser MS for Precise, Prep-Free Environmental Particle Tracking
April 21st 2025Scientists at Oak Ridge National Laboratory have demonstrated that a fast, laser-based mass spectrometry method—LA-ICP-TOF-MS—can accurately detect and identify airborne environmental particles, including toxic metal particles like ruthenium, without the need for complex sample preparation. The work offers a breakthrough in rapid, high-resolution analysis of environmental pollutants.
The Fundamental Role of Advanced Hyphenated Techniques in Lithium-Ion Battery Research
December 4th 2024Spectroscopy spoke with Uwe Karst, a full professor at the University of Münster in the Institute of Inorganic and Analytical Chemistry, to discuss his research on hyphenated analytical techniques in battery research.
Mass Spectrometry for Forensic Analysis: An Interview with Glen Jackson
November 27th 2024As part of “The Future of Forensic Analysis” content series, Spectroscopy sat down with Glen P. Jackson of West Virginia University to talk about the historical development of mass spectrometry in forensic analysis.
Detecting Cancer Biomarkers in Canines: An Interview with Landulfo Silveira Jr.
November 5th 2024Spectroscopy sat down with Landulfo Silveira Jr. of Universidade Anhembi Morumbi-UAM and Center for Innovation, Technology and Education-CITÉ (São Paulo, Brazil) to talk about his team’s latest research using Raman spectroscopy to detect biomarkers of cancer in canine sera.
