Improved Principal Component Discrimination of Commercial Inks Using Surface-Enhanced Resonant Raman Scattering
In the three decades since its discovery, surface-enhanced Raman scattering (SERS) has been used in numerous applications to increase signal intensity in Raman scattering experiments. The current study provides insight into the more practical aspects of enhanced Raman sampling for laboratory users.
In the three decades since its discovery, surface-enhanced Raman scattering (SERS) has been used in numerous applications to increase signal intensity in Raman scattering experiments. The current study provides insight into the more practical aspects of enhanced Raman sampling for laboratory users. We describe how the signal enhancement from a surface-enhanced resonant Raman scattering (SERRS) process improves the ability to discriminate between ink samples using principal component clustering. Ink treated with silver colloid substrate provides a marked increase in signal-to-noise, directly resulting in improved capability for identification. In addition, this study delineates the ability of SERRS to suppress fluorescence in ink samples and discusses the impact of SERRS automation on laboratory workflows.
The first demonstration of the surface-enhanced Ramanscattering (SERS) effect has been attributed to Fleischmann who, in 1974, waslooking for spectroscopically active probes to monitor electrochemicalprocesses in situ. Using 100 mW of the Ar+ laser line at 514.5 nm,Fleischmann observed a Raman signal from a monolayer of pyridine on a silverelectrode roughened through multiple redox cycles (1). Theoretical predictionsshow that 1 W of Ar+ at 488 nm would provide only about 25 countsper second (cps) using a cooled photomultiplier tube, whereas the team fromSouthampton saw approximately 500–1000 cps with only 1/10 the power (2). Theinvestigators surmised that the increased surface area of the Ag electrodecontributed to an enhanced analyte concentration that made this measurement,known to be extremely difficult at the time, possible.
Van Duyne (3) later repeated and extended Fleischmann’sexperiments, showing that the increase in the Raman signal was so large that itcould not have come from an increase in pyridine concentration at the point ofexcitation. This work also included a Raman collection rate of 40,000 cps at200 mW of excitation power, which was roughly 10–20 times more than previouslynoted. Within a few months, a Journal of the American Chemical Society(JACS) communication appeared also noting that the enhancement seen byFleischmann could not be attributed to surface area (4). Taken together, theseworks can be credited with the discovery of SERS and the now commonunderstanding that it can increase a Raman signal by factors of up to 106.
By the late 1970s it was clearthat SERS was a significant new source of enhanced Raman spectroscopy. Themechanism of this startling new effect, however, would be a matter of vigorousdebate for the next quarter century. The proposal by Van Duyne was that of anelectromagnetic field increase at the surface while others, specificallyCreighton, based on work by Philpott (5), proffered an extension of theresonant Raman effect whereby the electronic absorption peaks of an analytebroaden when adsorbed to a metal surface, providing a resonant enhancement thatwould not otherwise be understood by looking at the UV–vis spectrum of theanalyte in solution. In 1978, Moskovits (6) proposed a mechanism that relied onthe excitation of surface plasmons to account for the electric fieldenhancement, which remains one of the commonly understood, although incomplete,explanations of the SERS phenomenon today. Recent work by Lombardi and Birke(7) brings the complete mechanism of SERS into focus, describing it as theconvergence of multiple resonances within the sample: the excitation of thelocal surface plasmon resonance (LSPR) in the metal surface or particle,defined as a collective oscillation of electrons in the metal conduction bandexcited by the laser; electron charge transfer between the conduction band ofthe metal and the analyte; and intra-analyte resonances. Any of the above threefactors, in a specific analyte–metal system, may be responsible for the SERSenhancement, but the majority of examples of the SERS phenomenon cannot beexplained without all three.
As an analytical technique,SERS continues to grow, aided by seminal discoveries such as the detection of asingle molecule using SERS in Science in 1997 (8). The SERS applicationspace covers areas of research ranging from materials to life sciences toforensics, and multiple commercial vendors, including instrument companies,currently offer products designed for SERS analysis. The number of publicationsusing the acronym “SERS” with a reference to the word “Raman” cited by GoogleScholar was 5400 between 2000 and 2005. Since 2005, the same search criteriafound 11,000 publications. Intellectual property has also followed suit with245 U.S. patent applications on SERS and Raman published from 2000 to 2005 and769 published between 2005 and 2010. SERS substrate design has also emerged asa way to fine tune the response to make the analyses more sensitive, accurate,and precise. Lithographic, inorganic growth, and deposition techniques have emergedas significant contributors to the field bringing new players to spectroscopysuch as Intel (Santa Clara, California), filing over 30 U.S. patents on SERSanalysis and substrate design since 2002.
The analysis of inks inforensic science using Raman spectroscopy including SERS (and surface-enhancedresonant Raman scattering [SERRS]) has emerged as an active area of research(9–15) because of the lack of specificity of existing technology, such assimple electronic absorption (UV–vis), fluorescence, or colorimetry. Althoughthese older technologies continue to hold a place in analytical science for inkanalysis, the chemical specificity of Raman spectroscopy combined with the lowlimits of detection and lessened fluorescence of SERRS have made a significantimpact. Ballpoint pen inks, for example, are mixtures that may include a maindye or multiple dyes in a viscous polymeric suspension with oil or olein, acidsfor lubrication during writing, and drying inhibitors (16) providing a complexmolecular makeup that requires a molecular technique for analysis.
Fluorescence has long been acomplicating factor with Raman, and specifically for analysis of inks withnaturally heavily conjugated systems in the dyes allowing for an easy path toluminescent behavior. There have been many solutions postulated from theinstrument side for suppressing fluorescence, including the use ofFourier-transform (FT) Raman by Hirschfeld and Chase (17) and modern solutionslike gated charge coupled devices (CCDs) and pulsed lasers (18). SERRS has beenfound to be an intriguing solution to fluorescence on the sample side andreports as far back as the 1980s showed samples failing to exhibit an expectedfluorescence background (19–21). Graphene has also shown to be a material thatcan suppress fluorescence in resonance Raman spectroscopy (22).
The application of statistical tools to spectroscopic data iswell known. In particular, the use of principal component data reductiontechniques to do regression and discrimination analyses on large datasets innear-infrared (NIR) analytics has proven critical to the success of thattechnique for analysis in food, pharmaceutical, agriculture, chemicals, andpolymers. For surface-enhanced Raman there are many reports detailing theapplication of chemometric techniques to solve problems including, in largepart, biological samples such as micro-RNA (23), bacteria, and bacterial spores(24). The current study applies the known performance capability of principalcomponent discriminant analysis to the study of commercial inks and shows how asignal enhancement technique (SERRS) makes data collection and analysis simplerand more precise via the suppression of fluorescence and significantly improvedink classification versus regular Raman.
Experimental
Ink samples were prepared by collecting 10 different inksfrom various commercially available sources (ballpoint pens and permanentmarkers — seven black, three blue). A paper template was created that was thesame size and dimensions as a commercial microscope slide. Ink samples weredeposited as spots by writing on the paper. The template was then physicallyattached to a microscope slide for analysis. For the SERRS analysis, a silvercolloid solution was prepared using the standard citrate method as described byLee and Meisel (25). A total of 12 µL of silver colloid was applied to each inkspot, in three µL aliquots, allowing time between each application for drying.Ink samples were also prepared without silver colloid and analyzed as acontrol.
Raman spectra of thecolloid-treated and untreated samples were collected using a Thermo Scientific(Waltham, Massachusetts) DXR Raman microscope equipped with a 532-nm laser, a10× microscope objective, amotorized microscope stage, and brightfield/darkfield illumination. The laserpower used was 2 mW at the sample, with a 25-µm slit aperture. At each location30 1-s scans were collected. A 12-spot microscope slide template was used, witha 13 × 13 stepgrid per sample spot with a 50-µm step between sampling locations, resulting ina total of 169 spectra over a sample area of 650 µm × 650 µm per ink spot.
Thermo Scientific OMNIC Array Automation is an automatedcollection and analysis routine for multiple samples. Array Automation controlsthe movement of the motorized stage and coordinates the stage movement with thespectral data collection of the samples. Software templates for many commonmultisample platforms, such as 96- or 384-well plates, plus new templates caneasily be created in the software. A template for a 12-spot microscope slidewas created and used for data collection.
Within Array Automation there are several options for datacollection. A single spot for each position can be collected, or a grid ofspectra can be collected for each position. If multiple spectra per positionare desired, a grid of points up to 13 × 13 can be collected. For a grid collection, there are two parameters that canbe customized: step size between points and overall grid size. When a grid iscollected, either each individual spectrum can be saved or an average spectrumfor each location can be generated. For irregular samples or samples that don’tfill the entire analysis area, there are two options for optimal datacollection: The software can search for the strongest signal using a definedgrid or the user can manually search the sample and focus on each sample locationbefore collection.
UV–vis transmittance spectra were collected on a ThermoScientific Evolution 600 UV–vis spectrophotometer equipped with a diffusetransmittance accessory (DTA). This accessory uses a high-performance,double-beam Spectralon 60-mm integrating sphere with a port fraction of <3%that traps and measures all forward-scattered light. Use of the DTA enablesmeasurements on scattering samples that cannot be measured at all in atraditional 180° UV–vis transmittance experiment. Samples were spotted on aKimwipe cleaning tissue (Kimberly-Clark, Irving, Texas) and affixed to thefront entrance optic for the DTA. A cleaning tissue without ink was used as thebackground. No background fluorescence or errant peaks were noted from thespectra of the blank cleaning tissue.
The two ink datasets (SERRS andnon-SERRS) for all 10 inks were treated with identical chemometric analysesusing Thermo Scientific TQ Analyst software. A discriminant analysisclassification algorithm was chosen with which a unique distribution of variancefor each class was calculated. This is similar to soft independent modeling ofclass analogy (SIMCA) in that it computes the sample variation of each classinstead of computing a general variation for all classes. To aid in thechemometric analysis, a multiplicative signal correction (MSC) algorithm wasalso applied to account for the inherent differences in pathlength for eachsample spectrum. A total of 15 principal components was used in the chemometriccalculations and accounted for greater than 99% of the variation within thespectra. The spectra for both sample sets were analyzed using the secondderivative and a Norris smoothing filter (segment length 17; gap distancefour). The spectral region chosen for the analysis was between 1685 cm-1and 1130 cm-1.
Results and Discussion
A critical earlydetermination of the current study was whether the signal enhancement noted inthe ink samples included a resonant Raman effect. This question is readilyaddressed using UV–vis absorption spectroscopy. The resulting spectra are shownin Figure 1 and the maximum of each is shown in Table I. All the inks, bothblue and black, had absorption maxima centered roughly around 600 nm. Usingthese spectra as a guide, we chose the 532-nm laser for the DXR spectrometer togain the best sensitivity for the experiment versus the 633-nm laser. Whereaseither the 532-nm or 633-nm laser would work well in terms of the resonanteffect, the sensitivity increase from the higher frequency laser was desirable.The 780-nm laser was not chosen because all of the electronic transitions areat higher energy for these samples and would likely lead to a loss insensitivity.
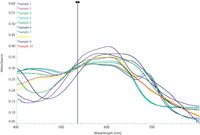
Figure 1: UVâvis absorption spectra of all 10 inks with the highlighted region (left and right black arrows) showing the location of the 532-nm laser excitation.

Table I: Ink sample set description, color, and λmaxThe collected SERRS spectraare shown in Figure 2, with representative spectra of each ink class. Sampleswere prepared by marking the respective inks onto paper templates, mounting thetemplates onto slides, and automatically doing the analysis via ArrayAutomation. Each ink spot was analyzed in a 13 × 13 grid totaling 169 spectra per ink. The spectraare shown as the second derivative for ease of discrimination both visually andwithin the discriminant analysis algorithm. Raman signal enhancement isevidenced by the single-point spectra of sample 1 shown in Figure 3. Thesignal-to-noise ratios of all of the spectra were calculated for both theSERRS-enhanced and nonenhanced samples by measuring the maximum peak height inthe Raman shift range between 2000 cm-1 and 400 cm-1 anddividing it by the root mean square (RMS) noise taken from the relativelyfeatureless region from 2450 cm-1 to 2000 cm-1. Anaverage signal-to-noise ratio of all the SERRS-enhanced spectra was found to be195, whereas the average across all nonenhanced spectra was 35, a fivefoldincrease. Individual spectra, however, exhibited signal-to-noise enhancementfactors ranging from 8 to 250.
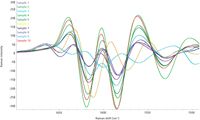
Figure 2: Second-derivative Raman spectra of representative spectra for each ink class showing the spectral similarities and differences.
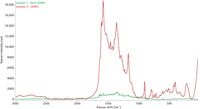
Figure 3: Signal-to-noise enhancement shown in sample 1.
As stated in the introduction,fluorescence reduction is known to be another advantageous SERRS effect. Themechanism of this reduction comes from the ability of the metal to provide theanalyte a pathway for nonradiative decay in contrast to the native analytealone. This, in itself, will result in lower fluorescence from the analyte asfluorescence arises via a radiative decay pathway. Figure 4 shows thedifference for sample 9, a black permanent ink, in terms of fluorescencereduction. The non-SERRS spectrum has a broad baseline feature centered at 1300cm-1 in addition to a broad, low-level feature centered at 2600 cm-1.The SERRS spectrum, in addition to excellent signal-to-noise improvements,exhibits none of the fluorescence found in the non-SERRS samples. The twospectra chosen for comparison in Figure 4 are representative of all the otherspectra collected within the same spot. All the spectra originating from inksample 9 without colloid exhibited significant fluorescence and had very poorsignal-to-noise.
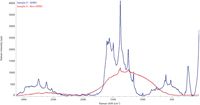
Figure 4: Fluorescence reduction of the SERRS-enhanced ink sample compared to the non-enhanced in sample 9.
The principal component (PC)scores plot for all 10 ink classes showing the PC 1 vs. PC 5 space is shown inFigure 5. Although in this view it is difficult to visually resolve all the inkclusters, the algorithm takes into account all the PCs in its analysis. Themain thrust of the comparison is identifying the number of misclassifiedspectra within the PC analysis from SERRS to non-SERRS spectra while keepingthe chemometric treatment identical. This should provide a reasonable guide tothe integrity of discriminant classifications with SERRS measurements versusnon-SERRS for highly similar, fluorescent compounds like inks. In addition,this will also shed some light on the reliability of the measurement in termsof a high-throughput laboratory. Among approximately 1500 spectra spanning 10classes of inks, 97.3% of the SERRS-enhanced spectra were correctly identifiedand classified into their respective ink types compared to only 48.3% correctlyidentified for the nonenhanced samples. In addition, the majority of theremaining 2.7% misclassified for the SERRS spectra were due to themisclassification between only two ink classes, samples 4 and 5. These two inkswere found to be extremely similar using a visual comparison of their Ramanspectra, shown in Figure 6.
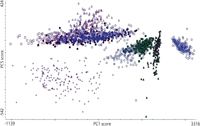
Figure 5: Principal component scores plot of PC1 versus PC5 showing discrimination between ink classes. This figure only shows one dimension of the discrimination solution so not all the classes are fully separated in this plot.
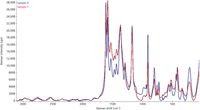
Figure 6: Representative spectra from samples 4 and 5 showing the similarity between the two inks.
Conclusion
A total of 10 samples of commercial ink were analyzedusing a dispersive Raman microscope. Significant signal enhancement wasobserved compared with the native samples, demonstrating the well-known SERRSenhancement. UV–vis spectra were collected on the same sample set spotted on adifferent support using diffuse transmittance to confirm that the functionalmechanism is a resonant Raman effect (SERRS) when using a 532-nm excitationlaser. In addition, a fluorescence suppression was noted, allowing for improvedthroughput. Array Automation sampling was also shown to be a significant timesavings in routine analyses. SERRS Raman analysis has been shown tosignificantly increase the accuracy of discrimination among commercial inksamples using principal component techniques versus non-SERRS Raman analysis.
References
(1) M.Fleischmann, P.J. Hendra, and A.J. McQuillan, J.Chem. Phys. Lett. 26,123 (1974).
(2) C.L. Haynes, C.R. Yonzon, X. Zhang, and R.P. VanDuyne, J. Raman. Spectrosc. 36, 471 (2005).
(3) D.L. Jeanmaire and R.P. Van Duyne, J. Electroanal. Chem.84, 1 (1977).
(4) M.G. Albrecht and J.A. Creighton, J. Am. Chem. Soc. 99, 5215 (1977).
(5) M.R. Philpott, J.Chem. Phys.62,1812 (1975).
(6) M.J. Moskovits, J.Chem. Phys.69,4159 (1978).
(7) J.R. Lombardi and L.R. Birke, Acc. Chem. Res.42(6), 734 (2009).
(8) S. Nie and S.R. Emory, Sci.275,1102 (1997).
(9) C. Rodger, G. Dent, J. Watkinson, and W.E. Smith, Appl. Spectrosc. 54, 1567 (2000).
(10) T.Andermann, Prob. Foren. Sci.XLVI, 335 (2001).
(11) E. Fabianska and M. Trzcinska, Prob. Foren. Sci.XLVI, 383 (2001).
(12) E. Wagner and S. Clement, Prob. Foren.Sci. XLVI, 437 (2001).
(13) R.M. Seifar, J.M. Verheul, F. Ariese, U.A.T.Brinkman, and C. Gooijer, Analyst 126, 1418 (2001).
(14) J. Zieba-Palus and M. Kunicki, Foren. Sci. Int.158, 164 (2006).
(15) I. Geiman, M. Leona, and J.R. Lombardi J. Foren. Sci.54, 947 (2009).
(16) J. Zieba-Palus and M. Kunicki, Foren. Sci. Int.158, 164 (2006).
(17) T. Hirschfeld and B. Chase, Appl. Spectrosc. 40, 133 (1986).
(18) D.V. Martyshkin,R.C. Ahuja, A. Kudriavtsev, and S.B. Mirov, Rev. Sci. Instrum. 75, 630(2004).
(19) A. Bachackashvilli, S. Efrima, B. Katz, and Z.Priel, Chem. Phys. Lett. 94, 571 (1983).
(20) K. Kneipp, G. Hinzmann, and D. Fassler, Chem. Phys. Lett.99, 5 (1983).
(21) B. Pettinger, Chem. Phys. Lett.110, 576(1984).
(22) L. Xie, X. Ling, Y. Fang, J. Zhang, and Z. Liu JACS131, 9890 (2009).
(23) J.D. Driskell, A.G. Seto, L.P. Jones, S. Jokela,R.A. Dluhy, Y.-P. Zhao, and R.A. Tripp,Biosens. Bioelectron. 24,923 (2008).
(24) J. Guicheteau, L. Argue. D. Emge, A. Hyre, M. Jacobsen, and S. Christesen, Appl.Spectrosc. 62,267 (2008).
(25) P.C. Lee and D. Meisel, J. Phys. Chem.86,3391 (1982).
JeffreyHirsch is chief scientist for molecular and microanalysis, Timothy O. Deschainesis a product specialist, and Todd Strother is an applicationsscientist, all at Thermo Fisher Scientific in Madison, Wisconsin.

AI-Powered SERS Spectroscopy Breakthrough Boosts Safety of Medicinal Food Products
April 16th 2025A new deep learning-enhanced spectroscopic platform—SERSome—developed by researchers in China and Finland, identifies medicinal and edible homologs (MEHs) with 98% accuracy. This innovation could revolutionize safety and quality control in the growing MEH market.
New Raman Spectroscopy Method Enhances Real-Time Monitoring Across Fermentation Processes
April 15th 2025Researchers at Delft University of Technology have developed a novel method using single compound spectra to enhance the transferability and accuracy of Raman spectroscopy models for real-time fermentation monitoring.
Nanometer-Scale Studies Using Tip Enhanced Raman Spectroscopy
February 8th 2013Volker Deckert, the winner of the 2013 Charles Mann Award, is advancing the use of tip enhanced Raman spectroscopy (TERS) to push the lateral resolution of vibrational spectroscopy well below the Abbe limit, to achieve single-molecule sensitivity. Because the tip can be moved with sub-nanometer precision, structural information with unmatched spatial resolution can be achieved without the need of specific labels.