In situ Monitoring of Double Metal Cyanide (DMC) Catalyst Synthesis by Raman Spectroscopy
Double metal cyanide (DMC) catalyst is widely used for the alkoxylation reaction to produce polyether polyol from ethylene/propylene/butylene oxides. It is challenging to optimize the synthesis process, due to the lack of real-time understanding of the speciation of the reaction mixture. Powder X-ray diffraction (XRD), transmission electron microscopy (TEM), and actual alkoxylation reaction performance are effective ways for the evaluation of success of each synthesis, but it is difficult to guide process optimization. An in situ Raman method is developed in this study to monitor the DMC catalyst synthesis in real time to accelerate the process optimization. The synthesis involves the reaction of ZnCl2 and K3Co(CN)6 (KHCC) to form Zn3[Co(CN)6]2 (ZHCC). ZHCC is then converted to DMC in the presence of excess of t-butanol and ZnCl2 in the second step. Characteristic KHCC Raman peaks were observed at 2138 and 2153 cm-1, ZHCC at 2185 and 2206 cm-1, and DMC at 2203 and 2225 cm-1, respectively. This enables realtime tracking of both steps’ conversion. Both t-butanol and ZnCl2 concentrations were found to substantially influence the kinetics of DMC formation, but not the Raman spectra of the final DMC products. The reaction time could be adjusted from hours to minutes through the control of reactant concentrations.
Double metal cyanide (DMC) and potassium hydroxide serve as catalysts for the manufacture of polyether polyols from ethylene oxide (EO), propylene oxide (PO), and butylene oxide (BO). The heterogeneous catalyst, DMC, is replacing the incumbent potassium hydroxide (KOH) technology which requires an added neutralization step (1). Another drawback with KOH catalyst is the competitive side polymerization initiated by allylic alkoxides affecting the polyol end properties, but this can be resolved by using DMC. The DMC technology has a reduced “footprint” compared to KOH, as it has lower unreacted oxide concentrations (hence safer design), lower capital and maintenance costs, and reduced energy consumption.
DMC catalyst technology was developed in the 1960s; however, there is still debate over the actual structure of the Lewis acid and the active site for alkoxylation. The quality of DMC is highly sensitive to the method of preparation and is dictated by a combination of factors: order and rate of addition of reactants, type of agitation, concentration of reactants and rinse solutions, and mixing time. A potential risk with making DMC is the final material can be inactive. Synthesizing DMC in a reproducible manner is therefore the first step in de-bottlenecking the scale-up process. In the invention by Kuyper and associates, it is noted that alkali metal ions, in particular sodium and potassium ions, act as catalyst poisons in the polymerization reaction of epoxides using DMC catalysts (2). Another observation by Le-Khac is the necessity to wash away potassium chloride (KCl), as it will render the catalyst inactive if not removed (3). Based on prior literature, catalyst characterization is carried out after the entire work flow (multiple washing and drying steps) which is time- and effortintensive. These characterization tools typically include X-ray powder diffraction, elemental analysis, and scanning electron microscopy (4).
Huang and associates synthesized DMC with various water soluble Zn salts such as zinc chloride, zinc sulfate, and zinc acetate with complexing agents such as t-butanol, dioxane, tetrahydrofuran, and dimethoxyethane to observe that the DMC made using zinc chloride and t-butanol (t-BuOH) showed highest specific rate of polyether polyol formation (5). Catalytic activity is strongly dependent on the composition of catalysts and the morphology of DMC complexes (6). Several earlier studies demonstrated that Raman spectroscopy can potentially be a sensitive technique to investigate metal cyanides (7–9). In this work, the use of Raman spectroscopy for real-time monitoring of DMC formation is reported, in particular the DMC containing Zn and Co. The following two steps are monitored.
- Reaction between potassium hexacyanocobaltate (KHCC) and zinc chloride (ZnCl2) resulting in the formation of zinc hexacyanocobaltate (ZHCC): 3ZnCl2 + 2K3[Co(CN)6] → Zn3(Co(CN)6)2 + 6KCl
- Complexation of ZHCC with t-butanol (t-BuOH) and water in the presence of excess ZnCl2 to form the active DMC complex: Zn3(Co(CN)6)2 + xZnCl2 + ytBuOH + zH2O → Zn3(Co(CN)6)2 · x ZnCl2 · y t-BuOH · zH2O
Note that from here on, DMC specifically refers to the active DMC catalyst, but not the KHCC starting material, or the ZHCC intermediate.
In industrial research, it is important to find optimal processes to produce product. Often, many competing fac tors are involved. Therefore, it is challenging to understand how these variables may impact the process. Raman spectroscopy is found to be a powerful tool that yields real-time process information enabling researchers to track reaction conversion without having to carrying out tedious ex situ analysis, and thus, accelerates overall project progress. To demonstrate the utility of in situ Raman spectroscopy for such process development and optimization, two example synthesis routes are included, with DMC-A route being the initial recipe prior to optimization, and DMC-B route being the improved process.
Materials and Methods
Materials
Potassium hexacyanocobaltate (III) (≥ 97.0%), zinc chloride (≥ 98.0%), t-butanol (≥ 99.0%), potassium chloride (≥ 99.0%) were used as received from MilliporeSigma. Zinc hexacyanocobaltate was purchased from Alfa Chemistry.
DMC Synthesis
A design of experiment (DOE) approach was used to explore the vast process variable space. Results from two such experiments are presented to demonstrate the utility of in situ Raman monitoring. These two synthesis protocols will be referred to as DMC-A and DMC-B, with the major difference between them being the relative molar ratio of ZnCl2 to KHCC, the sequence of reagent addition, and also several other process differences as described below.
DMC-A (7.6 Molar Equivalent of ZnCl2 Relative to KHCC)
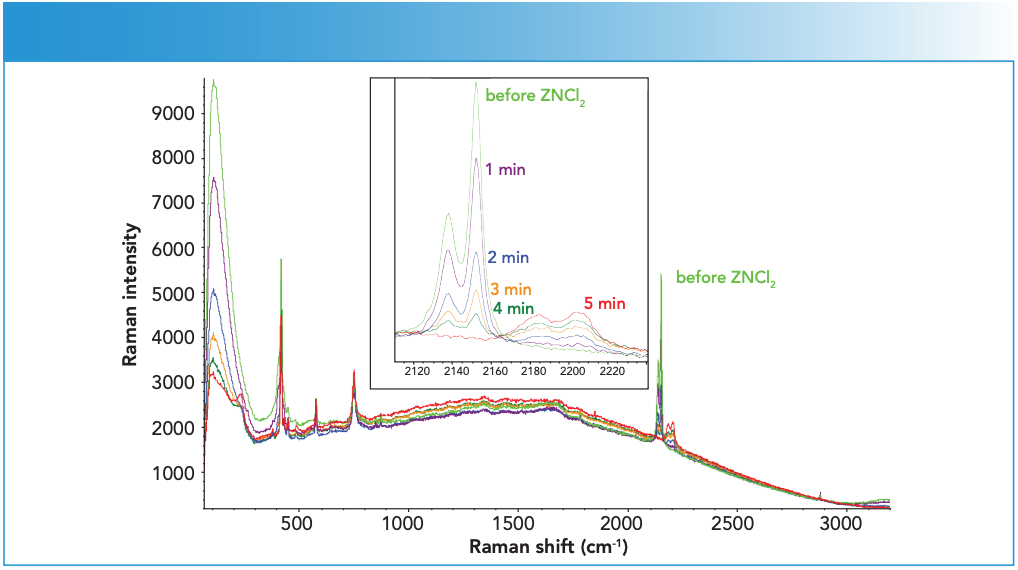
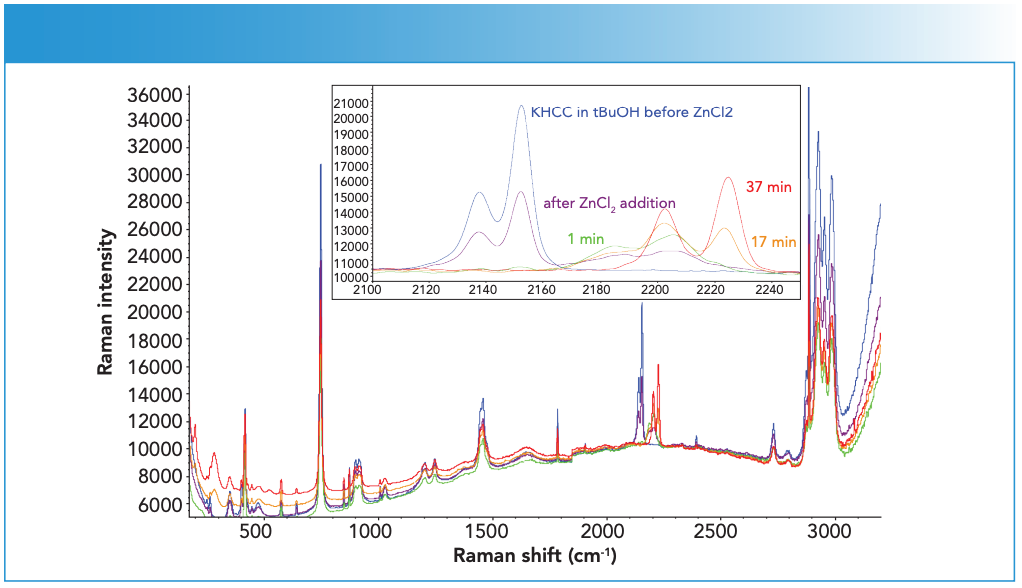
In Step 1 of DMC-A, aqueous zinc chloride solution (97.5 g, 38.5 wt% ZnCl2) is added at 4 mL/min using a peristaltic pump to a solution containing KHCC and water (222 g, 5.4 wt% KHCC). The process is carried out in a 1 L jacketed glass reactor under atmospheric pressure at 300 in the aqueous solution, which was almost identical to those observed in the solid form. As ZnCl2 solution was added, both peaks diminished in a proportional manner, and concurrently a pair of new peaks at 2185 and 2204 cm-1 started to gain intensity. These new peaks are believed to be from ZHCC, since their positions closely matched the two lower frequency peaks observed in solid ZHCC at 2192 and 2205 cm-1. It can then be inferred based on such results that the 2224 cm-1 peak observed in the earlier sample (see Figure 1) is likely from a partially dehydrated material.
Figure 1: Reference Raman spectra from solid phase ZHCC (blue), t-butanol (green), DMC catalyst (red), and KHCC (orange). Spectra are offset for clarity. Raman intensity in a.u. is the ordinate axis.
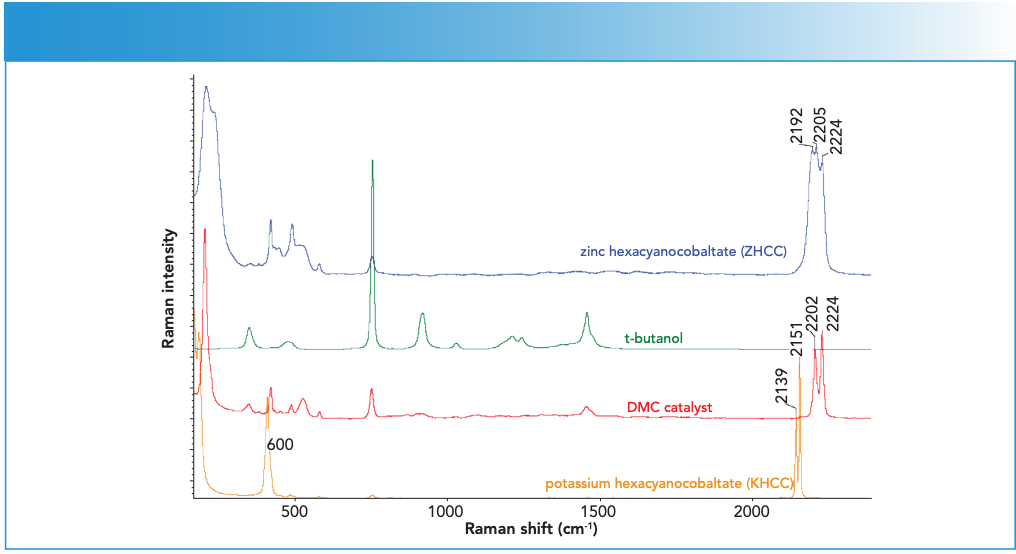
The almost identical peak positions of ZHCC to that reported for DMC-I (12) provided strong evidence that the DMC-I in the earlier paper was actually ZHCC hydrate, instead of DMC. A close examination of the reference showed that the DMC-I solid cake was washed with DI water, which is believed to convert DMC back to ZHCC. Such sample preparation induced changes further highlight the importance of in situ analysis for such unstable samples.
The sapphire window gave rise to several sharp features at 378, 418, 431, 450, 577, and 750 cm-1. Several other weak features could also be observed between 200 and 300 cm-1 region towards the end of ZnCl2 addition. The ZnCl2 solution itself showed a weak feature around 300 cm-1. The 200 cm-1 feature was consistent with that of ZHCC catalyst (see red spectrum in Figure 2 for comparison). It should be noted that, although the end ZHCC signal appeared to be substantially weaker than that of starting KHCC, this was mostly due to the decrease in the sampling volume as the system changed from a clear KHCC solution to a highly turbid ZHCC suspension. Such a turbidity change also led to the suppression of the water signal above 3000 cm-1 as shown in Figure 2.
Figure 2: Representative spectra from Step 1 synthesis during ZnCl2 solution addition to KHCC solution. Inset shows an enlarged view of the C≡N stretching region. Raman intensity in a.u. is the ordinate axis.
Step 2: ZHCC to DMC
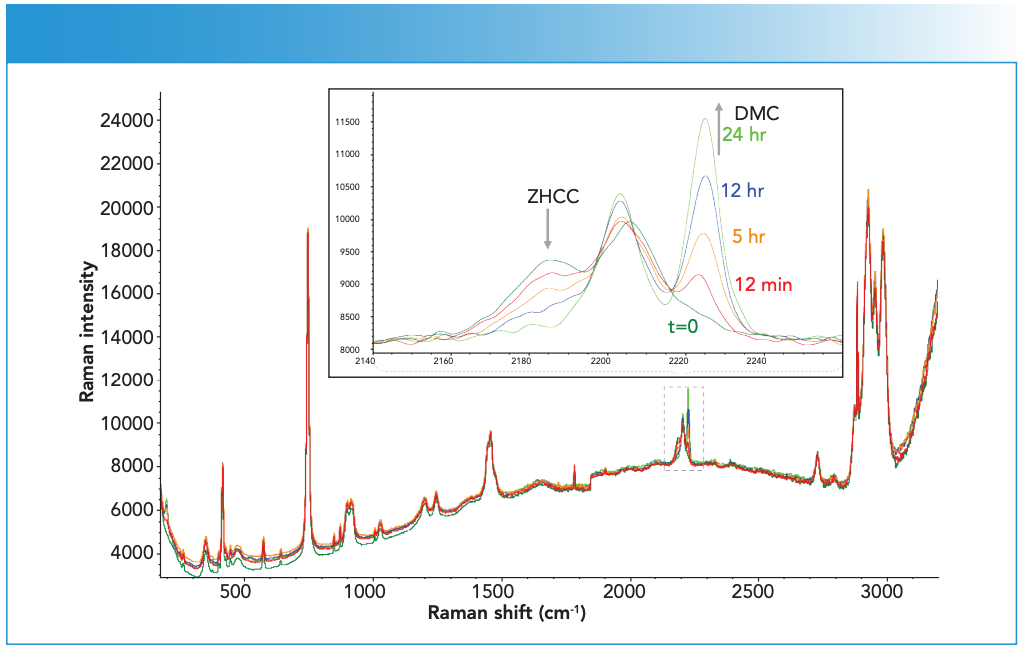
Figure 3 shows representative spectra from DMC-A during the ZHCC to DMC conversion. The number in the figure refers to the spectrum number, with 115 being the first spectrum collected during this stage. All spectra are normalized to the t-BuOH 750 cm-1 peak for ease of comparison. A monotonic decrease of the ZHCC peaks at 2185 and 2206 cm-1 was observed concurrent with a monotonic increase of the DMC peaks at 2203 and 2225 cm-1. In the region around 200 cm-1, spectral changes corresponding to the ZHCC to DMC transformation could also be observed, though they were of weaker intensity and sitting on a large slope of a strong feature (unknown origin).
Figure 3: Representative spectra from Step 2 synthesis. Labels specify the time of spectral collection after the t-BuOH addition. Raman intensity in a.u. is the ordinate axis.
The close proximity of the DMC and ZHCC CN stretch peaks would lead to significant inter ference based on simple peak area analysis. As a result, classical least squares (CLS) analysis was used for spectral deconvolution (13,14). The two pure component spectra used were the starting ZHCC spectrum and the end spectrum of the final DMC product. The 2160 to 2240 cm-1 spectral region of each reac tion spectrum, after a linear baseline correction, is assumed to be a linear combination of these two pure component spectra. The weight, or CLS response, of both components can then be used to track their relative concentration more effectively than univariate spectral analysis such as peak height or area. Figure 4 shows the CLS response of the ZHCC and DMC components.
Figure 4: Time-dependent ZHCC to DMC transformation as reflected by the CLS response of the two components from a representative reaction (DMC-A).
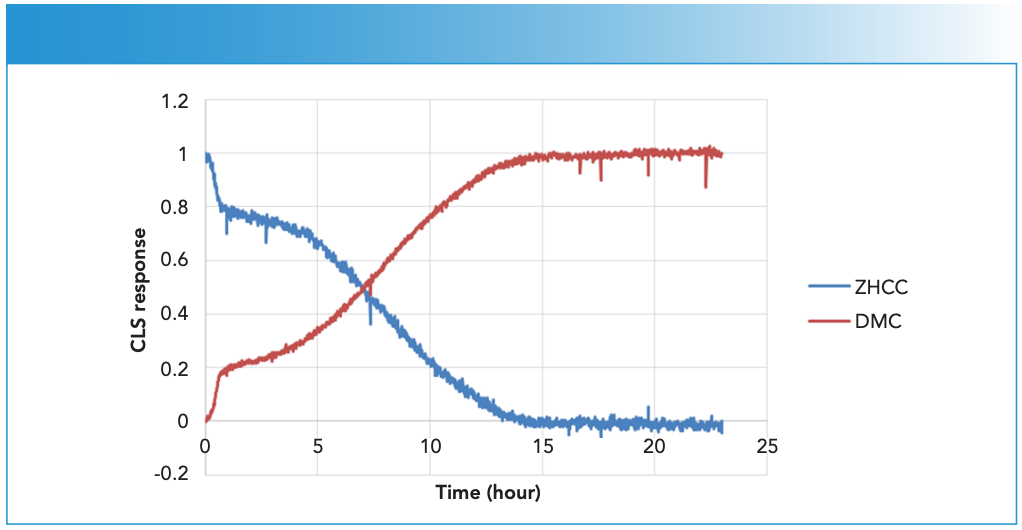
The rate of ZHCC to DMC conversion appeared to accelerate in the first 40 min of the reaction, presumably due to the continuous feed of ZnCl2 during this period, which led to a faster reaction rate. Upon completion of ZnCl2 feed, the conversion continued but at a slower rate, though the rate appeared to increase about 5 hours into the reaction, and full conversion appeared to be reached after about 15 hours.
DMC-B
DMC-A is time-intensive and thus costly to scale up as an industrial process. Based on reaction kinetics insights from both the in situ Raman results and other complementary tools, a new DMC-B procedure is identified. Instead of adding tBuOH in a separate step, it is included initially in the solution. A higher ZnCl2 concentration was also used. These process changes led to a greatly accelerated process. Figure 5 shows the representative reaction spectra from synthesis of DMC-B. The overall spectral changes are consistent with those observed in DMC-A, with KHCC bands first giving way to transient ZHCC bands (similar to that observed in DMC-A Step 1) which eventually all converged to DMC bands (similar to that observed in DMC-A Step 2).
Figure 5: Representative reaction spectra from DMC-B. Raman intensity in a.u. is the ordinate axis.
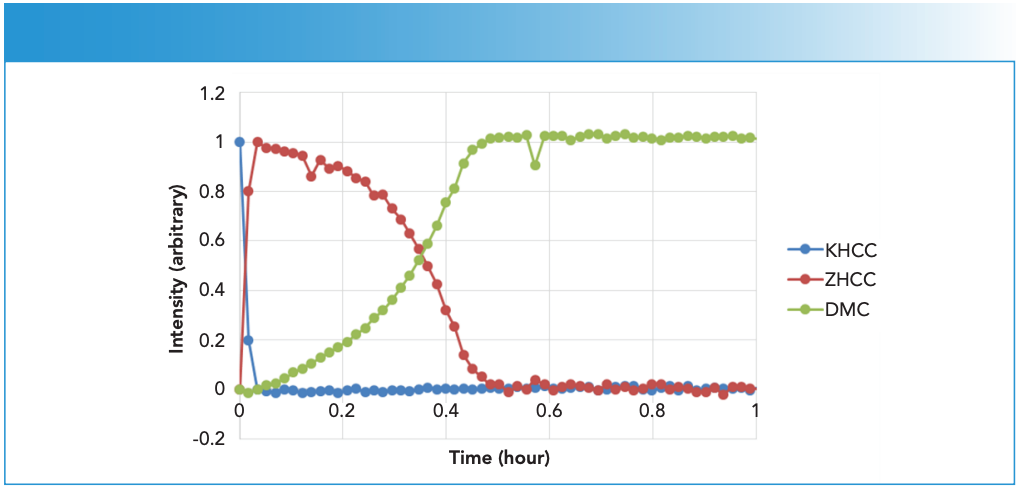
The rate of reaction for DMC-B was an order of magnitude faster than that observed for DMC-A, as clearly illustrated by comparing Figure 4 to Figure 6. The ZHCC signal appeared to be completely consumed after 0.5 hr, which coincided with the DMC signal reaching its maximum.
Figure 6: Time-dependent KHCC, ZHCC and DMC CLS profiles from DMC-B.
Conclusions
In situ Raman was used to monitor the DMC synthesis for the first time. Characteristic CN stretch bands were identified from KHCC, ZHCC, and DMC, enabling real-time tracking of the reactions throughout the KHCC to ZHCC and finally to DMC stages. While the KHCC to ZHCC appears to be robust and straightforward, the ZHCC to DMC reaction is demonstrated to be more sensitive to process conditions. The use of the in situ Raman method was especially useful in this study because it eliminated the need of multiple sample withdrawal for off-line analysis. Real-time reaction progress information from in situ Raman results enabled researchers to accurately determine the reaction end point. Even though conventional off-line analytical tools such as XRD, TEM, and actual alkoxylation reaction performance test are needed to fully characterize the final DMC catalyst product, in situ Raman results accelerated the completion of the DOE study, which drastically reduced reaction time from more than 10 hours to about 0.5 hours. This study clearly demonstrates the power of in situ Raman monitoring of industrial processes.
References
(1) Herzberger, J.; Niederer, K.; Pohlit, H.; Seiwert, J.; Worm, M.; Wurm, F. R.; Frey, H. Polymerization of Ethylene Oxide, Propylene Oxide, and Other Alkylene Oxides: Synthesis, Novel Polymer Architectures, and Bioconjugation. Chem. Rev. 2016, 116, 2170–2243 (2016). DOI: 10.1021/acs.chemrev.5b00441
(2) Kuyper, J.; Schaik-Struykenkamp, P. v. Process for the Polymerization of Epoxides. U.S. Patent US4472560A, 1984.
(3) Le-Khac, B. Highly Active Double Metal Cyanide Catalysts. U.S. Patent US5482908A, 1996.
(4) O’Connor, J. M.; McAdon, M. H.; Laycock, D. E. New DMC Catalysts for Manufacturing Polyols. In API Polyurethanes Expo 2001. Taylor & Francis, 2001.
(5) Huang, Y. J.; Qi, G. R.; Chen, L. S. Effects of Morphology and Composition on Catalytic Performance of Double Metal Cyanide Complex Catalyst. Appl. Catal. A-Gen. 2003, 240, 263–271. DOI: 10.1016/S0926-860X(02)00452-0
(6) Kim, I.; Ahn, J.-T.; Ha, C. S.; Yang, C. S.; Park, I. Polymerization of Propylene Oxide by Using Double Metal Cyanide Catalysts and the Application to Polyurethane Elastomer.Polymer 2003, 44, 3417–3428. DOI: 10.1016/S0032-3861(03)00226-X
(7) Lukey, G.; Van Deventer, J.; Huntington, S.; Chowdhury, R.; Shallcross, D. Raman Study on the Speciation of Copper Cyanide Complexes in Highly Saline Solutions. Hydrometallurgy 1999, 53, 233–244. DOI: 10.1016/S0304-386X(99)00047-X
(8) Cho, K.; Jang, Y. S.; Gong, M.-S.; Kim, K.; Joo, S.-W. Determination of Cyanide Species in Silver and Gold Plating Solutions by Raman Spectroscopy. Appl. Spectrosc. 2022, 56, 1147–1151. DOI: 10.1366/000370202760295377
(9) Nakamoto, K. Infrared and Raman Spectra of Inorganic and Coordination Compounds.; John Wiley & Sons, Inc., 1977.
(10) McAllister, W. A. Raman Spectrum of Potassium Hexacyanocobaltate (III). J. Chem. Phys. 1970, 52, 2786–2787. DOI: 10.1063/1.1673385
(11) Swanson, B. I. Aspects of the Structure and Bonding in Prussian Blues. Single-Crystal Raman Study of Trimanganese Hexacyanocobaltate Hydrate (Mn3[Co(CN)6].xH2O) and Tricadmium Bis(hexacyanocobaltate) Hydrate (Cd3[Co(CN)6]2.xH2O). Inorg. Chem. 1976, 15, 253–259. DOI: 10.1021/ic50156a002
(12) Sebastian, J.; Darbha, S. Structure-Induced Catalytic Activity of Co–Zn Double-Metal Cyanide Complexes for Terpolymerization of Propylene Oxide, Cyclohexene Oxide and CO2. RSC Adv. 2015, 5, 18196–18203. DOI: 10.1039/C5RA00299K
(13) Haaland, D. M.; Easterling, R. G. Application of New Least-Squares Methods for the Quantitative Infrared Analysis of Multicomponent Samples. Appl. Spectrosc. 1982, 36, 665–673. DOI: 10.1366/0003702824639114
(14) Haaland, D. M.; Easterling, R. G.; Vopicka, D. A. Multivariate Least-Squares Methods Applied to the Quantitative Spectral Analysis of Multicomponent Samples. Appl. Spectrosc. 1985, 39, 73-84. DOI: 10.1366/0003702854249376
About the Authors
Xiaoyun Chen is with Analytical Science at Dow Chemical, in Midland, Michigan. Mrunmayi Kumbhalkar, Jason Fisk, and Brian Murdoch are with Engineering & Process Sciences, at Dow Chemical, in Midland, Michigan. Direct correspondence to: xchen4@dow.com

AI-Powered SERS Spectroscopy Breakthrough Boosts Safety of Medicinal Food Products
April 16th 2025A new deep learning-enhanced spectroscopic platform—SERSome—developed by researchers in China and Finland, identifies medicinal and edible homologs (MEHs) with 98% accuracy. This innovation could revolutionize safety and quality control in the growing MEH market.
New Raman Spectroscopy Method Enhances Real-Time Monitoring Across Fermentation Processes
April 15th 2025Researchers at Delft University of Technology have developed a novel method using single compound spectra to enhance the transferability and accuracy of Raman spectroscopy models for real-time fermentation monitoring.
Nanometer-Scale Studies Using Tip Enhanced Raman Spectroscopy
February 8th 2013Volker Deckert, the winner of the 2013 Charles Mann Award, is advancing the use of tip enhanced Raman spectroscopy (TERS) to push the lateral resolution of vibrational spectroscopy well below the Abbe limit, to achieve single-molecule sensitivity. Because the tip can be moved with sub-nanometer precision, structural information with unmatched spatial resolution can be achieved without the need of specific labels.