Interelement Corrections in Spectrochemistry
This tutorial reviews the mathematical models for dealing with interelement effects in optical emission and X-ray fluorescence spectrochemical analysis. Line overlaps and matrix effect corrections are examined.

In spectrochemical analysis, we wish to convert measured spectral line intensities to concentration of the elements present in the sample. This is the process known as calibration. For a linear calibration, this function takes the general form y = mx + b:
Ci = A0 + A1Ii [1]
where Ci is the concentration of element i and Ii is the measured spectral line intensity. (Note: This measured intensity may be either total or net intensity, that is, peak minus background.)
Here we wish to address one important aspect of this calibration process, the correction of interelement effects. In general, there are two types of interelement interferences, spectral line overlaps and so-called matrix effects.
Line Overlap Correction
A spectral line overlap occurs when spectral lines of two (or more) elements contained in the sample are so close to one another that they cannot be resolved by the spectrometer. This results in the signal in the region of interest having more than one potential origin.
The degree of line overlap will vary for the same spectral line depending upon the resolution of the spectrometer. In optical emission spectrometry (OES), this resolution is determined by the instrument optical design, including the grating, focal length, and the dimensions of the entrance and exit slits. For a Paschen–Runge optical system with a 0.75-m focal length, 3600 grooves/mm grating, 15-μm entrance slit and 50-μm exit slit, the resolution is about 0.01 nm. In energy dispersive X-ray fluorescence (EDXRF), this is determined by the detector resolution, standardized as the full-width at half-maximum (FWHM) of the 5.9-keV manganese Kα line. (Note: The Kα X-ray occurs due to the transition of an L-shell electron filling the vacancy left after excitation has resulted in the ejection of a K-shell electron [1].) Resolutions of about 150 eV are common for laboratory EDXRF instruments. Clearly, the better the instrument resolution, the less the line overlap problem.
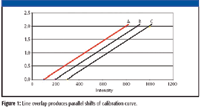
Figure 1: Line overlap produces parallel shifts of calibration curve.
With a line overlap, we will always measure too much intensity for the given spectral line. This results in parallel shifts of the calibration curve, as shown schematically in Figure 1. This figure shows the intensity plotted along the x-axis and the concentration along the y-axis. This might seem backward at first, as the concentration normally would be viewed as the "known" or independent variable. However, when plotting calibration curves, the intensity is known and the concentration is to be determined. Let "A" be the calibration curve with zero interfering element, then "B" will be the calibration curve for samples containing, for example, 5% of the interfering element, and "C" for samples containing 10% of this interfering element.
Examples from OES
- The important carbon spectral line at C I 193.07 nm is interfered by the neighboring aluminum line at Al II 193.1 nm. Unless we correct for this line overlap, our carbon results will be incorrectly high for steels containing aluminum.
- The sensitive zinc spectral line at Zn I 213.86 nm is adjacent to a copper spectral line at Cu II 213.59 nm.
- Table II of EPA Method 6010B for inductively coupled plasma (ICP)-OES lists potential interferences for commonly used spectral lines (2).
Examples from XRF
- Z and Z-1 Interference: This is where the Kβ of one element overlaps the Kα of another element. For example, the Kβ of chromium (Z = 24; E = 5.95 keV) overlaps the Kα of manganese (Z = 25; E = 5.90 keV). (These energies are separated by 0.05 keV or 50 eV and a typical resolution, as mentioned above, is about 150 eV.)
- L-line/K-line Interference: This is where an L line of one element overlaps the K line of another. For example, the Lα of lead (E = 10.55 keV) coincides directly with the arsenic Kα (E = 10.54 keV). Another example is the Ba L lines (Lα at E = 4.45keV and Lβ1E = 4.83) and the Ti K lines (Kα E = 4.51keV and Kβ E = 4.93keV).
- M-line/K-line Interference: For example, the Pb Mα line at 2.34 keV sits directly on top of the S Kα at 2.31 keV.
For one element, the line overlap correction takes the form:
Corrected Intensity = Uncorrected Intensity – h × Concentration Interfering Element
where h is the correction factor. Note that a subtraction from the measured analyte intensity always is required in the case of a spectral line overlap because we are always measuring too much intensity.
This corrected intensity is then substituted into the basic calibration function of equation 1 so that we have:
Ci = A0 + A1 (Ii - hCj) [2]
where Ci is the concentration of element i, Ii is the intensity of element i, Cj is the concentration of the overlapping element j, and h is the correction factor.
When there is more than one element with spectral lines overlapping that of the analyte, this becomes
Ci = A0 + A1 (Ii - σhij Ci) j [3]
where the summation is over the j subscript of the interfering elements.
Matrix Effect Correction
We define "matrix" as any element in the sample other than the single analyte element under consideration at that particular time (3).
The matrix effect results in a change in the slope of the calibration curve as shown in Figure 2. Let "A" be the calibration curve with zero interfering element, then "B" will be the calibration curve for samples containing, for example, 2% of the interfering element, and "C" for samples containing 4% of this interfering element. However, in the case of the matrix effect, the correction can be either positive or negative. Therefore, "D" represents another possible change in slope.
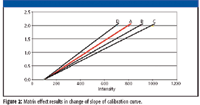
Figure 2: Matrix effect results in change of slope of calibration curve.
Examples from OES
Matrix effects in optical emission spectrochemical analysis are caused by "An enhancement or suppression of the analytical line by some physical interaction in the analytical gap between the interfering element and the element being analyzed" (4). Although this is a specific reference to arc/spark OES, only slight editing would be required for this statement to apply to ICP-OES and atomic absorption spectrometry (AAS) as well. The physical (or chemical) effects can occur not only in the plasma or flame, but also in the sample introduction system.
- Chromium in steel can produce a change in the slope of the calibration curve for the element carbon. This has been attributed to the formation of chromium carbides in the alloy (5).
- The addition of zinc to copper–nickel alloys (producing the so-called nickel silvers) can result in a change in slope of the nickel calibration curve (5).
Examples from XRF
Matrix effects in X-ray fluorescence spectrometry are due to the phenomena of absorption and enhancement.
- Absorption: The matrix can absorb incoming X-rays on their way to the element we wish to measure. In addition, the matrix can absorb analyte characteristic X-rays on their way to the detector.
- Enhancement: The elements that comprise the matrix will emit their own characteristic X-rays. If these are on the higher energy side of the analyte, they can enhance the measured count rate of the analyte.
Consider a soil containing iron (a common constituent) and contaminated with copper and chromium. The iron tends to absorb the copper X-rays, reducing the intensity of the copper measured by the detector. The chromium, on the other hand, will be enhanced by the iron, because the iron X-rays will in turn excite chromium atoms.
For one element the correction for matrix effects takes the following form:
Corrected Intensity = Uncorrected Intensity (1 ± k × Concentration Interfering Element)
where k is the correction factor. Again we note that the correction can be either positive or negative.
This corrected intensity is then substituted into the basic calibration function of equation 1 so that we have:
Ci = A0 + A1Ii (1 ± kCj) [4]
where Ci is the concentration of element i, Ii is the intensity of element i, Cj is the concentration of the interfering element j, and k is the correction factor.
When there is more than one element with spectral lines overlapping that of the analyte, this becomes
Ci = A0 + A1Ii (1 ± Σ kijCj) j [5]
where the summation is over the j subscript (of the interfering elements).
The form of this equation is that of the so-called Influence-Coefficient Methods of X-ray fluorescence spectrometry (6). Many researchers have published variations on this theme including Beattie and Brissey, Claisse and Quintin, de Jongh, Lachance and Traill, Rasberry and Heinrich, and Rousseau (7,8).
Intensity-Based Versus Concentration-Based Corrections
It should be noted that the forms of the correction equations noted earlier are based upon the concentrations of the interfering elements in certified reference materials used during the calibration process. It requires the availability of many high-quality standards. This is the only form used in OE and is also most common in XRF.
It should be noted, however, that equations 3 and 5 can be recast in terms of the measured intensity of the spectral line of the interfering element(s):
Line overlap: Ci = A0 + A1 (Ii - Σ hijIj) [6]
Matrix effect: Ci = A0 + A1Ii (1 ± Σ kijIj) [7]
where Ij is the measured intensity of the interfering element j. Equation 6, for example, is of the form discussed in a paper on X-ray fluorescence (9). The Lucas–Tooth and Price matrix correction algorithm in XRF (7) is of the form of equation 7.
These intensity-based forms of the correction equations are convenient when no or few standards for calibration are available. For example, the X-ray spectrum might indicate the presence of an element in some samples that is resisting proper calibration. The concentration of this element might not be known. In this case, the interelement effect correction in the form of equations 6 and 7 can be used. This provides significant flexibility for the analyst to identify and correct an interference without the need to resort to additional standards or outside laboratory analysis.
Interference Type and Element
We call the calibration curve produced with standards not containing the interfering element or elements the "base curve" and provide the following tips.
Determining the Interference Type
If possible, examine the spectra for obvious line overlaps.
- Line overlap will always lie to right of base curve, where the intensity is plotted along the x-axis, that is, there will always be too much signal.
- Matrix effect can be on either side of base curve. In XRF, left = absorption and right = enhancement.
- Given the statements #2 and #3, it is not always clear with which type of interference we are dealing. Therefore, the "trial and error" approach might be required.
- The more data, the better. Making a correction based upon only one data point is certainly inadvisable.
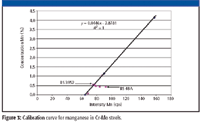
Figure 3: Calibration curve for manganese in Cr-Mo steels.
Determining the Interfering Element
- What do "interfered" samples contain that is not in those of the "base" curve (4,5)?
- Check spectral line tables for potential overlaps (4,5).
- Generally, the interfering element will be at a significantly higher concentration than the analyte. It is normally not advisable to correct on a trace element.
Worked Example 1
Table I shows XRF measurement data for the calibration of Cr-Mo steels. The first column gives the measured intensity for the element (counts per second) followed by the weight percent concentration for that element. The calibrations for molybdenum and chromium are straightforward. The calibration of manganese, on the other hand, requires an interelement effect correction, as can be seen from the plot in Figure 3.

Table I: XRF data for Cr-Mo steels
What is causing the interference and what is the nature of the interelement effect? Let's begin by identifying the sample farthest from the "curve." This is standard BS 48A. Now identify the sample farthest to the left and more or less parallel to this standard. That would be BS 3952. Now we ask the question, "What does standard BS 48A contain that BS 3952 does not?" Examining Table I provides the answer: BS 48A has almost 9% Cr, whereas BS 3952 has practically none. Reference to a table of X-ray lines shows that the Cr Kβ (E = 5.95 keV) sits directly on top of the Mn Kα (E = 5.90 keV).
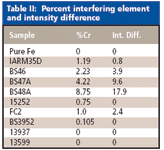
Table II: Percent interfering element and intensity difference
The samples identified as "Fe" and the two Fe-Mn binaries, 13599 and 13937, provide a "base curve," as shown in Figure 1. To compute the correction coefficient, we make a table of weight percent chromium versus the intensity difference to the base curve. Think of it as the "distance from the base curve." This distance from the base curve can be determined graphically or algebraically by using the equation of the base curve to calculate the "expected" Mn intensity if there were no Cr. For example, for standard BS 48A, we can see from Figure 3 that this intensity difference is about 18 cps. This intensity difference is shown for all standards in Table I and is plotted in Figure 4.
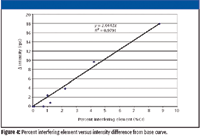
Figure 4: Percent interfering element versus intensity difference from base curve.
The correction coefficient is the slope of the line in Figure 4. That is, h = 2.0442 cps per %Cr. This coefficient actually makes more sense when the units are converted through the calibration curve: 2.0442 cps translates to 0.091% Mn. Therefore, we can write h = 910 ppm Mn/% Cr. Corrected manganese intensities are now computed as follows:
Corr Int Mn = Int Mn - 2.0442 (%Cr)
Plotting these corrected intensities against the manganese concentration gives the final calibration curve of Figure 5.
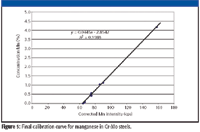
Figure 5: Final calibration curve for manganese in Cr-Mo steels.
The final calibration function for manganese in Cr-Mo steels is
CMn = -2.8542 + 0.0445 (IMn -2.0442CCr )
Worked Example 2
Table III shows measured Zn and Pb intensities versus concentration for a series of brass standards. This data is plotted for Zn in Figure 6. We see that the standards shown as purple squares plot to the left of the "base curve" shown. These samples all contain lead, suggesting this is our interfering element. Furthermore, because the samples plot to the left of the base curve, we suspect a matrix effect.

Table III: XRF data for brasses
As in example 1 we make a table of the intensity difference to the base curve and the percent of the interfering element, lead. In this case, however, we also tabulate the ratio ΔI/I0 where I0 is the base curve intensity (Table IV). This is necessary because the matrix effect is multiplicative; that is, we will be multiplying the correction coefficient by the percent of the interfering element.
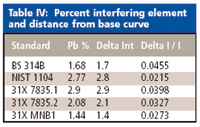
Table IV: Percent interfering element and distance from base curve
The correction coefficient is the slope of the line in Figure 7. That is, k = 0.0142 /%Pb (units are 1/% interfering element). Although there appears to be considerable scatter evident in this plot, note that the numbers of the I/I0 axis are very small. Do not be overly concerned until the final corrected calibration curve has been computed. Corrected zinc intensities are now computed as follows:
Corr Int Zn = Int Zn(1 + 0.0142 × %Pb)
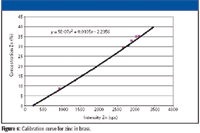
Figure 6: Calibration curve for zinc in brass.
Plotting these corrected intensities against the zinc concentration gives the final calibration curve of Figure 8.
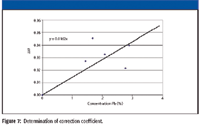
Figure 7: Determination of correction coefficient.
The final calibration function for zinc in brass is
CZn = -2.20 + 0.0106 (IZn [1 + 0.0142CPb]) + 0.00000047 (IZn [1 + 0.0142CPb])2
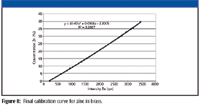
Figure 8: Final calibration curve for zinc in brass.
The calibration curve for zinc is a quadratic (due to the phenomenon of self-absorption), not uncommon for covering such a large concentration range. For lower concentration ranges, the calibration generally will be linear.
Discussion
Even without access to sophisticated regression software, interelement effect problems can be solved using a spreadsheet like MS Excel (Microsoft, Redmond, Washington). In fact, one should be wary of calibration software until it has proven itself. Always check solutions by recourse to standards not in the original calibration set.
It is not always possible to correct for interelement effects. Sometimes we must seek an alternate spectral line. Or we must shrink the scope of our calibration. For example, in arc/spark OES using a unidirectional, medium-voltage discharge at several hundred Hertz repetition rate in an argon atmosphere, it has not been possible to calibrate all alloys of zinc in one analytical program or method. This is due to the severely nonlinear matrix effect of aluminum on the various analytes (5). Therefore, we must calibrate separate methods for the pure zincs, for the galvanizing material, and for the various Zamak grades (alloys of zinc containing 4–30% Al).
Finally, in XRF, there is another model for the correction of matrix effects, the so-called fundamental parameters (FP) method, based upon X-ray physics. This method considers the interaction of the exciting X-ray beam with the atoms of the sample and then the interaction of the fluorescence radiation produced with the sample atoms as it exits the sample to the detector.
Conclusions
The mathematical models for dealing with interelement effects in optical emission and X-ray fluorescence spectrochemical analysis are well established and straightforward. Line overlap corrections involve a subtraction from the measured analyte intensities. Matrix effect corrections require a multiplicative term, positive or negative, to account for the change in slope of the calibration curve.
Acknowledgments
The authors gratefully acknowledge the review and helpful comments by Robert Schleicher, Stephen Shefsky, and Laura Stupi.
Volker Thomsen, formerly of Thermo Electron Corp. NITON Analyzers, is now a consultant living in Atibaia, São Paulo, Brazil. Debbie Schatzlein and David Mercuro are both with Thermo Electron Corp. NITON Analyzers, Billerica, MA.
References
(1) V. Thomsen and D. Schatzlein, Spectroscopy 17(7), 14–21 (2002).
(2) EPA Method 6010B under Statement of Work (SW) 846. Available online at: www.epa.gov/epaoswer/hazwaste/test/pdfs/6010b.pdf.
(3) V. Thomsen and D. Schatzlein, Spectroscopy 21(5), 44–48 (2006).
(4) ASTM E158-86, Standard Practice for Fundamental Calculations to Convert Intensities into Concentrations in Optical Emission Spectrochemical Analysis (American Society for Testing and Materials, West Conshohocken, Pennsylvania).
(5) V. Thomsen, Modern Spectrochemical Analysis of Metals: An Introduction for Users of Arc/Spark Instrumentation (ASM International, Materials Park, Ohio, 1996).
(6) E. P. Bertin, Introduction to X-Ray Spectrometric Analysis (Plenum Press, New York, 1978), pp. 369, 373.
(7) R. Tertian, R. and F. Claisse, Principles of Quantitative X-Ray Fluorescence Analysis (Heyden, London, UK, 1982), pp. 151–171.
(8) ASTM E1361-90, Standard Guide for Correction of Interelement Effects in X-Ray Spectrometric Analysis (American Society for Testing and Materials, West Conshohocken, Pennsylvania).
(9) J.V. Gilfrich, L.S. Birks, and J.W. Criss, "Correction for Line Interferences in Wavelength-Dispersive X-Ray Analysis" in X-ray Fluorescence Analysis of Environmental Samples, T.G. Dzubay, Ed. (Ann Arbor Science, Ann Arbor, Michigan, 1977).

LIBS Illuminates the Hidden Health Risks of Indoor Welding and Soldering
April 23rd 2025A new dual-spectroscopy approach reveals real-time pollution threats in indoor workspaces. Chinese researchers have pioneered the use of laser-induced breakdown spectroscopy (LIBS) and aerosol mass spectrometry to uncover and monitor harmful heavy metal and dust emissions from soldering and welding in real-time. These complementary tools offer a fast, accurate means to evaluate air quality threats in industrial and indoor environments—where people spend most of their time.
Smarter Sensors, Cleaner Earth Using AI and IoT for Pollution Monitoring
April 22nd 2025A global research team has detailed how smart sensors, artificial intelligence (AI), machine learning, and Internet of Things (IoT) technologies are transforming the detection and management of environmental pollutants. Their comprehensive review highlights how spectroscopy and sensor networks are now key tools in real-time pollution tracking.
New AI Strategy for Mycotoxin Detection in Cereal Grains
April 21st 2025Researchers from Jiangsu University and Zhejiang University of Water Resources and Electric Power have developed a transfer learning approach that significantly enhances the accuracy and adaptability of NIR spectroscopy models for detecting mycotoxins in cereals.
AI Shakes Up Spectroscopy as New Tools Reveal the Secret Life of Molecules
April 14th 2025A leading-edge review led by researchers at Oak Ridge National Laboratory and MIT explores how artificial intelligence is revolutionizing the study of molecular vibrations and phonon dynamics. From infrared and Raman spectroscopy to neutron and X-ray scattering, AI is transforming how scientists interpret vibrational spectra and predict material behaviors.