Introduction to Interpretation of Raman Spectra Using Database Searching and Functional Group Detection and Identification
In the “Molecular Spectroscopy Workshop” column, we have been trying to provide hands-on advice and easy-to-implement tips to start using spectroscopic tools for the analyst who has the responsibility to derive answers to questions as quickly as possible. Very often the identity of an unknown is of ultimate importance, and very few analytical chemists coming out of graduate programs have been taught to systematically analyze spectra to infer identity of the source. In addition, it is rare that an industrial environment will provide resources for the analyst to be educated in this field. Thus, the availability of any means to provide spectral identification will make the difference between success and failure; that is, acquiring a spectrum is useless if one cannot identify it. In this column, I discuss some of the fundamentals of spectral interpretation, illustrate the use of searching software, including mixture analysis, and show how sometimes the software can provide spectral interpretation.
In the “Molecular Spectroscopy Workshop” column, we have been trying to provide hands-on advice and easy-to-implement tips for analysts who have the responsibility to use spectra to derive answers to questions as quickly as possible. Very often the identity of an unknown is of ultimate importance, and very few analytical chemists coming out of graduate programs have been taught to systematically analyze spectra in order to infer the identity of the source. In addition, it is rare that an industrial environment will provide resources for analysts to be educated in this field. Thus, the availability of any means to provide spectral identification will make the difference between success and failure-acquiring a spectrum is useless if one cannot identify it. In this column, I discuss some of the fundamentals of spectral interpretation, illustrate the use of searching software, including mixture analysis, and show how sometimes the software can provide spectral interpretation.
Why might you be interested in database searching? So, you are an analyst working for an organization that has recently acquired a fantastic new Raman instrument. But you learned very little about Raman spectroscopy in your university course on analytical techniques. Well, if you are lucky, you did do a few measurements on a “modern” instrument. Otherwise you learned about all of the problems and difficulties of Raman spectroscopy. But part of your responsibility is now to use this instrument to obtain answers to urgent questions in your environment. There are actually two parts to carry out this responsibility. The first is to be able to obtain spectra, and the second is to understand what these spectra mean. To acquire spectra, you will need a minimum understanding of how your instrument works, but this is outside the domain of this column, although I have addressed this in a recent webinar that you can watch (1).
With all of your responsibilities and constraints on your time, how are you going to use the spectrum to produce the required information? Suppose you are looking at a contaminant. The presence of this contaminant is mucking up a manufacturing process. Since you are not a trained spectroscopist (and few of us are, including myself, which I will get to in a while) you will need to rely on spectral databases and searching algorithms. There are currently several products in the marketplace that can provide these capabilities, and they can be found with a simple internet search on Raman databases. You should be aware that the characteristics of Raman spectra of organic and inorganic materials are quite different, and sometimes a database will emphasize one over the other.
A Very Succinct Introduction to Vibrational Spectroscopy
The vibrational spectra of organic materials are determined by the interatomic bonds. Following the work of Coblentz at the beginning of the 20th century, vibrational functional groups that exhibited characteristic energies were identified (2). Examples of easily identified functional groups are listed in Table I. However, because the bonds such as C-C, C-O, and C-N are geometrically close in a given complex molecule, and have similar energies, interactions between them are great and much of the spectrum of an organic material in the range below 1500 cm-1 cannot be easily described by isolated functional groups. This part of the spectrum is called the fingerprint because it reflects in a detailed manner the structure of the compound being examined. The spectrum of vibrational frequencies can be predicted using G matrix methods developed by E.B. Wilson (3), in which a matrix of equations describing the displacement coordinates for all the atoms in a molecule is constructed and then diagonalized. Clearly, a presentation of these methods is beyond the scope of this column, but commercialized software is available that performs these calculations (4). For a thorough exposition of spectral interpretations, several good textbooks on this topic are available (5–7).
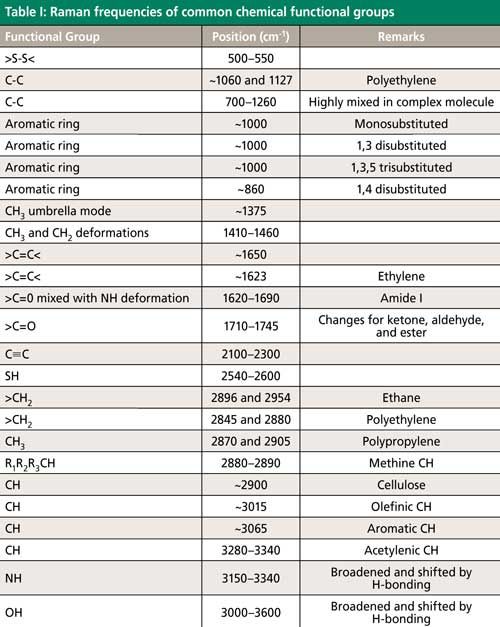
So with the limitations that we all have on our time and resources, how can we reasonably expect to use Raman spectroscopy effectively? You may be surprised to know that I am not a trained chemist, and I have struggled with the spectroscopy of chemicals for the simple reason that one needs to be able to speak the language; that is, you have to remember what name goes with what structure to understand what you are looking at and I am not good at memorization. (My formal training was in physics, because I understood that in that field, things were sorted out from first principles.) But slowly, over the years, I have learned to associate certain spectral features with simple functional groups. Table I summarizes some of what I have learned. But nowadays there are ways to get a handle on this using commercialized searching software and Raman databases. The examples that I present here use the KnowItAll software (Bio-Rad Laboratories) and their associated databases (8).
Using Available Databases and Searching Software to Get Answers Rapidly
Figure 1 shows the spectrum of an unknown; the spectrum is shown as it has been stored on my computer. You can see that there is a significant background in this spectrum. Such backgrounds, which have no Raman information, significantly degrade spectral searching results. This is easily understood when you understand the algorithm for searching. There is a large collection of spectra of known materials against which the unknown is searched. The search is done by treating the spectra as vectors and performing the dot product between each spectrum in the database and the unknown. For those of you who do not remember what a dot product is, I can explain. The intensity at each data point of the unknown is multiplied by the intensity at the equivalent data point in the spectrum from the database. The more similar the two spectra are, the higher the value of the dot product, which is known as the score or the hit quality index. This calculation method is known as the correlation algorithm. The software will calculate the dot product between the unknown and every entry in the database, and then report the first 50 hits, with the compounds listed in the order of decreasing value of the score. In the list of hits in Figure 2 (“best fits” to the unknown or query) the left column shows the score of the hit, then moving to the right one can see the molecular formula, and sometimes the structure. Note that when there is a background (even one that is not very large) its presence may contribute more to the dot product than the Raman bands. So, when the spectrum in Figure 1 was imported into KnowItAll, the software immediately recognized the poor baseline and determined that its presence would distort the results and the baseline was flattened before the search. Figure 1a shows the original spectrum in LabSpec (Horiba), and then after it was imported into KnowItAll and searched. Figure 1b then reproduces the message from KnowItAll, which describes how the query (unknown) file was treated. Note that KnowItAll allows this functionality, as well as many others, to be turned off or activated by the user. In this case, KnowItAll recognized this spectrum as that of poly (vinyl chloride-co-vinyl acetate) with a score of 98.28.
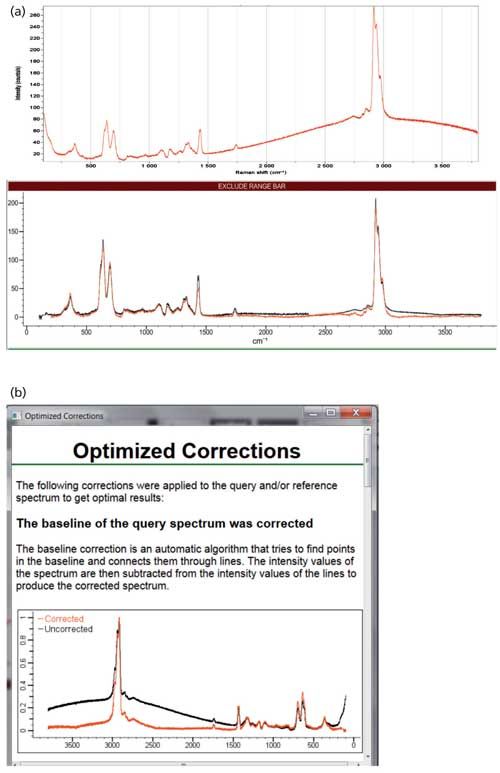
Figure 1: (a) Spectrum of unknown, as recorded in LabSpec (top) and then imported into KnowItAll, and baseline-corrected (bottom). (b) Message in KnowItAll, informing the user of the baseline correction that was done in the background.
The second hit in the database is for pure polyvinyl chloride (PVC), with a hit quality index of 97.97, not much different from the first with a score of 98.28. The scores are negligibly different, but inspection of the spectra at the top of Figure 2 indicates the absence of a small carbonyl band near 1737 cm-1 in the database spectrum of the second hit. That means that the KnowItAll software and database was sensitive enough to find the copolymer with the acetate carbonyl even though the difference in the scores for the copolymer and polymer was quite small. What KnowItAll does not tell us is the percent composition of the copolymer. To extract that information, the database would have to include multiple samples of the copolymer, made with different compositions, on which the unknown could be searched.
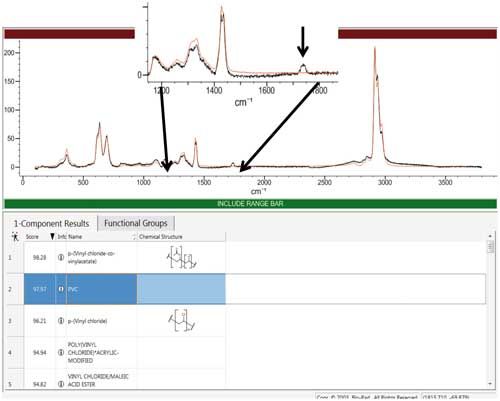
Figure 2: Spectrum of an unknown, acquired in LabSpec and transferred to KnowItAll (black) overlaid with the second hit in the KnowItAll database, indicating identification with polyvinyl chloride (PVC). Note that the first hit, poly (vinyl chloride-co-vinyl acetate), has an almost identical spectrum, but includes the band near 1750 cm-1 that is absent in the second hit.
To illustrate the power of KnowItAll with some new capabilities that were introduced within the last year, I pulled up a spectrum of polysulfone and artificially shifted the x-axis by 5 cm-1 units. The software now has a capability to dither the Raman shift while doing the search so that ultimately a good match can be found, but I turned that capability off. The first search was without a baseline correction, and you can see in Figure 3 that the results are useless. If we respond to the red warning dot in the query status on the left side of the KnowItAll screen, the baseline is taken and the search is redone, as shown in Figure 4. Interestingly, the first hit is polysulfone, but the hit index is only 69.57. Visually the match does not appear that bad, but if one expands a region with sharp bands, you can see the problem. So the next thing I did was to turn the x-axis shift back on and repeat the search. The top hit in the query list is still polysulfone, but now the hit quality index is 96.7.
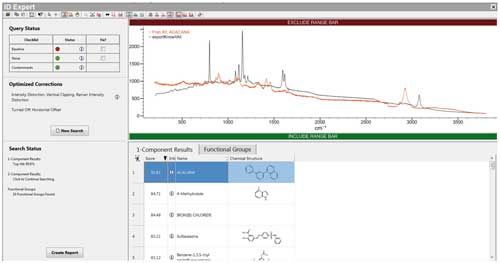
Figure 3: Result on a search of a spectrum of polysulfone that was artificially “decalibrated” by shifting 5 cm-1 before transferring to KnowItAll.
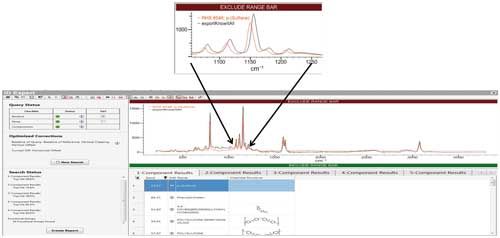
Figure 4: Result of spectral search on polysulfone spectrum after allowing for baseline correction.
Why did I go to the trouble of what appears to be an exercise designed to degrade Raman data? The wavenumber shift calibration of Raman instruments is often an issue. Note that 1 cm-1 at 800 nm in a spectrum excited with a 785-nm laser is equivalent to about 0.7 Å (0.07 nm). That means that if the spectrograph x-axis calibration has even a 0.1-nm error, the Raman band frequencies will exhibit a significant error. And these errors get worse at shorter excitation wavelengths. In the middle of the fingerprint region of a spectrum excited at 532 nm, a 1 cm-1 error will correspond to 0.03 nm. If the x-axis accuracy of the spectrograph on which a Raman spectrum is measured is not in the range of 0.01 nm, there will be significant errors in the reported peak frequencies in the Raman spectrum. But this example shows that the “pattern” of the spectrum is recognizable even if frequencies are off. The ability to dither the spectrum enables high quality results in the search.
What would happen if the spectrum has been recorded from an unknown that is actually a mixture of more than one compound? I artificially added together the spectra of two similar polymers and did a search to see what KnowItAll would tell me. The top hit on the first search performed was polyethylene terephthalate (PET), with a hit quality index of 99.58. Because I am all-knowing and know that this spectrum does not represent 100% PET, the result of the search shown in Figure 5 has been expanded vertically to indicate the differences between the query spectrum and the PET database spectrum. Subsequently, I did a two-component search, which is shown in Figure 6. KnowItAll reported that the spectrum is mostly polyethylene terephthalate, but with an 18% contribution from polybutylene terephthalate. Note that the difference between these two polymers is simply an extra methylene group between the carboxylates. The final score for this mixture spectrum is 99.95. What is nice about the multicomponent search is that KnowItAll provides spectra of the individual components for examination.
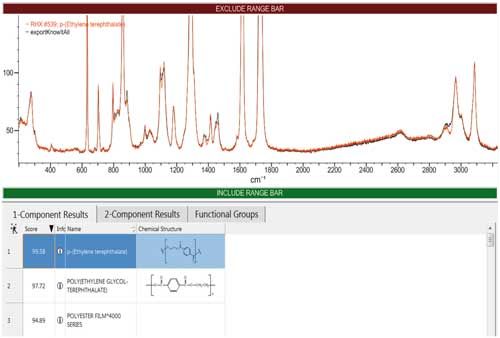
Figure 5: Result of a one-component search of a spectrum that was known to represent a mixture. Even though the score was 99.58, inspection of the spectra indicate places where there are deviations.
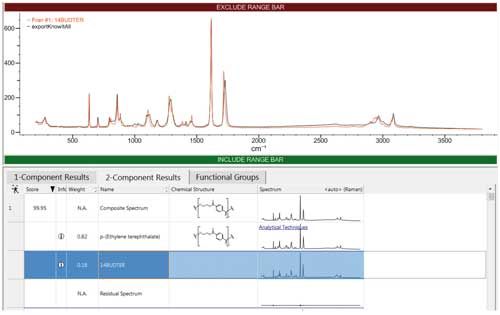
Figure 6: Top result of a two-component search identifying the presence of polyethylene terephthalate and polybutylene terephthalate with contributions to the spectrum of 0.82 and 0.18.
This example is perhaps a bit challenging. The chemical and spectral differences are quite small. I knew that they were there because I put them there by artificially adding two spectra together before doing the search. But I did not do anything special after importing into KnowItAll; spectra were in the database that enabled me to get a “correct” match in less than 1 s. Finally, whether this will be useful for your examples, will depend on how much you know about your sample so that you can decide if the information provided makes sense.
Suppose you really need to extract some information on chemical functionality. KnowItAll actually provides some capability to get you started. Figure 7 demonstrates that after a possible identification has been found, you can get some information as to the chemistry that would give rise to the found spectrum. The spectrum is shown twice in the figure so that one can see the correspondence between the functional groups and the spectral bands. What I found curious is that the NH band (near 3300 cm-1) is not identified in KnowItAll, at least for the polyamide polymer. Occasionally, it does identify an NH stretch, but for other functionalities, and at 3400 cm-1, much higher than what is seen here. Clearly, this capability will not take the place of an experienced spectroscopist (very few of whom still exist), but can get you started.
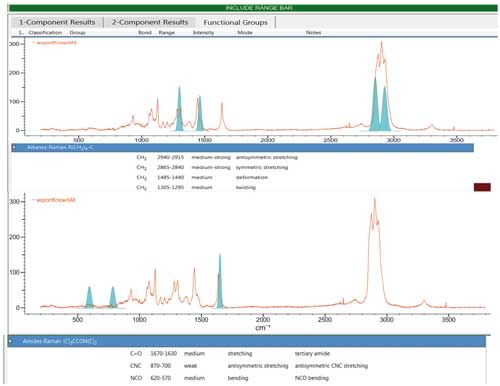
Figure 7: Assistance with functional group band assignment provided after a search identified a polyamide (nylon 6) as the identity of the unknown. The software provides identification of the origin of some of the peaks.
Summary
This column has been an attempt to enable a novice spectroscopist to gather the necessary resources to take advantage of the wealth of information embedded in Raman spectra. In combination with easy-to-use instrumentation, spectroscopic databases and searching software can provide information without an enormous hassle.
References
- W.W. Coblentz, Investigations of Infrared Spectra Parts I to V (Carnegie Institution, Publications #35, 65, and 97, 1905-1908. Republished by the Coblentz Society and the Perkin-Elmer Corp., Norwalk, Connecticut, 1962).
- E.B. Wilson Jr., J.C. Decius, and P.C. Cross, Molecular Vibrations, The Theory of Infrared and Raman Vibrational Spectra (McGraw-Hill, New York, New York, 1955).
- G. Socrates, Infrared and Raman Characteristic Group Frequencies, Tables and Charts 3rd Edition (John Wiley and Sons, Chichester, UK, 2001).
- D.W. Mayo, F.A. Miller, and R.W. Hannah, Course Notes on the Interpretation of Infrared and Raman Spectra (Wiley-Interscience, Hoboken, New Jersey, 2004).
- P. Larkin, Infrared and Raman Spectroscopy, Principles and Spectral Interpretation (Elsevier, Amsterdam, The Netherlands, 2011).
- Bio-Rad Laboratories, Philadelphia, Pennsylvania.

Fran Adar is the Principal Raman Applications Scientist for Horiba Scientific in Edison, New Jersey. Direct correspondence to: SpectroscopyEdit@UBM.com
A Proposal for the Origin of the Near-Ubiquitous Fluorescence in Raman Spectra
February 14th 2025In this column, I describe what I believe may be the origin of this fluorescence emission and support my conjecture with some measurements of polycyclic aromatic hydrocarbons (PAHs). Understanding the origin of these interfering backgrounds may enable you to design experiments with less interference, avoid the laser illuminations that make things worse, or both.
Raman Microscopy for Characterizing Defects in SiC
January 2nd 2025Because there is a different Raman signature for each of the polymorphs as well as the contaminants, Raman microscopy is an ideal tool for analyzing the structure of these materials as well as identifying possible contaminants that would also interfere with performance.