Metabolite Profiling Applications in Early Drug Discovery
Special Issues
Metabolite profiling in drug discovery can contribute significantly at the lead optimization stage in two main application areas. The first is the identification of major metabolites, which provides medicinal chemists with information on the metabolic "soft spots." These soft spots are locations on the molecule particularly susceptible to metabolic modification, which can contribute to high pharmacokinetic clearance. This information then can be used to optimize the structure of a lead compound or chemical series to slow the rate of metabolism and therefore reduce hepatic clearance. This improves the absorption, distribution, metabolism, and excretion (ADME) properties of the compound, such as bioavailability, exposure (as measured by area under the curve), and half-life. Through iterative optimization of the structure and timely generation of metabolism data following each structural modification, pharmacokinetic properties can be improved while maintaining activity against the therapeutic target.
The second application area where metabolite profiling can be very useful in early discovery is the identification of reactive metabolites. These have been associated with idiosyncratic liver toxicity and are considered a major liability in a drug candidate (1,2). Compounds are routinely screened for the formation of reactive metabolites using in vitro microsomal incubations in the presence of trapping reagents such as glutathione, followed by liquid chromatography (LC)–mass spectrometry (MS)-MS analysis.
The use of a single LC–MS-MS platform capable of performing both types of metabolite profiling studies described here is ideal. Easy-to-perform, high-throughput analysis coupled with fast data processing and simplified reporting are key features of a platform designed to fit within the overall drug discovery process.
Results and Discussion
Soft Spot Analysis: The Obstacles
Soft spot analysis and metabolism data-driven lead optimization are gaining wider acceptance. Some of the concerns often raised about employing this approach are the ability to produce the data in a timely manner so as to keep pace with the discovery process, the in vitro–in vivo correlation of metabolism data, and the ability to obtain enough specific structural data to truly focus on the metabolic soft spot and be able to block or slow down the metabolism of that site without affecting the activity of the compound against the therapeutic target.
Soft Spot Analysis: The Solutions
In light of this, it is clear that the LC–MS-MS platform required for successful implementation of this application area must incorporate the hardware capabilities and the software workflows to meet the analytical needs required to effectively address the concerns described.
Throughput and Speed
To produce timely results, throughput and speed must be considered. For high-speed analysis, the LC–MS-MS system must be compatible with fast chromatography. In the past, metabolite profiling by LC–MS-MS has been performed using traditional chromatography on long columns at low flow rates with run times of 30–60 min per injection. This is simply not practical for routine soft-spot analysis. Fast scanning is required to be able to perform real-time information dependent acquisition (IDA) and generate enough data points across a narrow chromatographic peak. For example, a nontargeted full scan driven IDA experiment can be performed with a cycle time of 1.5 s on a QTRAP 5500 LC–MS-MS system (Applied Biosystems/MDS Analytical Technologies, Foster City, California). Neutral loss and precursor ion scans can be performed at a rate of 2000 Da/s, and linear ion trap enhanced product ion (EPI) scans can be performed at 20,000 Da/s.
In addition, the system's Turbo V Source and Curtain Gas interface allow the system to handle mobile phase flow rates of 1–2 mL/min without splitting in electrospray ionization (ESI) mode. The scanning speed and the front end together meet the requirements of fast chromatography: high flow rates and narrow peaks.
Addressing the Data Analysis Bottleneck
Speed does not automatically translate to throughput unless bottlenecks are optimized throughout the workflow. One of the most common bottlenecks is data processing and report generation. LightSight software (Applied Biosystems/MDS Analytical Technologies), which works in conjunction with the QTRAP 5500 system (Applied Biosystems/MDS Analytical Technologies), provides data analysis and report generation (Figure 1).
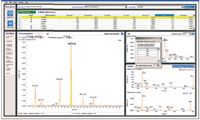
Figure 1: Integrated data processing environment in the LightSight software displays essential information.
It incorporates data-processing features such as sample-to-control comparison, automatic correlation of MS-MS and survey scan data (both spectral and chromatographic), customizable built-in comprehensive tables of known biotransformations, and the ability to define custom biotransformations. It also includes features such as intuitive data processing parameters, automatic report generation, comparison of metabolite MS-MS spectra with that of the parent, and the capability to export MS-MS spectra to ACD/Labs software (Advanced Chemistry Development, Toronto, Canada) for further structure elucidation. It also performs automatic method building of QTRAP system metabolite identification methods using a wizard-driven interface (Figure 2).
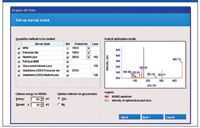
Figure 2: LightSight software Automated QTRAP system method building wizard.
The Relevance of Sensitivity
One of the major concerns with in vitro studies is the correlation to in vivo models and ensuring that in vitro results are predictive. Although a comprehensive treatment of this subject is beyond the scope of this article, one of the most common issues is the use of high substrate concentrations for in vitro studies that are not physiologically relevant in vivo. Even a cursory survey of the scientific literature will show that most in vitro metabolism studies traditionally are done at substrate concentrations of 10 μM and sometimes as high as 50 μM. This is significantly higher than normally would be encountered in vivo at therapeutically relevant concentrations. This is done to compensate for the poor sensitivity of the MS instruments that have traditionally been used for metabolism studies. At such high substrate concentrations, the metabolic profile and predicted clearance can be quite different from what would be encountered at physiologically relevant concentrations of the drug candidate.
The linear ion trap of the QTRAP 5500 LC–MS-MS system is 10–100× more sensitive in obtaining full product ion spectra (EPI mode) than previous generation instruments. This high sensitivity allows a better match between the ability to detect a metabolite peak and the ability to obtain structural information in MS-MS mode. As a result, it is now feasible to perform in vitro metabolite profiling studies at 1–2 μM or lower. Figure 3 shows the detection of a low-level verapamil metabolite (di-demethylation) in a 1 μM in vitro incubation. This capability also opens the door to performing in vivo metabolite identification on samples obtained from standard rodent PK studies with typical IV doses in rats of 1–4 mg/kg, which has been demonstrated recently for both targeted (3,4) and nontargeted approaches (5,6).
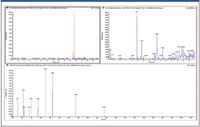
Figure 3: Low-level verapamil metabolite (di-demethylation) confirmed in a 1 μM in vitro incubation: (a) TIC showing major metabolite peaks, (b) XIC showing minor metabolite at 9.83 min, and (c) enhanced product ion spectrum of peak at 9.83 min.
Reactive Metabolite Screening Using GSH Trapping
When new compounds are screened for reactive metabolite formation, a comprehensive high-throughput detection method is required. The ideal characteristics of such a method are broad detection coverage, high throughput, high sensitivity (because reactive metabolite adducts are often present at low levels), generic methodology that does not require prior knowledge of the compound's fragmentation and metabolic pathways, and the ability to detect and obtain MS-MS fragmentation data in the same injection.
In this experiment, diclofenac was incubated at 10 μM in human liver microsomes for 30 min in the presence of GSH and NADPH as cofactors. After the reaction was quenched, the sample and corresponding control were dried down and reconstituted in 200 μL 5% acetonitrile.
The extracts were analyzed on the QTRAP 5500 LC–MS-MS system under fast chromatographic conditions using a 1.8 μm Agilent XDB-C18 column (50 mm × 2 mm) (Agilent Technologies, Santa Clara, California). The method consisted of a dual survey scan, positive neutral loss of 129 (NL 129) and negative precursor ion of 272 (PI 272) combined with four IDA-triggered EPI scans in positive ion mode. The survey scan speed was 2000 Da/s for each of the two quadrupole surveys and 20,000 Da/s for the EPI trap scans. The polarity switching time was 50 ms. The total cycle time was 2.1 s or less, depending upon the number of EPI scans triggered per cycle.
Broad Detection Coverage
The combination of neutral loss scan of 129 (NL 129) in positive ion mode and precursor ion of m/z 272 (PI 272) in negative ion mode provides the broadest coverage possible in a single injection for detecting GSH adducts. It also allows complimentary detection based upon a parent substrate product ion (produced through neutral loss of 129) and a GSH conjugate product ion (PI 272). Both detection approaches have been described previously and are well validated (7,8). The QTRAP 5500 LC–MS-MS system is the first instrument that allows both detection modes to be applied in a single injection workflow in combination with high-sensitivity MS-MS for structural confirmation. This is due to the triple-quadrupole scan speed (2000 Da/s), fast positive to negative polarity switching time (50 ms), and high linear ion trap sensitivity and speed.
High Throughput
As described earlier, achievement of high throughput requires that that MS detection be compatible with the flow rates and narrow peak widths associated with fast ultrahigh-pressure liquid chromatography (UHPLC). In this case, the fast polarity switching is a key requirement for successful implementation in addition to the fast scanning speed.
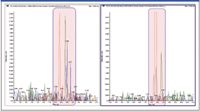
Figure 4: GSH adducts of diclofenac reactive metabolites detected using dual NL/PI survey scans and polarity switching with fast chromatography.
High Sensitivity
Four well-known, low-level GSH conjugates of diclofenac (8) were detected successfully and confirmed using this approach (Figure 4). Detection requires high sensitivity in the triple-quadrupole survey modes, and confirmation requires matching sensitivity in the EPI mode (Figure 5).
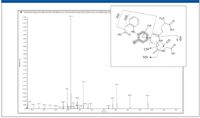
Figure 5: Enhanced product ion spectrum and fragment assignment of a GSH adduct. Data acquired using information-dependent acquisition.
Generic Methodology
One of the key advantages of the combined NL/PI methodology is that it does not require any prior knowledge of the fragmentation or metabolism of the substrate compound under investigation. Both survey scans rely on the structural features of the GSH moiety itself. Polarity switching also ensures broad coverage of different compound classes. Therefore, the same method can be used for fast screening of multiple compounds incubated at one or more time points. This is contrasted with targeted approaches such as mass defect filtering (MDF) (9), which typically require application of multiple filters in postprocessing of the full-scan accurate mass data. The mass defect filters applied must take into account the mass defect calculated from the elemental composition of the parent compound and adjustments based upon possible Phase I and Phase II metabolism.
Simultaneous Detection and Structural Characterization in the Same Injection
The combined PI/NL approach turns out to be very efficient in triggering product ion scans on the relevant peaks while significantly reducing the probability of triggering on irrelevant background masses or endogenous peaks in the incubated sample; and obtaining all the data in a single injection. It is noteworthy that no sample cleanup was performed prior to analysis (microsomal incubations were dried down and reconstituted as is).
This is again contrasted with the MDF post-processing approach, which requires identification of the peaks of interest from the full-scan accurate mass data, then scheduling a second injection to obtain the MS-MS product ion data on those peaks of interest. The single injection approach is clearly more suitable for high-throughput analysis, especially when combined with fast chromatography.
Conclusions
Hybrid triple quadrupole–linear ion trap LC–MS-MS offers significant advantages for metabolite profiling applications most common in early drug discovery. A single instrument platform can be used for both soft-spot analysis and reactive metabolite screening. Hardware features involving sensitivity and fast scanning, combined with software for automated method building and data processing, provide the key building blocks to meet the analytical requirements for high throughput, sensitivity, ease of use, and fast turnaround of results.
Hesham Ghobarah, Elliott Jones, and Mark Garner are with Applied Biosystems, part of Life Technologies, in Toronto, Ontario, Canada and Foster City, California.
References
(1) J.L. Walgren, M.D. Mitchell, and D.C. Thompson, Crit. Rev. Toxicol. 35, 325–361 (2005).
(2) J. Uetrecht, J. Ann. Rev. Pharmacol. Toxicol. 47, 513–539 (2007).
(3) T. Gamble, H.Y. Pang, S. Pan, Y. Yang, W. Cui, D.J. Turk, and H. Ghobarah, Proceedings of the 57th ASMS Conference on Mass Spectrometry, TP 581 (2009).
(4) S. Pan, H. Ghobarah, T. Gamble, H.Y. Pang, Y. Yang, J. Izhakova, and D.J. Turk, Proceedings of the 57th ASMS Conference on Mass Spectrometry, TP 567 (2009).
(5) J.D. Miller, J.A. Ferguson, and A. Dindyal-Popescu, "Novel Non-Targeted Screening Approaches for Drug Discovery on a Hybrid Linear Ion-Trap Mass Spectrometer," Applied Biosystems Technical Note (2009).
(6) A. Dindyal-Popescu, N. Zhu, T. O'She, and J.D. Miller, Proceedings of the 57th ASMS Conference on Mass Spectrometry, ThP 091 (2009).
(7) W.G. Chen, C. Zhang, M.J. Avery, and H.G. Fouda, in Biological Reactive Intermediates, Vol. VI, P.M. Dansette, R.S.M. Delaforge, G.G. Gibson, H. Greim, D.J. Jollow, T.J. Monks, and I.G. Sipes, Eds. (Kluwer Academic/Plenum Publishers, New York, 2001), pp. 521–524.
(8) B. Wen, L. Ma, S.D. Nelson, and M. Zhu, Anal. Chem. 80, 1788–1799 (2008).
(9) M. Zhu, L. Ma, H. Zhang, and W.G. Humphreys, Anal. Chem. 79, 8333–8341 (2007).

AI-Powered SERS Spectroscopy Breakthrough Boosts Safety of Medicinal Food Products
April 16th 2025A new deep learning-enhanced spectroscopic platform—SERSome—developed by researchers in China and Finland, identifies medicinal and edible homologs (MEHs) with 98% accuracy. This innovation could revolutionize safety and quality control in the growing MEH market.
New Raman Spectroscopy Method Enhances Real-Time Monitoring Across Fermentation Processes
April 15th 2025Researchers at Delft University of Technology have developed a novel method using single compound spectra to enhance the transferability and accuracy of Raman spectroscopy models for real-time fermentation monitoring.