Native Measurement of a Biotherapeutic without Interference from Excipients Using Microfluidic Modulation Spectroscopy
Special Issues
A new infrared spectroscopy technique, microfluidic modulation spectroscopy (MMS), delivers reproducible protein characterization over close to four orders of magnitude in protein concentration (from 0.1 to 200 mg/mL). This technique characterizes samples from the earliest stages of development through to manufacture.
A defining requirement in biopharmaceutical development, formulation, and manufacturing is to elucidate and maintain the structure of the drug entity. That work relies on relevant protein characterization, a task complicated by how samples evolve through the drug development lifecycle. The requirement to change techniques to cope with progressively more concentrated, and complex, multicomponent formulations is a major issue when it comes to comparing datasets and safeguarding structural parity. In this article, we discuss a new infrared spectroscopy technique, microfluidic modulation spectroscopy (MMS), that delivers reproducible protein characterization over close to four orders of magnitude in protein concentration, from 0.1 to 200 mg/mL. This technique can transition with the sample from the earliest stages of development through to manufacture, and present experimental data demonstrating the concentration-independent data that can be generated.
Elucidation of the structure-function relationships that define the clinical efficacy of therapeutic biologics such as monoclonal antibodies (mAbs) makes protein characterization critical to their development. Though the primary structure of proteins is relatively stable, higher order structure (HOS)-secondary, tertiary and quaternary-is labile, susceptible to change triggered by chemical or thermal stress. Therefore, delivery of a drug entity to the patient with its structure intact, unchanged by manufacture or storage, relies on detailed protein characterization across the biopharmaceutical lifecycle. This requirement creates the need for an analytical technique that can characterize structure reproducibly across a broad range of concentrations, and that remains viable and reliable in the presence of excipients and additives.
Secondary structure develops from interactions between hydrogen bond donor and acceptor residues associated with repeating units in the primary peptide chains of the protein, and is typically characterized by Fourier transform infrared (FT-IR) spectroscopy and far ultra-violet circular dichroism (far-UV CD). The most common element of secondary structure is the α-helix, but β-sheet structures are also relatively prevalent, particularly within mAbs, which is one of the most widely used classes of therapeutic proteins. β-sheet structures consist of β-strands and stretched sections of peptide chain, linked via hydrogen bonds (1).
With FT-IR, information relating to secondary structure is extracted from absorption spectra spanning the amide I band, resulting from the C=O stretch vibrations of peptide linkages along the protein backbone. These modes are highly sensitive to changes in secondary structure (2), with features of the amide I band correlated robustly with specific secondary structure elements; sensitivity to β-sheet structure is a particular benefit (3,4) of using the mid-IR. However, from a practical perspective, conventional FT-IR technology has some limitations, including the relatively high concentration required for measurement, optimally in the range of 10–150 mg/mL, which makes the technique less viable for the earlier stages of drug development, when sample concentration is typically low. In addition, FT-IR tends to exhibit background drift and poor repeatability, due to the complexities of water vapor subtraction and referencing.
The technique of circular dichroism (CD) characterizes samples on the basis of the differential absorption of left-handed and right-handed circularly polarized light that occurs when a molecule contains one or more chiral chromophores. Such chromophores include the peptide bonds associated with secondary structure, which give rise to a CD signal in the far-UV region (180–240 nm) that can be analyzed to determine the relative quantities of major secondary structural elements (5). Far-UV CD is well-suited to more dilute, simple solutions, operating at a relative low concentration of 0.2 mg/mL, for example, when using a cell of 1-mm pathlength. However, commercial products are typically formulated at higher concentrations, and the presence of chiral molecules in more complex formulations is also problematic. Typically, a dialysis procedure must be performed to remove excipients in the formulation buffer that interfere with CD signals. Phosphate buffered saline (PBS), a buffer used routinely in biological research, is well-characterized for far-UV CD analysis, and can be used to dilute formulation components that interfere with CD measurements (5).
Switching from far-UV CD to FT-IR as samples become more complex and concentrated, through formulation and into commercial manufacture, is one way to address the limitations of these techniques. However, this introduces the complicating factor of determining whether any conflicting observations are scientifically relevant, or simply an artifact of measurement or data analysis. An alternative strategy is to dilute samples to extend the application of far-UV CD. This is problematic from the perspective of data relevance, given that proteins are highly sensitive to their environment. The limitations of both of these strategies creates a need for innovative spectroscopy platforms for the direct measurement of native proteins.
An important step forward in this respect is the development of microfluidic modulation spectroscopy (MMS), a technique that harnesses the advantages of IR spectroscopy for robust measurement across a very wide dynamic range, with minimal interference from formulation excipients and additives (see Figure 1). In the MMS system, the sample solution and a matching reference stream are rapidly modulated (1–5 Hz) across the laser path to produce differential absorbance spectra via a process of continuous autoreferencing. The result is nearly drift-free scans background compensated to the buffer of interest, and of superior quality to those produced via conventional FT-IR. Concentration limitations are also directly addressed through the use of a tunable mid-IR quantum cascade laser that generates an optical beam around 100 times brighter than that used in a typical FT-IR. Run in continuous wave mode to generate a very accurate, low noise beam, this laser, in combination with a fully optimized optical configuration, delivers highly repeatable, high sensitivity measurement over a concentration range from 0.1–200 mg/mL. The laser also enables the use of simple detectors with no requirement for nitrogen cooling.
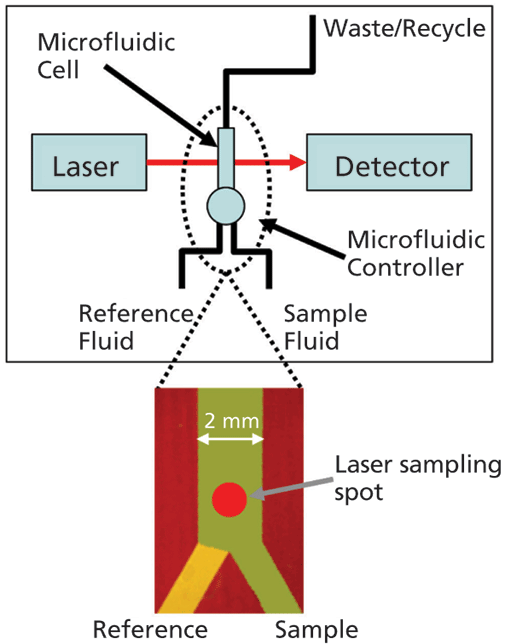
Figure 1: With MMS, rapid modulation with a matched reference stream produces highly sensitive differential IR scans, eliminating any potential interference from formulation excipients and additives; a tunable, cascade laser and optimized optical set-up enable measurement across a very wide concentration range.
MMS effectively shapes IR spectroscopy into an efficient tool for protein characterization from early drug development through to manufacture. The following experimental study of a mAb in clinical development demonstrates the capabilities of MMS for the measurement of protein samples in the presence of different buffers and across a very broad concentration range.
Experimental
Dilution series were prepared from a mAb stock sample of concentration of 157 mg/mL made up in a formulation buffer. A first dilution series was prepared by mixing volumes of the stock solution with the formulation buffer to create a samples series covering a concentration range from 1 to 80 mg/mL (specifically 1, 5, 10, 20, 40, and 80 mg/mL). A second dilution series was prepared in a strictly analogous way, and covering the same concentration range, by mixing samples of the stock solution with a PBS buffer at pH 7.4. In addition, a series of samples of formulation buffer diluted in PBS buffer were prepared as matching buffers for the PBS dilution series. In MMS measurements, the sample is modulated with a relevant buffer, so there is a need for a series of PBS diluted formulation buffer samples matched to the PBS dilution series samples.
All samples from both dilution series were analyzed by MMS (AQS3pro, RedShiftBio), generating differential absorbance spectra for each sample. All samples were tested at a modulation rate of 1 Hz. The instrument automatically determines the back pressure required for optimal fluid flow through the flow cell, to enhance data quality. For samples in the 1–40 mg/mL concentration range, the applied back-pressure was 5 psi and duplicate measurements were carried out for each sample. For the most concentrated 80 mg/mL samples, which were more viscous, higher back pressures were automatically determined (25 psi for the sample in the formulation buffer, and 10 psi for the sample in the PBS buffer). One measurement was carried out for both of these samples. The measurements made were subject to comprehensive data analysis using the instruments integral software package (AQS3delta, RedShiftBio).
Results and Discussion
Analyzing MMS Data
Analysis of the dataset for the first dilution series highlights key features of the data generated by MMS, and how it can be processed to reveal information about secondary structure, and to compare samples.
Figure 2a shows the differential absorbance spectra produced for the first dilution series; the replicate measurements indicate the high repeatability and accuracy. A plot of the maximum diffAU value as a function of concentration (see Figure 2b) shows excellent linearity with an R2 value of 0.9997, illustrating the potential of the technique for protein quantification. Samples of unknown concentration can be accurately quantified using this plot.
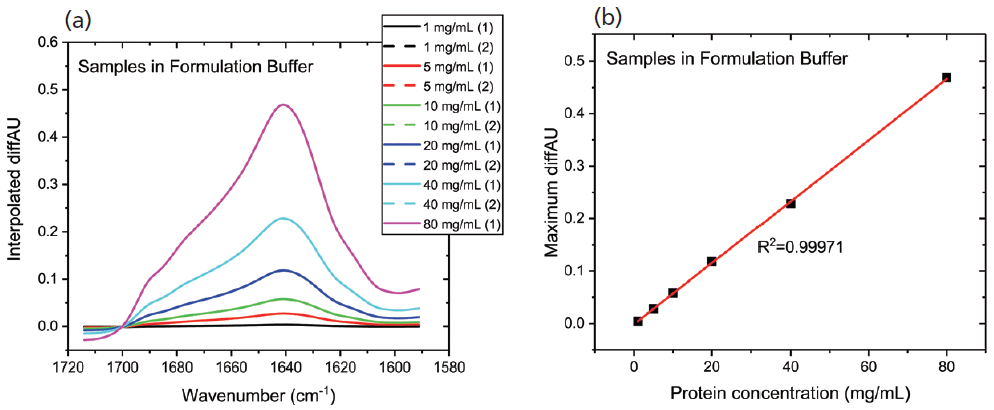
Figure 2: In MMS, continuous modulation between the sample and reference streams produces (a) differential absorbance spectra, shown here for a dilution series; and (b) the plot of maximum diffAU against protein concentration showing strict linearity, highlighting the potential of the technique for quantification.
With the buffer subtracted and concentration normalized, the absolute absorption spectra for each of the samples can be compared directly (see Figure 3). The high degree of overlap in these spectra indicate that the secondary structure of the protein is essentially unchanged by the dilution process across the full concentration range, which is not the case for all proteins.
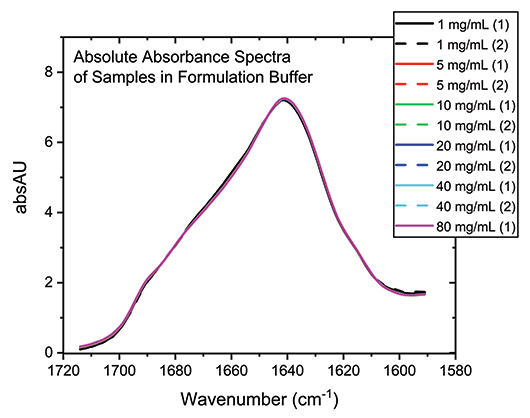
Figure 3: Buffer subtraction and concentration normalization produces absolute absorbance spectra for the mAb that can be used for detailed structural analysis.
One way to accentuate structural differences between samples is to generate second-derivative spectra from absolute absorbance spectra, as a function of wavenumber. This data processing step produces the traces shown in Figure 4, which provide further evidence of the close similarity of the samples, particularly those in the 5 to 80 mg/mL range.
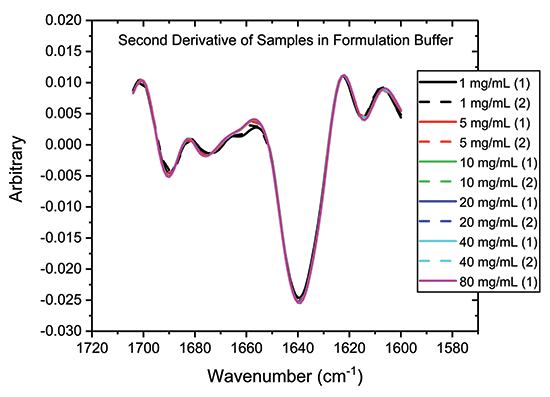
Figure 4: One way to highlight difference, or conversely confirming similarity, between samples is to analyze the second derivative plots, as shown.
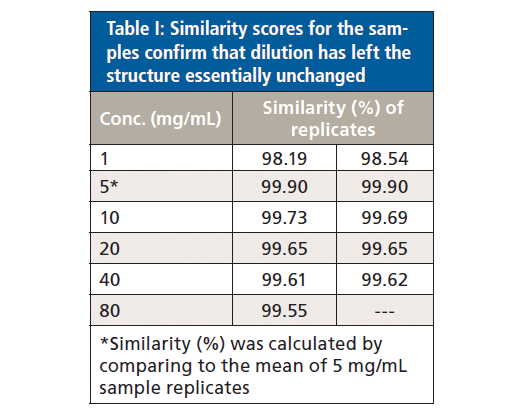
Protein similarity can also be directly compared via area of overlap (AO) plots (data not shown) which quantify the extent to which the spectra for two samples are similar (see Table I). Using the average AO plot for the two 5 mg/mL samples as the reference for comparison, this analysis indicates that the 1 mg/mL samples have a similarity of 98.2 to 98.5%, while all the remaining samples, across the remainder of the concentration range, have a similarity in the range 99.6 to 99.9%.
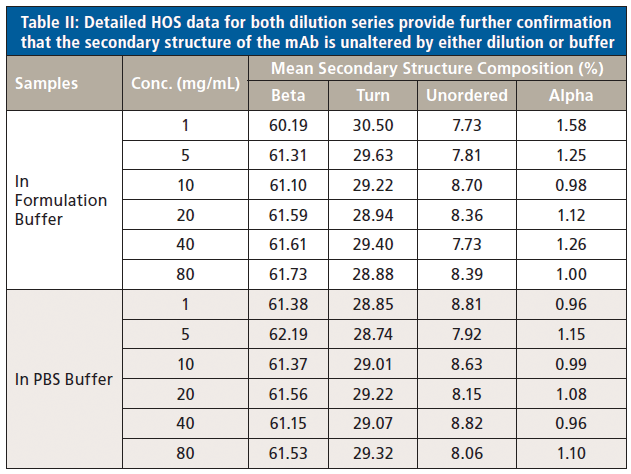
Finally, because absorption at specific wavenumbers is well-correlated with specific elements of secondary structure, the relative quantities of the different elements can be determined (see Figure 5). The secondary structure of the mAb is shown to consist predominantly of beta sheets (~60%) and beta turns (~30%), with a much smaller fraction of unordered structure and minimal levels of alpha-helix. Levels of each element are extremely consistent across each of the samples.
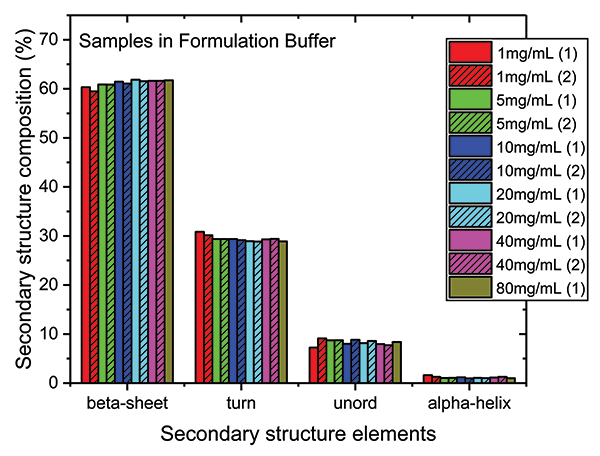
Figure 5: Higher order structure (HOS) analysis determines the quantity of specific elements of secondary structure present in the mAb, including beta sheet, beta turn, unordered structure, and alpha helix.
Analyzing the PBS Dilution Series
The data processing steps illustrated in the preceding stage were applied to elucidate the impact of diluting the mAb stock with PBS buffer. Figure 6 shows the protein concentration plot for the PBS dilution series alongside the absolute absorbance spectra.
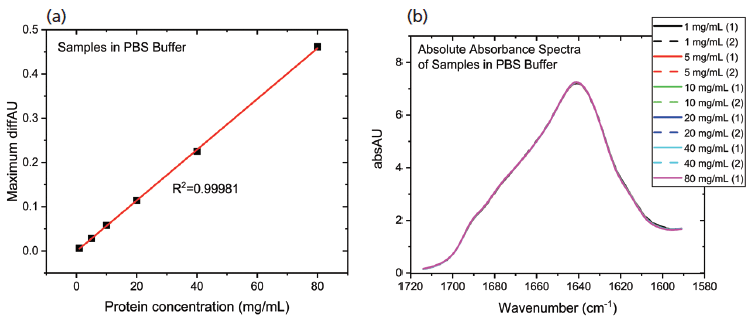
Figure 6: The protein concentration plot for the PBS dilution series showing (a) a very high degree of linearity; and (b) absolute absorbance spectra that are very closely matched, indicating a high degree of structural similarity in the samples.
These data show that dilution in the PBS has a closely comparable impact to dilution in the formulation buffer. The plot of maximum diffAU against protein concentration, for example, shows similar, comparably high linearity, exhibiting an R2 value of 0.9998. The absolute absorbance spectra indicate that the structure of the protein is closely similar across the full concentration range, as confirmed by the HOS analysis (see Figure 7).
These results are directly useful when it comes to comparing measurements with far-UV CD with MMS, or, indeed, FT-IR. The mAb stock solution was supplied at a concentration of 157 mg/mL, which is substantially outside the measurement range for far-UV CD, and there are limitations with respect to diluent choice, since formulation buffer cannot be used if it contains a significant level of chromophores. These data confirm that diluting the sample with PBS, an acceptable, well-characterized buffer for far-UV CD analysis, has no impact on the structure of the protein.
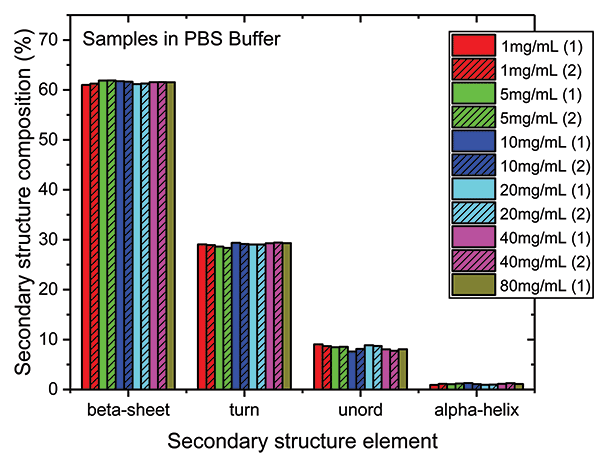
Figure 7: The HOS of the mAb in the PBS dilution series is closely similar to the formulation dilution series with beta sheet and beta turn the predominant structural elements.
Analyzing Similarity across Both Dilution Series
In a final analysis, the two datasets were merged to look at similarity with respect to both concentration and buffer. Figure 8 shows the second derivative spectra for all of the samples; Table II shows the associated HOS data.
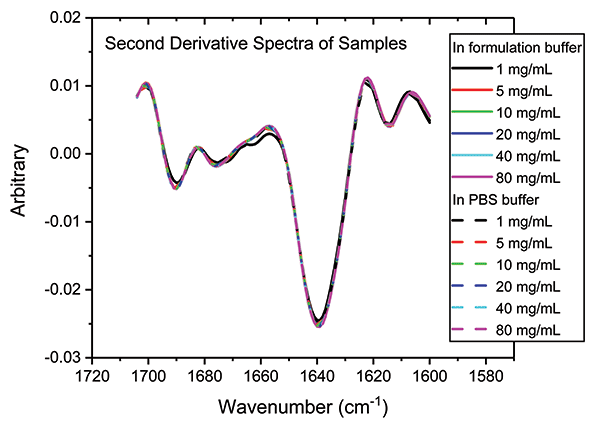
Figure 8: Combining second derivative spectra for all of the samples in both buffers confirms the exemplary similarity of secondary structure across both dilution series.
These data illustrate that the secondary structure of the mAb is extremely consistent, regardless of concentration or buffer. When compared with the 5 mg/mL sample in the formulation buffer, the similarity of the 1 mg/mL samples in formulation buffer are in the range of 98.2 to 98.5%, while those of all the other samples, in both the formulation and PBS buffer, are between 99.0 and 99.9%, indicating that the structure of the mAb is highly comparable across all the samples. The ability of MMS to measure across the full concentration range, without interference from either buffer, makes it extremely valuable for elucidating differences between data sets and for effective buffer screening. Here, the results indicate that any discrepancies observed between far-UV CD and MMS data are not attributable to either concentration or buffer components.
Conclusion
Instrumentation developed to characterize the secondary structure of proteins across a wide range of conditions, most especially over a broad concentration range, is particularly helpful to biopharmaceutical scientists. The development and manufacture of biopharmaceuticals calls for a detailed understanding and control of the drug entity, within the native formulation environment, and through manufacture and storage to the point of patient delivery. The use of different measurement techniques, especially under different protein conditions, significantly complicates the interpretation of and the analytical workflow. In particular, the comparison of datasets produced using alternative technologies can lead to discrepancies between results that cannot be attributed to the sample with any certainty.
The ability of MMS to measure with high reproducibility and repeatability, across a very wide concentration range, and to generate data unaffected by formulation excipients and additives, is extremely valuable within this context. This capability significantly reduces the need to compare and transfer specifications from one technique or instrument to another, thereby simplifying and nullifying risk in the analytical workflow, while at the same time reducing the cost associated with the purchase and ongoing maintenance of multiple instruments. Such flexibility makes MMS superior to alternatives such as far-UV CD and FT-IR for the essential task of characterizing the secondary structure of protein, from the earliest stages of drug delivery through to commercial biopharmaceutical manufacture and release testing.
References
(1) https://proteinstructures.com/Structure/Structure/secondary-sructure.html
(2) H. Fabian and W. Mantele, Handbook of Vibrational Spectroscopy, J.M. Chalmers and P.R. Griffiths, Eds. (John Wiley & Sons, Ltd., Chichester, United Kingdom, 2002), pp. 3399–3425.
(3) J.K. Koenig and D.L. Tabb, Analytical Applications of FTIR to Molecular and Biological Systems, J.R. Durig, Ed. (D. Reidel, Boston, Massachusetts, 1980), pp. 241–255.
(4) A. Dong, P. Huang, and W.S. Caughey, Biochemistry 29(13), 3303–3308 (1990).
(5) S.M. Kelly and N.C. Price, Curr. Protein Pept. Sci. 1(4), 349–384 (2000).
Libo Wang and Jeffrey Zonderman are with RedShift BioAnalytics, Inc., in Burlington, Massachusetts. Ioannis A. Papayannopoulos and Shannon Renn-Bingham are with Celldex Therapeutics, in Fall River, Massachusetts. Direct correspondence to: lwang@redshiftbio.com or iap@alum.mit.edu

LIBS Illuminates the Hidden Health Risks of Indoor Welding and Soldering
April 23rd 2025A new dual-spectroscopy approach reveals real-time pollution threats in indoor workspaces. Chinese researchers have pioneered the use of laser-induced breakdown spectroscopy (LIBS) and aerosol mass spectrometry to uncover and monitor harmful heavy metal and dust emissions from soldering and welding in real-time. These complementary tools offer a fast, accurate means to evaluate air quality threats in industrial and indoor environments—where people spend most of their time.
NIR Spectroscopy Explored as Sustainable Approach to Detecting Bovine Mastitis
April 23rd 2025A new study published in Applied Food Research demonstrates that near-infrared spectroscopy (NIRS) can effectively detect subclinical bovine mastitis in milk, offering a fast, non-invasive method to guide targeted antibiotic treatment and support sustainable dairy practices.
Smarter Sensors, Cleaner Earth Using AI and IoT for Pollution Monitoring
April 22nd 2025A global research team has detailed how smart sensors, artificial intelligence (AI), machine learning, and Internet of Things (IoT) technologies are transforming the detection and management of environmental pollutants. Their comprehensive review highlights how spectroscopy and sensor networks are now key tools in real-time pollution tracking.