Article
Spectroscopy
Spectroscopy
The pH Dependence of the SERS Spectra of Methyl Yellow in Silver Colloid
Author(s):
Surface plasmon resonance, charge-transfer resonance, and their combination determine the enhancement of surface-enhanced Raman scattering signals, and the varying intensities of the signal at different pH levels may result from the change in contributions of the combined system.
Methyl yellow is an important azo dye that may be used as a pH indicator. In this study, the surface-enhanced Raman spectra of methyl yellow in silver colloids with various pH values were investigated. A relative intensity analysis indicated the intensities of the Raman bands changed primarily when the pH was lowered from 4 to 3. The enhancement of surface-enhanced Raman scattering (SERS) signals is determined mainly by surface plasmon resonance, charge-transfer resonance, and their combination. The varying intensities of SERS signals in solutions with different pH levels may result from the change in the contributions of their combined systems, such as the charge of methyl yellow molecules and the adsorption of molecules on the surface of silver.
Surface-enhanced Raman scattering (SERS) is a highly sensitive analytical tool for investing the adsorption of molecules and characterizing the structure and orientation of the molecules on rough metal surfaces (1–5). It is well known that some combination of three resonances (surface plasmon resonance, molecular resonance, and charge-transfer resonance) is responsible for the SERS enhancement (6). Surface plasmon resonance is mostly a property of the metal, such as the nature of the conduction band and nanoscale surface features, whereas molecular resonance is a property of the molecule. Charge-transfer resonance results from interaction between the molecule and the rough metal surface (7,8). Some information about the molecules may be obtained by analyzing the SERS spectra. Raman shift and relative intensity changes in the SERS spectra provide information about the adsorption of molecules on the metal surface (9,10).
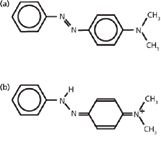
Azo dyes have attracted much attention in recent years (11–13), because they represent the largest class of dyes used in industry and are widely applied in analytical chemistry as acid–base, redox, and metallochromic indicators (14). Methyl yellow is an important azo dye and may be used as a pH indicator. Methyl yellow presents as the azo form (Figure 1a) in the organic phase, and as the hydrazo form (MYH+, Figure 1b) in the acidified aqueous phase. That structure transformation has been studied by the UV–vis spectrum and resonance Raman spectra (15). In those studies, however, the Raman spectra were observed only in a higher wavenumber range, 1100–1650 cm-1. Moreover, there have been few systemic investigations of the methyl yellow structure transformation with variations in pH. In this study, the methyl yellow structure transformation in solutions with varied pH values was investigated by SERS. The structure transformation and adsorption of the methyl yellow molecule on a silver surface were studied by analyzing the relative intensity change in the Raman bands in the SERS spectra.

Figure 1: Schematic structure of methyl yellow as (a) the azo-form in organic phase and as (b) the hydrazo-form in acidified aqueous phase.
Experimental
Methyl yellow was purchased from Aldrich Chemical Company (St. Louis, Missouri). All the chemicals used in the experiments were analytical grade.
Silver colloids were prepared in an aqueous solution by the reduction of silver nitrate with sodium citrate following the method reported by Lee and Meisel (16). Transmission electron microscopy (TEM) examination of the silver particles revealed that the particles were homogeneous, with an average diameter of ~50 nm (17).
The silver colloid was diluted with water in a ratio of 1:4 (v/v). The silver colloid solution was activated by the addition of 0.01 M NaCl solution to the colloid solution in a ratio of 1:5 (v/v). For SERS measurements, samples were prepared by incubating the methyl yellow solution (in ethanol) at a concentration of 5 × 10⁻⁴ M with the NaCl-activated silver colloid at a ratio of 1:9, resulting in a final concentration of 5 × 10⁻⁵ M. Diluted HCl was used to adjust the solution pH and pH paper was used to measure values.
Raman and SERS spectra were recorded with a Raman microscopic spectrometer (Renishaw RM-1000, New Mills, United Kingdom) composed of an optical microscope, a CCD video camera, and a spectrometer. A 632.8-nm HeNe laser was used as the excitation source. The SERS spectra of the probed molecules were measured with an accumulation time of 10 s using a 20× object lens. The laser power focused on the sample was ~5 mW, and the spectral resolution was set to 3 cm-1. The analysis of the spectra for all pH values was performed by nonlinear curve fitting using Origin 7.0 software (OriginLab Corporation, Northampton, Massachusetts). Curve fitting was carried out considering the band as a Lorentzian curve.
Results and Discussion
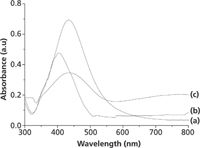
Figure 2a shows the UV–vis absorption spectrum of the silver solution. The silver solution absorbs light at λmax = 432 nm. The absorption spectrum of methyl yellow solution (in ethanol) is shown in Figure 2b. The absorption peak appears at λmax = 403 nm, which is near the absorption peak of the silver solution. Figure 2c shows the absorption spectrum of the combined system of silver solution and methyl yellow. The addition of methyl yellow to the silver solution resulted in a decreased intensity of the absorption peak, along with an appearance of a new wide band in the range of 600–800 nm resulting from the aggregated silver particles. It was found that a significant enhancement of the band intensities may be obtained when aggregates of two or more nanoparticles oscillate collectively and these collective oscillations of nanoparticles extend the range of useful localized surface plasmon effects throughout the visible and near-infrared region of the spectrum (6). The excitation wavelength of the laser, 632.8 nm, is far away from the absorption peak of methyl yellow, thus there are no surface-enhanced Raman resonance scattering components in the SERS spectra in this study. The contribution of molecular resonance to the SERS enhancement is small.

Figure 2: UVâvis absorption spectra of (a) silver solution, (b) methyl yellow solution, and (c) the combined system of silver solution and methyl yellow.
Figure 3 shows the normal Raman spectrum of methyl yellow powder. Figures 4 and 5 show the SERS spectra of methyl yellow in silver colloid solution with varied pH values. We have recorded SERS spectra of methyl yellow by changing the pH values in one-unit increments from 1 to 7. However, in Figures 4 and 5 we have shown a few characteristic spectra. The Raman bands are labeled and the assignments of the Raman bands are listed in Table I (15,18–23).

Figure 3: Normal Raman spectrum of methyl yellow powder in the ranges of (a) 200â950 cm-1 and (b) 950â1800 cm-1.
Compared with the normal Raman spectrum, the Raman signals of the molecules have been significantly enhanced in SERS. Some new bands appear in the SERS spectra, including bands at 892, 997, 428, 474, 510, and 977 cm-1 (Table I). According to a unified approach to SERS (6), the presence of non-totally symmetric bands in the excitation profile indicates the presence of charge-transfer contributions to the enhancement. Although these molecules do not have enough symmetry for a definitive test of the strong changes in spectral lines, the presence of the Raman lines mentioned above in the SERS spectra indicates strong charge-transfer effects between the molecules and the silver surface.

Table I: Observed normal Raman and SERS bands of DAB in varied environments and their tentative assignments
When the pH levels are varied from 4 to 7, no new Raman bands appear in the SERS spectra. At pH 2 and pH 3, however, new Raman bands appear at 892 cm-1 (Figure 4a), 979 cm-1 (Figure 4b), 1222 cm-1 (Figure 5a), and 1492 cm-1 (Figure 5a). Although the assignments of these bands are not clear, the presence of the bands could be attributed to the vibrational modes of hydrazo form (MYH+). MYH+ is dominant when the pH of the solution is less than 3.3, the pKa of methyl yellow. The characteristic Raman bands of MYH+, 1619 and 1174 cm-1, were observed (Figure 5a) and are attributed to υ(C=C) and υ(N-N), respectively (18).

Figure 4: SERS spectra of methyl yellow (5 Ã10-5 M) in 200â1100 cm-1 range at pH (a) 2, (b) 3, (c) 4, and (d) 7.
The relative intensity changes of all the SERS Raman bands with pH variation were analyzed. Figure 6 shows the relative intensity variations of three representative SERS bands at 1140, 1408, and 824 cm-1 with pH variations from 2 to 7. The intensities of the SERS Raman bands change slightly when the pH values change from 4 to 7 and from 2 to 3, respectively, whereas there is a large change in the intensities when the pH value is lowered from 4 to 3.

Figure 5: SERS spectra of methyl yellow (5 Ã10-5 M) in 1100â1800 cm-1 range at pH (a) 2, (b) 3, (c) 4, and (d) 7.
The azo form predominates when the pH is greater than 3.3, the pKa of methyl yellow, and the hydrazo form predominates when the pH is lower than 3.3. This can be seen clearly by comparing the SERS from pH 2 to pH 7. A band is present at 276 cm-1 at pH 4 (Figure 4c) and 275 cm-1 at pH 7 (Figure 4d), whereas this band disappears at pH 2 (Figure 4a) and pH 3 (Figure 4b). It is reported that Ag-N vibration appears at very close frequencies in this range (21–23). It is reasonable to think that the methyl yellow molecule in azo form at high pH levels is adsorbed on the silver surface through the nonbonding electron of the N atom. On the other hand, at low pH levels, the dominant structure of methyl yellow is the hydrazo form, with a positively charged N atom, and there are more chlorinated sites on the silver surface as a result of the high Cl- concentration. It is reasonable to suppose that the MYH+ molecule is adsorbed on the silver surface through the bridge of N+-Cl--Ag+.

Figure 6: Relative intensity variation of methyl yellow SERS bands at (a) 1140, (b) 1408, and (c) 824 cm-1 with pH variation from 2 to 7.
The Raman spectra provide vibrational information that is specific for the chemical bonds in molecules. The enhancement of SERS signals is determined by the surface plasmon resonance, molecular resonance, charge-transfer resonance, and their combination (6). The UV–vis absorption spectra shown in Figure 2 indicate that the contribution of molecular resonance to the SERS is small. The surface plasmon resonance is excited by laser radiation and may result from the aggregations of silver nanoscale particles. Some new lines appear in the SERS spectra, indicating strong charge-transfer effects between the molecules and the silver surface. Therefore, the enhancement of SERS signals is determined mainly by surface plasmon resonance, charge-transfer resonance, and their combination. The change in SERS intensities with variations in the pH may result from the change in the contributions of the various resonances. At high pH levels (pH 4–7), the azo form of methyl yellow molecules predominates, because these molecules adsorb onto the silver surface through Ag-N bonding. At low pH levels (pH 2–3), the hydrazo form predominates, because these molecules are adsorbed on silver surface through the bridge of N+-Cl--Ag+. The adsorption change of the molecules may make the molecular orientation change, thus causing the intensities to change. This is consistent with the surface selection rules based on surface plasmon resonance (6). The interaction of molecules with a silver surface may change primarily as a result of the charge of the methyl yellow molecule (MYH+).
Conclusion
The SERS spectra of methyl yellow in varied pH solutions were studied. The enhancement of SERS signals is determined mainly by surface plasmon resonance, charge-transfer resonance, and their combination. A relative intensity analysis of the Raman bands indicated that the intensities change primarily when the pH changes from 4 to 3. This may be a result of a change in the contributions of their combined system, such as the charge of methyl yellow molecules and adsorption of molecules on the silver surface.
References
(1) M. Fleischman, P.J. Hendra, and A.J. McQuillian, Chem. Phys. Lett. 26, 163–166 (1974).
(2) K. Kneipp, H. Kneipp, V.B. Kartha, R. Manoharan, G. Deinum, I. Itzkan, R.R. Dasari, and M.S. Feld, Phys. Rev. E 57, R6281–R6284 (1998).
(3) S. Nie, and S.R. Emory, Science 275, 1102–1106 (1997).
(4) A. Sackmann and A. Materny, J. Raman Spectrosc. 37, 305–310 (2006).
(5) P.W. Barber, R.K. Chang, and H. Massoudi, Phys. Rev. Lett. 50, 997–1000 (1983).
(6) J.R. Lombardi and R.L. Birke, J. Phys. Chem. C 112, 5605–5617 (2008).
(7) J.R. Lombardi, R.L. Brike, T. Lu, and J. Xu, J. Chem. Phys. 84, 4174–4180 (1986).
(8) J.F. Arenas, I. Lopez Tacon, M.S. Wooley, J. Cotero, and J.I. Marcos, J. Raman Spectrosc. 29, 673–678 (1998).
(9) A.K. Ojha, A. Singha, S. Dasgupta, R.K. Singh, and A. Roy, Chem. Phys. Lett. 431, 121–126 (2006).
(10) A.K. Ojha, Chem. Phys. 340, 69–78 (2007).
(11) L. Wang, X.J. Pan, and F. Wang, Dyes and Pigments 76, 636–645 (2008).
(12) F.A. Pasha, M. Muddassar, H.W. Chung, S.J. Cho, and H. Cho, J. Mol. Model. 14, 293–302 (2008).
(13) H. Destaillats, A.G. Turjanski, D.A. Estrin, and M.R. Hoffmann, J. Phys. Org. Chem. 15, 287–292 (2002).
(14) H. Zollinger, Color Chemistry, Syntheses, Properties, and Applications of Organic Dyes and Pigments (VCH, New York, 1987), pp.1436–1451.
(15) F.B. James and B.Y. Ernest, J. Phys. Chem. 85, 1005–1014 (1981).
(16) P.C. Lee and D. Meisel, J. Phys. Chem. 86, 3391–3395 (1982).
(17) Z.L. Zhang, Y.F. Yin, J.W. Jiang, and Y.J. Mo, J. Mol. Stru. 920, 297–300 (2009).
(18) M. Michl, B. Vlckova, and P. Mojzes, J. Mol. Stru. 482, 217–223 (1999).
(19) K. Machida, B.K. Kim, Y. Saito, K. Igarashi, and T. Uno, Bull. Chem. Soc. Jpn. 47, 78–82 (1974).
(20) B. Nandita and U. Siva, J. Phys. Chem. A 104, 2734–2745 (2000).
(21) M.M. Miranda and G. Sbrana, J. Raman Spectrosc. 27, 105–110 (1996).
(22) W.S. Oh, M.S. Kim, and S.W. Suh, J. Raman Spectrosc. 18, 253–258 (1987).
(23) K.A. Bunding, R.L. Birke, and J.R. Lombardi, Chem. Phys. 54, 115–120 (1980).
Zhen Long Zhang and Yu Jun Mo are with the School of Physics and Electronics at Henan University, in Kaifeng, China.
Da Hu Chang is with the Department of Mathematics and Science at the Luoyang Institute of Science and Technology, in Luoyang, China.
Newsletter
Get essential updates on the latest spectroscopy technologies, regulatory standards, and best practices—subscribe today to Spectroscopy.


