Physicochemical Analysis and Detection of Rice Syrup Adulteration in Kelulut Honey Using Portable Near-Infrared Spectroscopy
Kelulut honey is prominent and valuable in the honey market because of its abundant health benefits. However, many adulteration cases of Kelulut honey have been reported. Rice syrup is one of the emerging adulterants used in Kelulut honey. This study aimed to assess and detect adulteration of Kelulut honey with different percentages of rice syrup using near-infrared (NIR) spectroscopy. All honey samples and rice syrup adulterants were stored at low temperatures. In this research, a NIR spectrometer from Texas Instruments was used to detect moisture content, electrical conductivity, water activity, hydroxy methyl furfural content, and honey color. The moisture content, electrical conductivity, water activity, hydroxy methyl furfural (HMF) content, and the color of the samples decreased when the adulterated percentage of honey increased except pH. The HMF content and pH did not comply with Malaysian standards. The physicochemical tests showed a significant positive correlation with each other, excluding the pH (p < 0.01). Later, spectra were collected for NIR spectroscopy and were pre-processed using cutting, extended multiplicative signal correction (EMSC), and Savitzky-Golay filter, followed by prediction of regression models. For NIR spectroscopy detection, the principal component regression (PCR) model showed higher accuracy (R2 = 0.914) than the partial least squares (PLS) model. This result suggests that the PCR model was the better prediction model. Therefore, this study facilitated the development of a rapid and non-destructive method to detect Kelulut honey adulteration using handheld NIR spectroscopy technology.
Honey is a natural sweetener made by bees from nectar. It has been utilized for centuries for its nutritional and therapeutic benefits (1). Kelulut honey is produced by Heterotrigona itama bees, whereas Melaleuca flowers provide the majority of the nectar. Honey is often used as a sweetener or an ingredient in confectionery and pastry products. It is also used in the pharmaceutical and medical sectors (2). Natural honey imports climbed from 6454 to 6695 tons between 2017 and 2019, according to International Trade Statistics, owing to a growth in the population as well as a rise in the inclination for natural foods (3).
According to BERNAMA Malaysia (4), stingless bee farming, also known as Kelulut, is gaining attraction in the honey business, bringing in RM 33.6 million in Malaysia in 2020. Kelulut honey is often found in tropical and subtropical regions of the world. When compared to honeybees, Kelulut bees are more disease- and pest-resistant, nontoxic, and superb pollinators, according to several studies, resulting in their honey having antibacterial, antiulcer, and other health advantages (5,6). However, adulteration of honey has becoming more common over time (7). Adulteration is the process of adding or removing components from food, resulting in a decrease of quality (8). An adulterant is a material introduced to food that could be harmful or harmless to human health (9). According to the Deputy Director of MARDI, 15 out of 270 samples of Kelulut honey at the local market were fake honey (10). Since 2016, seven samples out of 77 examined samples from various honey brands have been found to be in violation of the Food Regulations 1985, according to the Director-General of Health Malaysia (11).
Adulteration is commonly accomplished by mixing sucrose syrup from sugar beets, maltose syrup, high-fructose syrup, or industrial syrups like glucose and fructose straight into honey (12). Rice syrup is now one of the most often used adulterants (9). It is made from C3 plants, which are similar to honey (13). Calvin and Benson photosynthesis cycles are followed by C3 plants. This made conventional detection procedures like carbon isotope ratio analysis and thin-layer chromatography (TLC) ineffective in detecting honey adulteration with rice syrup (14). High performance liquid chromatography (HPLC), electronic nose, Fourier transform infrared spectroscopy (FT-IR), TLC, mid-infrared spectroscopy (MIR), carbon isotope ratio analysis test, and other detection techniques have been used in the honey business to detect adulteration (15–19). Detection techniques, such as HPLC, TLC, and MIR, take longer and may damage the sample. Because the carbon isotope ratio profiles of rice syrup and honey are similar, 13C:12C isotope ratio analysis is useless for detecting rice syrup in adulteration.
Furthermore, rice syrup is made using hydrolysis of polysaccharides and oligosaccharides, making it difficult to identify adulteration using TLC and HPLC (20). As a result, simple, reliable, and non-destructive techniques for determining the chemical composition of honey are urgently needed (21). Recent research has looked at near-infrared (NIR) spectroscopy, which is a fast and sensitive detection tool. It requires only a tiny sample amount, and it can be operated on-site, making it ideal for bulk monitoring (22). As a result, the purpose of this research was to improve the quality assessment and detection of rice syrup adulteration in Kelulut honey. To do so, the impact of various percentages of rice syrup in Kelulut honey was evaluated by examining the physicochemical properties and comparing the results to the Malaysian standard (23). Aside from that, the goal of this research was to see if utilizing NIR spectroscopy and regression models can identify the addition of varying amounts of rice syrup in Kelulut honey.
Materials and Methods
All the samples of H&B honey (Bee farm Malacca) were kept in a clean, dry container with labeling in the storage room between 0 °C and 4 °C. The rice syrup (Radiant Whole Foods Organic) adulterant was kept cold as well. Other materials used were the Carrez solution I, Carrez solution II, filter paper, volumetric flask, test tubes, sodium bisulphite, and the spectrophotometer. In this research, the NIR spectroscopy equipment used was the DLP NIR scanNano EVM by Texas Instruments (Figure 1).
FIGURE 1: DLP NIRscan Nano EVM (NIR spectroscopy equipment).

Sample Preparation
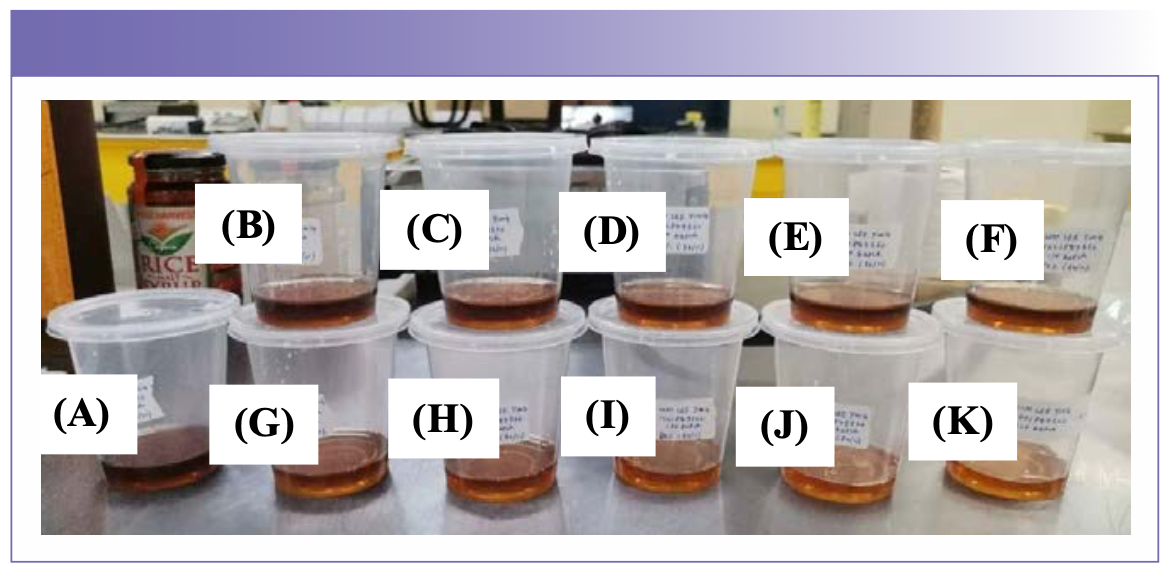
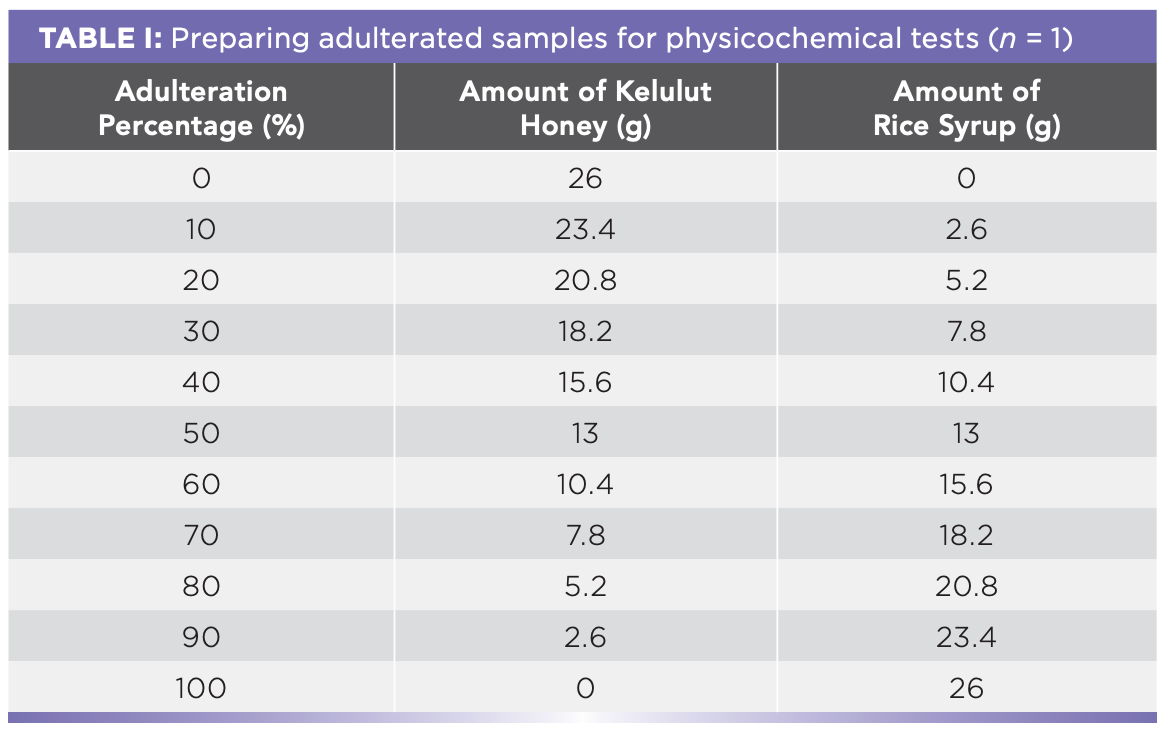
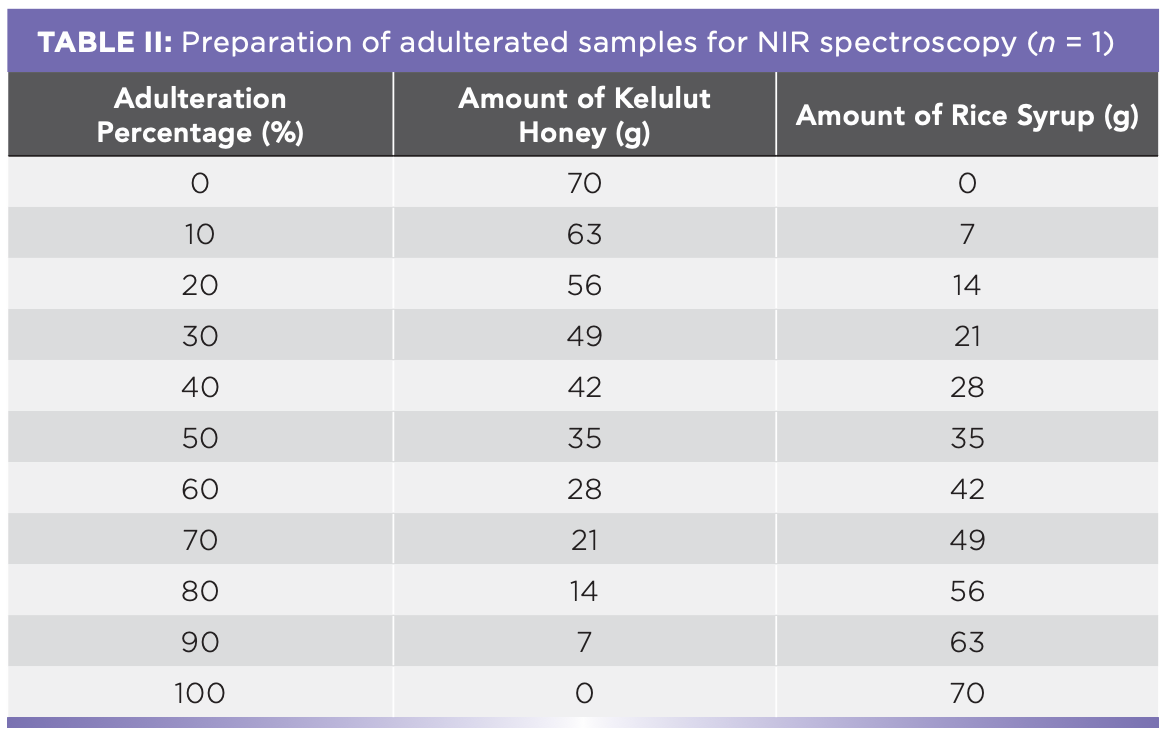
The Kelulut honey was mixed with rice syrup in various quantities to create adulterated samples. The proportion of adulteration for the study was 0, 10, 20, 30, 40, 50, 60, 70, 80, 90, and 100% (w/w) (Figure 2, Tables I and II).
FIGURE 2: Adulterated Kelulut honey samples with 0% (A), 10% (B), 20% (C), 30% (D), 40% (E), 50% (F), 60% (G), 70% (H), 80% (I), 90% (J) and 100% (K) rice syrup added.
Physicochemical Analysis
The moisture content, HMF, and pH were determined using a Digital Brix refractometer, spectrophotometer, and pH meter, respectively (23). The HMF content was then calculated using Equation 1. The electrical conductivity was measured with an electrical conductivity meter, according to Fatima and others (24). The sample’s water activity (25) and color (26) were also determined.

A284 refers to the absorbance at 284 nm; A336 refers to the absorbance at 336 nm; D is the dilution factor; and W is the weight of honey taken.
NIR Spectroscopy Detection
Samples were scanned in triplicate, placed in a cuvette, and scanned for 14 d at wavelengths ranging from 900 to 1700 nm, both inside and outside. Each spectrum was collected in an average of 6 scans in 30 s. For more accurate results, aluminum foil was wrapped around the samples. To increase the accuracy, a total of 1848 spectra were obtained using the same cuvette. The spectra were then submitted to a regression model after pre-processing. To maximize the chemical composition contribution, pre-processing was required (27) and Orange Data Mining software was utilized (Bioinformatics Lab, University of Ljubljana, Slovenia). Cutting, extended multiplicative signal correction (EMSC), and the Savitzky-Golay filter were all included. Following the cutting, the spectra from 950 nm to 1650 nm were saved. The EMSC was carried out in the polynomial order of two. After that, a Savitzky-Golay filter was used with a window of 5 and a polynomial order of 2. Principal component regression (PCR) and partial least square (PLS) regression were used as regression training models in this investigation. The pre-processed spectra data was split into two groups, with 80% of the data serving as training data and 20% of the data serving as testing data. After that, the training and testing data sets were given to the PCR and PLS for prediction, with the correlation coefficient (R2) and root mean square error (RMSE) being evaluated as prediction performance. The greater the R2 and the lower the RMSE, the better the models’ performance (28).
For multivariate data analysis, PCR is a linear regression model derived from principal component analysis (29). According to Salleh and others (30), PCR first uses PCA to deecompose the data matrix X into a new latent variable. The score gained is then used to do multiple linear regression between it and the selected property of interest, Y. Equation 2 represents the linear model of PCR. PCR was used to extract feature representations from collinear and high-dimension data (31):

with A = weighted normalized matrix of order (n x p), which the new coordinates for the n objects in the new system; p = loading - PCs, which refers to the loading matrix and the column vectors; b = coefficients; and e = error vector.
On the other hand, because of its simplicity and modest volume of computations, PLS is one of the most often used chemometric algorithms in quantitative NIR spectroscopy analysis to create the calibration model (32,33). When a large number of dependent variables (Y) must be estimated from a large number of independent variables (X), this method is quite beneficial. The best number of latent variables is determined using cross-validation based on the minimum prediction error (30). In both domains, it is a latent method to modeling covariance structures (34).
Statistical Analysis
Three triplicates of each experimental treatment (n = 3) were taken. The diversity between the physicochemical characteristics of different percentages of rice syrup-adulterated Kelulut honey was determined using an ANOVA test and Pearson correlation with a significance of p ≤ 0.05. Minitab 17 (Minitab, LLC) was used to analyze the data gathered in this study.
Results and Discussion
Physicochemical Properties
Table III lists the physicochemical characteristics that were determined in this investigation. The moisture content was significant because it affects the honey’s resistance to fermentation and granulation (35). When 0–70% rice syrup is applied, the moisture content drops from 28.58% to 19.48%, as shown in Table III. However, increasing the amount of rice syrup from 70% to 100% did not result in a significant reduction in moisture content (p > 0.05). This is in line with El-Bialee and Sorour’s (36) findings that the moisture level of several contaminated samples was likewise lower than the pure honey sample. As a consequence, the findings are satisfactory, and the lower the moisture level of the honey samples, the greater the proportion of rice syrup applied. According to Ribeiro and others (17), the moisture content of honey increases progressively with the addition of adulterants, from 17.60% in pure honey to 22.80% in 100% adulterated honey. The moisture level of Kelulut honey shall not exceed 35%, according to Malaysian standards (23). Pure honey had a moisture content of 28.58%, whereas the contaminated honey samples had a moisture content of less than 35%, suggesting that the moisture content criterion could not be utilized to identify whether the honey was adulterated or not.

Honey’s electrical conductivity is linked to its mineral content, organic acids, and protein content (25). When 0–100% rice syrup was applied, the electrical conductivity drops from 0.441 mS/cm to 0.029 mS/cm, as indicated in Table III. The results showed a decrease in the mineral level when the amount of rice syrup added increases. Geographical origin, botanical origins, and entomological origins were all plausible influences on the honey’s electrical conductivity (25). According to Fatima and others (24), the electrical conductivity of the pure honey sample was 0.47 and 0.55 mS/cm, which was virtually the same to 0.441 mS/cm in the study.
When 0–90% rice syrup was applied, there was no significant difference (p > 0.05) in the pH change, which ranged from 3.11 to 3.87. However, increasing the amount of rice syrup from 90 to 100% results in a pH rise from 3.87 to 5.84. The pH of the honey increased as the amount of corn syrup added to the honey increased, according to Ribeiro and others (17). The pH of pure Kelulut honey was 3.11, which was within the Malaysian standard range of 2.5 to 3.8 (23). The pH, according to Malaysian standards, is comparable to 10–80% rice syrup adulteration. Hence, it is unable to determine whether the honey is adulterated or not because the pH of adulterated honey samples (10–80%) are also within this range, designed for the pH of pure Kelulut honey as per the Malaysian standards. The extraction, storage condition, and temperature were all factors in the increased pH of adulterated honey samples, according to Wan and others (37).
According to this study, the water activity in adulterated honey samples decreases from 0.77 at 0% to 0.70 at 100%, indicating that the food products are microbiologically stable (38). According to Chirife and others (39), there is a linear relationship between moisture content and water activity, as seen in Table III. Honey’s water activity is usually between 0.60 and 0.65 (25). The water activity of the pure Kelulut honey sample in this investigation was 0.77, which is similar to the results that Shamsudin and others (40) and Yap and others achieved (41).
HMF is a highly reactive compound that can go through the Maillard process (38). It was influenced by the sugar content and the pH of honey, according to Singh and Bath (42). According to the study, HMF concentration drops from 435.25 mg/kg at 10% to 167.03 mg/kg at 100% with significant differences at 10–70% and 80–100%. However, there is no significant change (p > 0.05) in HMF content between 0–10% and 70–80% adulteration. According to the Malaysian standard (23), the HMF concentration of pure honey shall not exceed 30 mg/kg, but pure Kelulut honey in this study exceeded it. Nonetheless, Wan and others (37) reported that it was between 35.4 and 461.7. Variable storage conditions, processing, preparation, and aging are all probable causes of increased HMF concentration in pure honey (37). Because of the heating used during adulteration, the HMF concentration of adulterated honey samples was substantially greater than that of pure honey, according to Samat and others (43).
For the color analysis, the absorbance of honey was reduced by adding rice syrup, which decreases from 0.160 at 0% to 0.087 at 80%. However, at 80–100% rice syrup adulteration, there is no significant variation in absorbance (p > 0.05). According to Fatima and others (24), the absorbance of Kelulut honey ranged from 0.239 to 1.056, which is greater than the current study. This might be attributed to a variety of variables, including mineral content, geographical and botanical origin, storage time, and light duration of honey (24).
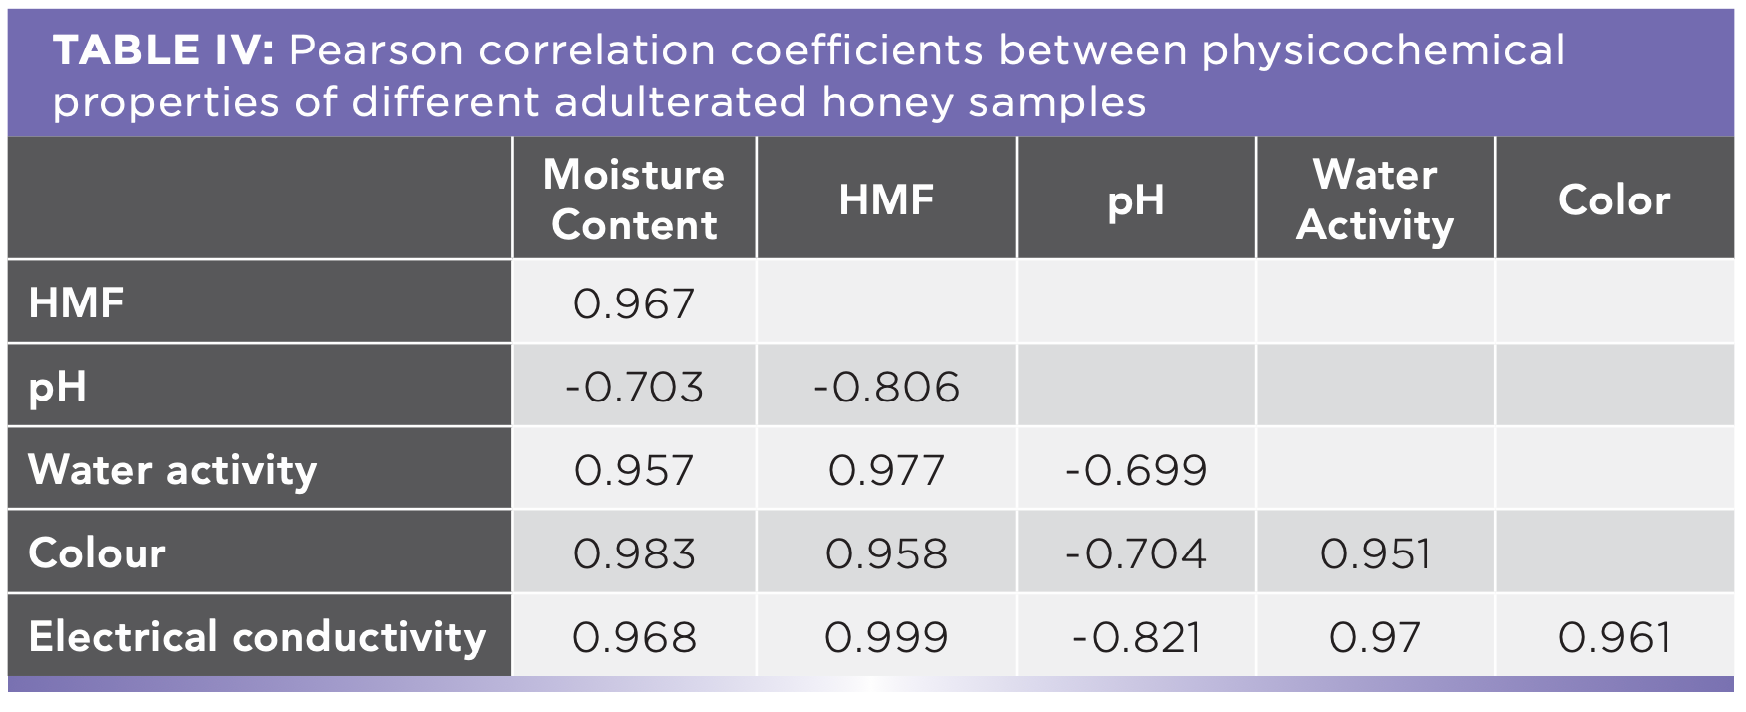
The Pearson correlation coefficients between the physicochemical parameters investigated in this study were shown in Table IV. The pH parameter was the only one that exhibited a significant negative association (p < 0.01) with moisture content, HMF concentration, water activity, color, and electrical conductivity. Except for pH, all other variables exhibited substantial positive correlations (p < 0.01), indicating that the results are significantly linked.
NIR Spectroscopy
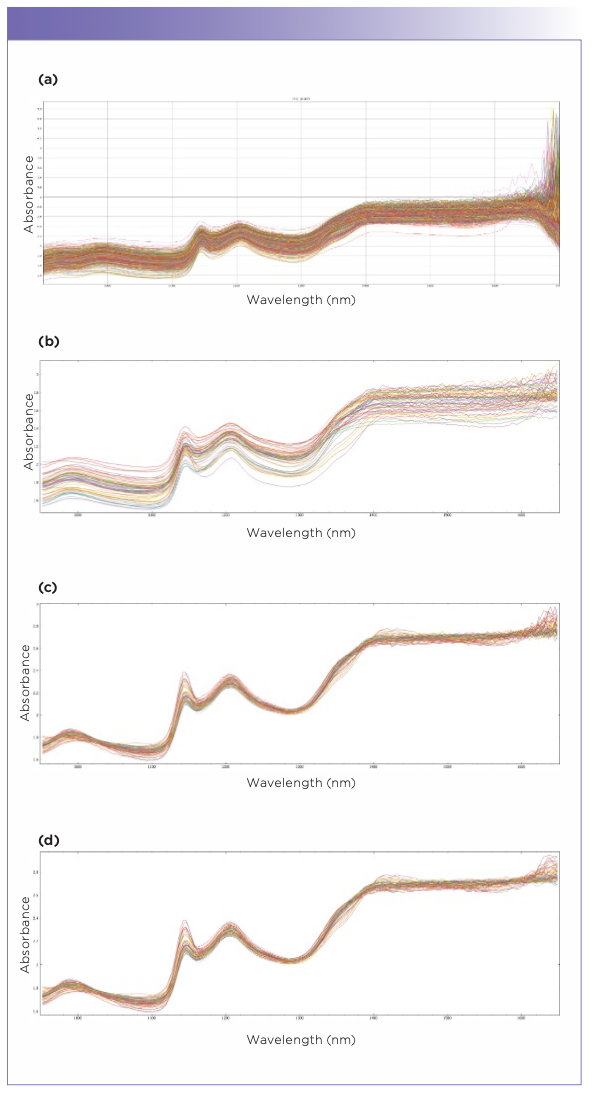
The wavelength varied from 900 nm to 1700 nm, and a total of 1848 spectral data were obtained. Figure 3a shows the NIR reflectance spectra of Kelulut honey samples that were adulterated with 0 to 100% rice syrup. Because of the background data and noise generated by light scattering, it is impossible to differentiate between the honey samples (44). As a result, pre-processing is necessary to reduce noise and create highly twisted spectra. Figure 3b depicted the spectra after cutting; the wavelengths of the spectra varied from 950 nm to 1650 nm. The non-informative spectral data was removed, leaving the relevant spectral data. Then, the spectra were improved further using EMSC (Figure 3c). The slope and intercept of this linear fit are used to regress each spectrum to a model spectrum (45). Finally, the Savitzky-Golay filter was employed to minimize background data noise. Figure 3d shows the final condensed and uncluttered spectra after all of the pre-processing procedures.
FIGURE 3: (a) Spectra before pre-processing; (b) spectra after cutting; (c) spectra after cutting and EMSC; (d) and final spectra after cutting, EMSC, and Savitzky-Golay filter.
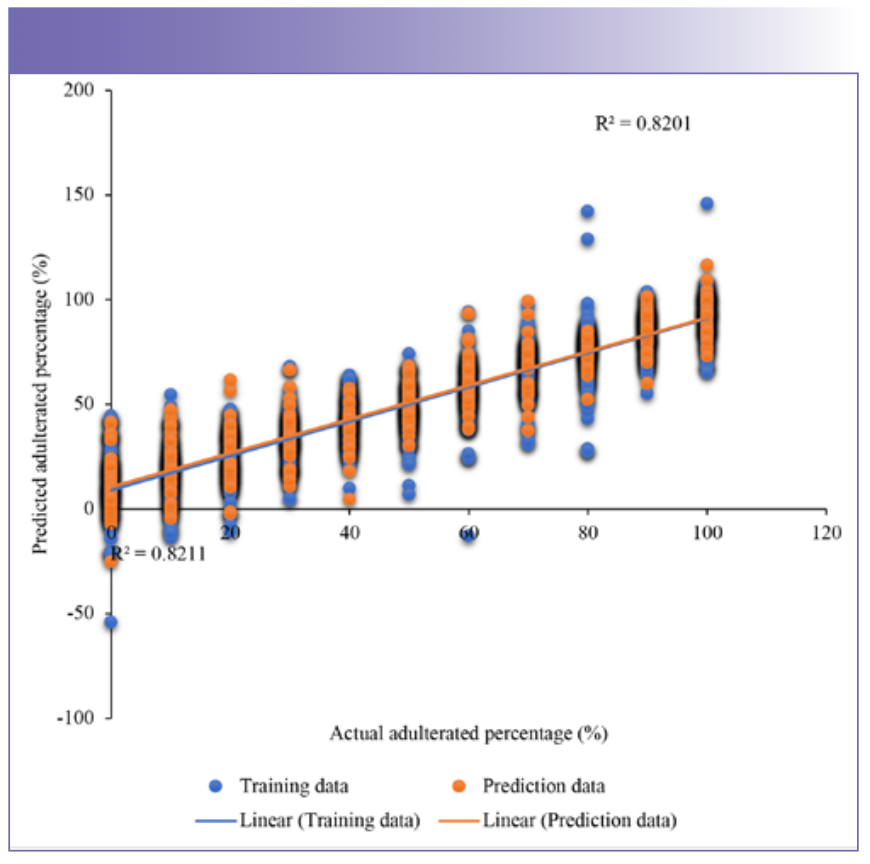
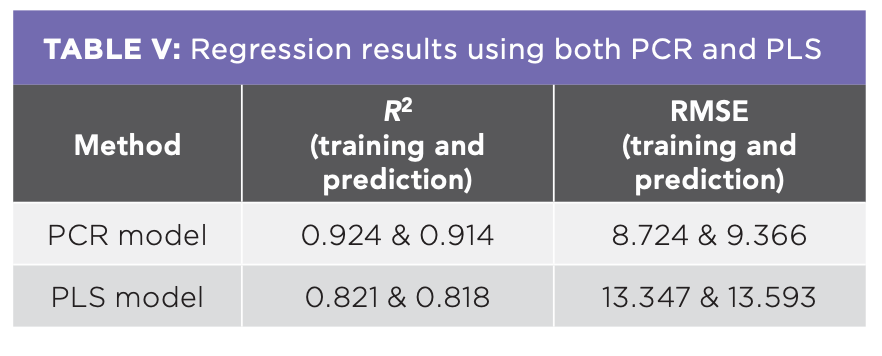
To detect the adulteration level of the honey samples from the spectra of NIR spectroscopy, regression model needs to be developed and validated (21). In this study, PCR and PLS were used to be the predictive models and were regressed with actual recorded value in x-axis and predicted value by the models in Y-axis. PCR and PLS regression prediction models were built using the training data set while the predictions were made on the testing data set. Figure 4 shows the graph of predicted and actual adulterated percentages of the adulterated Kelulut honey samples from the training data and testing data using the PCR model. On the other hand, Figure 5 shows the predicted and actual adulterated percentages of the adulterated Kelulut honey samples from the training data and testing data using the PLS model. The majority of the prediction data falls into the same adulteration percentage group as the training data set, implying that these two models may be utilized to identify and forecast adulterated rice syrup percentages in Kelulut honey. When these two graphs were compared, the PCR model had a better prediction performance since its R2 in the training and testing data (0.924 and 0.914) was greater than the PLS model (0.821 and 0.818).
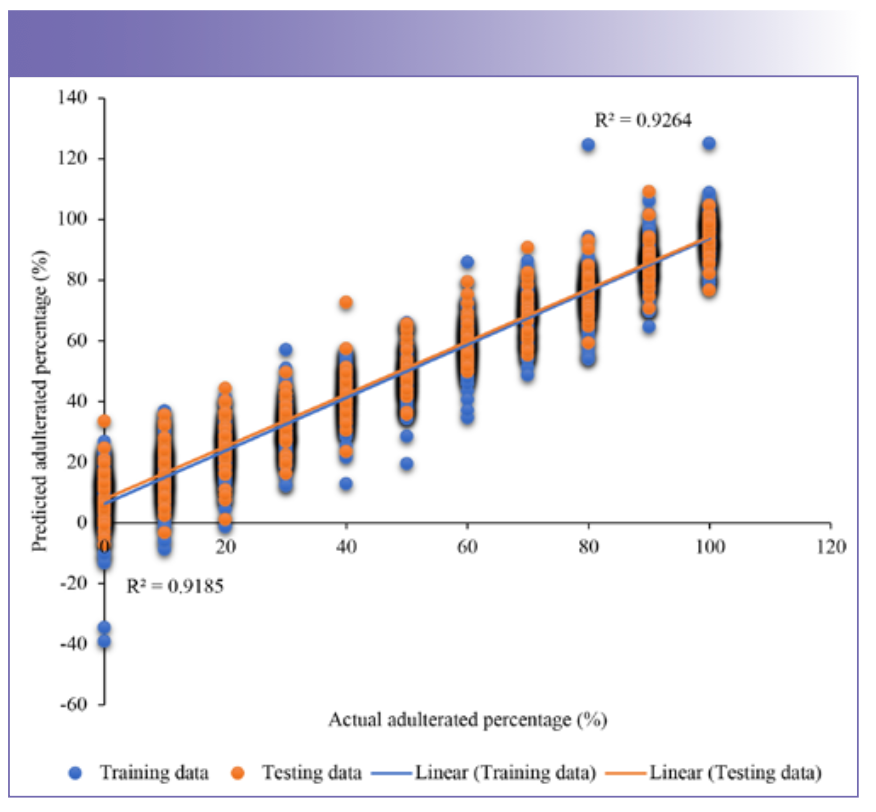
FIGURE 5: Plot of regression results using PLS for training (R2 = 0.821) and prediction (R2 = 0.818). The blue dots represent the training data set, whereas the orange dots represent the testing data set.
Increased noise levels in the NIR spectra above 1400 nm may have an effect on the precision and dependability of calibration models. High noise can increase uncertainty and make it more difficult for the model to accurately collect valuable spectral properties linked to the target variable. The target variable’s important information may be obscured or distorted by the strong noise in this spectral area. In conclusion, it is important to draw attention to the high noise levels in the NIR spectra above 1400 nm since they may have an impact on the calibration task. Investigating the effects of leaving this region out of the calibration data set can help shed light on the difficulties brought on by noise and possibly enhance calibration performance. The precision and stability of NIR spectra measurements are also maintained by accounting for temperature sensitivity in DLP devices.
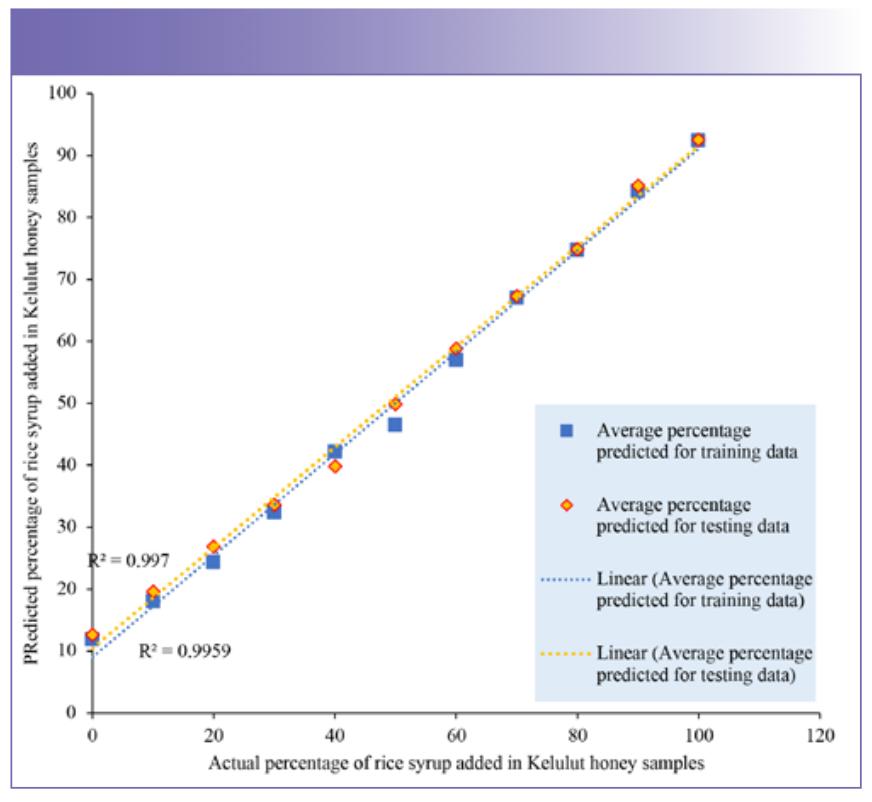
The scatter plots (Figure 6 and 7) were used to further explore the prediction performance of PCR and PLS on adulterated Kelulut honey samples from the training data and testing data. The average adulterated percentage of rice syrup was predicted similarly in both training and testing data, indicating that the PCR and PLS models have the ability to be employed in the prediction of Kelulut honey adulteration. As shown in Figures 6 and 7, PCR and PLS both performed well in terms of prediction, with the projected average percentage of rice syrup added in the samples nearly falling on the trendlines and the R2 of all trendlines above 99%. The R2 of the PCR model’s trendlines was between 0.9987 and 0.9985, indicating that it performed better than the PLS model in terms of prediction. R2 and RMSE were used to assess the performance of these two prediction models. The evaluation findings were presented in Table V using orange data mining software. RMSE stands for root mean square error, and the lower the RMSE, the better the predictive performance (46). In our analysis, the PCR model had the lowest RMSE.
FIGURE 6: Scatter plot of rice syrup adulteration percentage in the Kelulut honey samples predicted by the PCR model for the training data and testing data.
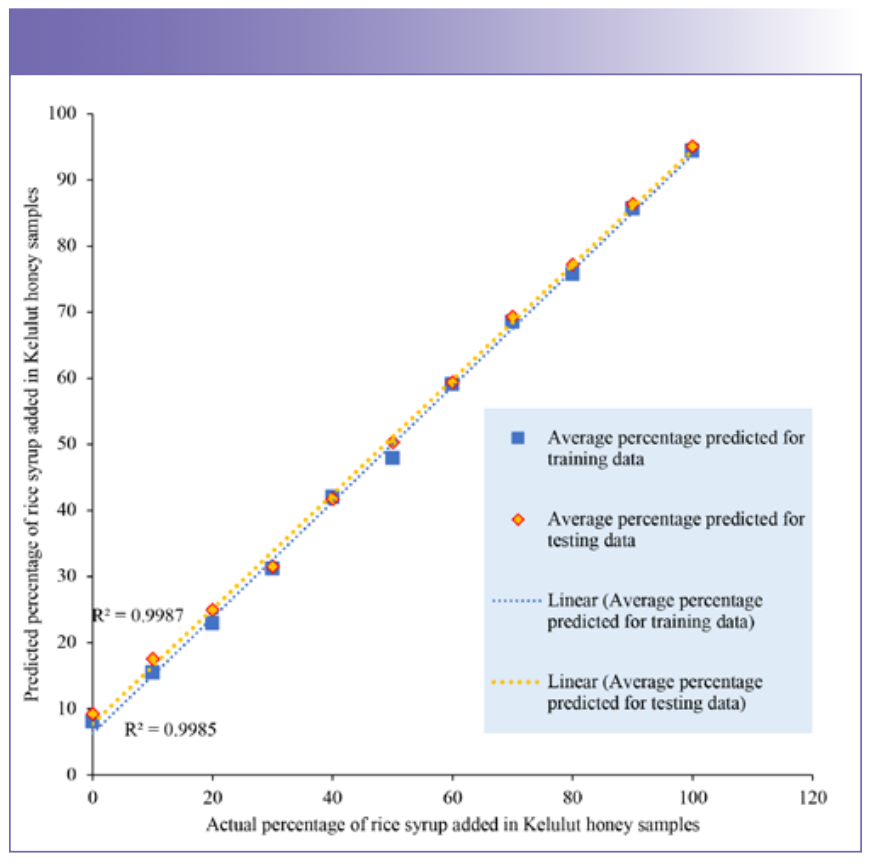
FIGURE 7: Scatter plot of rice syrup adulteration percentage in the Kelulut honey samples predicted by the PLS model for the training data and testing data.
However, the calibrations are frequently not applicable for “real world” sample prediction when using sophisticated regression methods on low-ranked data, such as intentionally created samples. Addressing the restrictions is essential to reducing these restrictions. obtaining a training data set that is diverse and indicative of the variety seen in real-world samples. To avoid overfitting and improve generalization, the regression model might be regularized or made simpler. By making sure the distribution of the training data closely resembles the distribution of the real-world data, one can account for covariate shift, including pertinent extra elements or variables that are known to or anticipated to have an impact on the samples taken from the real world.
Conclusion
The physicochemical properties moisture content, electrical conductivity, water activity, HMF content, color of the samples decreased when the adulterated percentage of rice syrup in Kelulut honey increased, with the exception of pH. However, it was observed that the values are in compliance with the Malaysian standard, even in some percentage of adulteration with rice syrup. Hence, it is not applicable to detect the Kelulut honey adulteration by comparison of the physicochemical properties with the Malaysian standard. As a result, using training and testing data, regression models such as PCR and PLS were constructed for the NIR spectroscopy to estimate the adulterated percentage of rice syrup in Kelulut honey samples following pre-processing procedures. When compared to the PLS model, the PCR model exhibits higher R2 values in both training and testing data, 0.924 and 0.914, respectively. In both the training and testing data, the RMSE of the PCR model was lower in the PLS model. The PCR model has a lower RMSE and a higher R2 than the PLS model, indicating that it has a superior predictive performance in detecting adulterated amounts of rice syrup added honey samples. NIR spectroscopy in the field can offer a practical and effective way for analyzing tainted honey. It is significant to emphasize that accurate instrument calibration, representative reference samples, and reliable chemometric modeling are necessary for NIR spectroscopy to be successful in analyzing contaminated honey. For trustworthy and accurate analysis results, regular instrument maintenance and calibration, adherence to standard operating procedures (SOPs), and validation of the calibration model are essential.
In conclusion, this study investigated the physicochemical properties of Kelulut honey that were adulterated with different percentages of rice syrup. The study also examined the feasibility of using handheld NIR spectroscopy to detect the adulteration of Kelulut honey with different percentages of rice syrup. This may provide useful information for future research on identification of Kelulut honey adulteration with various types of syrup, allowing rapid and easy quality control in the honey market.
Acknowledgment
The authors gratefully acknowledge “UCSI University, Faculty of Applied Sciences” for their technical support and guidance.
Conflicts of Interest
The authors declare there are no conflicts of interest.
References
(1) Samarghandian, S.; Farkhondeh, T.; Samini, F. Honey and Health: A Review of Recent Clinical Research. Pharmacognosy Res. 2017, 9 (2), 121–127.
(2) Ismail, M. M.; Ismail, W. I. W. Development of Stingless Beekeeping Projects In Malaysia. E3S Web of Conferences 2018, 52 (2018), 00028.
(3) Garcia, N. L. The Current Situation on the International Honey Market. Bee World, 2018, 95 (1), 1–6.
(4) Bernama Malaysia. Local Kelulut honey industry can reap RM3b in annual sales. 2020, https://themalaysianreserve.com/2020/03/02/local-kelulut-honey-industry-can-reap-rm3b-in-annual-sales/.
(5) Zainol, M. I.; Yusoff, K. M.; Mohd Yusof, M. Y. Antibacterial Activity of Selected Malaysian Honey. BMC Complement Altern. Med, 2013, 13 (129), 1–10.
(6) Yazan, L. S.; Zainal, N. M.; Mohd Ali, R.; Muhamad Zali, M. F. S.; Ong, Y. S.; Tor, Y. S.; Gopalsamy, B.; Voon, F. L.; Sapuan, S.; Esa, N.; Haron, A. S.; Zakarial Ansar, F. H.; Ahmad Mokhtar, A. M.; Syed Alwi, S. S. Antiulcer Properties of Kelulut Honey Against Ethanol-Induced Gastric Ulcer. Pertanika J. Sci. Technol. 2018, 26 (1), 121–132.
(7) Zábrodská, B.; Vorlová, L. Adulteration of Honey and Available Methods for Detection – A Review. Acta Vet. Brno 2014, 83 (10), S85–S102.
(8) Okeke, O. J. Food Adulteration as an Emerging Issue in Food Chemistry. Project Paper (B.Sc.) Godfrey Okoye University, 2019.
(9) Fakhlaei, R.; Selamat, J.; Khatib, A.; Razis, A. F. A.; Sukor, R.; Ahmad, S.; Babadi, A. The Toxic Impact of Honey Adulteration: A Review. Foods 2020, 9 (1538), 1–21.
(10) Osman, L.; Rashiqah, I. A. R.; Mohd Zulkifli, Z. Madu Diabetes. Berita Harian. 2017.
(11) Director-General of Health Malaysia. Kenyataan akhbar KPK– Isu madu tiruan. 2017.
(12) Tura, A. G.; Seboka, D. B. Review on Honey Adulteration and Detection of Adulteration in Honey. Int. J. Gastroenterol. 2020, 4 (1), 1–6.
(13) Simsek, A.; Bilsel, M.; Goren, A. C. 13C/12C Pattern of Honey from Turkey and Determination of Adulteration in Commercially Available Honey Samples Using EA-IRMS. Food Chem. 2012, 130 (4), 1115–1121.
(14) Xue, X. F.; Wang, Q.; Li, Y.; Wu, L. M.; Chen, L. Z.; Zhao, J.; Liu, F. M. 2-Acetylfuran-3-glucopyranoside as a Novel Marker for the Detection of Honey Adulterated with Rice Syrup. J. Agric. Food Chem. 2013, 61 (31), 7488–7493.
(15) Rios-Corripio, M. A.; Rojas-Lopez, M.; Delgado-Macuil, R. Analysis of Adulteration in Honey with Standard Sugar Solutions and Syrups Using Attenuated Total Reflectance-Fourier Transform Infrared Spectroscopy and Multivariate Methods. CyTA J. Food 2012, 10 (2), 119–122.
(16) Tosun, M. Detection of Adulteration in Honey Samples Added Various Sugar Syrups With 13C/12C Isotope Ratio Analysis Method. Food Chem. 2013, 138 (2–3), 1629–1632.
(17) Ribeiro, R. D. O. R.; Mársico, E. T.; da Silva Carneiro, C.; Monteiro, M. L. G.; Júnior, C. C.; de Jesus, E. F. O. Detection of Honey Adulteration of High Fructose Corn Syrup by Low Field Nuclear Magnetic Resonance (LF 1H NMR). J. Food Eng. 2014, 135 (2014), 39–43.
(18) Wang, S. Q.; Guo, Q. L.; Wang, L. L.; Lin, L.; Mu, T. N.; Cao, H.; Cao, B. S. Detection of Honey Adulteration with Starch Syrup by High Performance Liquid Chromatography. Food Chem. 2015, 172 (2015), 669–674.
(19) Gan, Z. L.; Yang, Y.; Li, J.; Wen, X.; Zhu, M. H.; Jiang, Y. D.; Ni, Y. Y. Using Sensor and Spectral Analysis to Classify Botanical Origin and Determine Adulteration of Raw Honey. J. Food Eng. 2016, 178 (2016), 151–158.
(20) Siddiqui, A. J.; Musharraf, S. G.; Choudhary, M. I.; Attar, R. Application of Analytical Methods in Authentication and Adulteration of Honey. Food Chem. 2016, 217 (2017), 687–698.
(21) Cozzolino, D.; Corbella, E. Determination of Honey Quality Components by Near Infrared Reflectance Spectroscopy. J. Apic. Res. 2003, 42 (1–2), 16–20.
(22) Se, K. W.; Wahab, R. A.; Syed Yaacob, S. N.; Ghoshal, S. K. Detection Techniques for Adulterants in Honey: Challenges and Recent Trends. J. Food Compos. Anal. 2019, 80 (2019), 16–32.
(23) Malaysian Standard. Kelulut (Stingless bee) Honey – Specification: MS 2683 – 2017, Department of Standard Malaysia 2017, 67, 180.
(24) Fatima, I. J.; Mohd Hilmi, A. B.; Salwani, I.; Lavaniya, M. Physicochemical characteristics of Malaysian stingless bee honey from Trigona species. IIUM Med. J. Malays. 2018, 17 (1), 187–191.
(25) Kek, S. P.; Chin, N. L.; Yusof, Y. A.; Tan, S. W.; Chua, L. S. Classification of Entomological Origin of Honey Based on its Physicochemical and Antioxidant Properties. Int. J. Food Prop. 2017, 20 (53), 2723–2738.
(26) Pontis, J. A.; Costa, L. A. M. A. D.; Silva, S. J. R. D.; Flach, A. Color, Phenolic and Flavonoid Content, and Antioxidant Activity of Honey from Roraima, Brazil. Food Sci. Technol. 2014, 34 (1), 69–73.
(27) Chen, H.; Tan, C.; Lin, Z. Authenticity Detection of Black Rice by Near-Infrared Spectroscopy and Support Vector Data Description. Int. J. Anal. Chem. 2018, 9 (2018), 8032831.
(28) Richter, K.; Hank, T.B.; Atzberger, C.; Mauser, W. Goodness-of-Fit Measures: What do They Tell About Vegetation Variable Retrieval Performance From Earth Observation Data. In Remote Sensing for Agriculture, Ecosystems, and Hydrology XIII. Int. Society Optics Photonics 2011, 8174, 81740–81741.
(29) Hanrahan, G. Modeling of Pollutants in Complex Environmental Systems. USA: ILM Publications, 2009.
(30) Salleh, N.A.M.; Hassan, M.S. Discrimination of Lard and Other Edible Fats After Heating Treatments Using Partial Least Square Regression (PLSR), Principal Component Regression (PCR) and Linear Support Vector Machine Regression (SVMR). Int. J. Physics: Conference Series 2019, 1366 (1), 12111–12114.
(31) Yuan, X.; Huang, B.; Ge, Z.; Song, Z. Double Locally Weighted Principal Component Regression for Soft Sensor with Sample Selection Under Supervised Latent Structure. Chemom. Intell. Lab. 2016, 153(c), 116–125.
(32) Balabin, R. M.; Safieva, R. Z.; Lomakina, E. I. Comparison of Linear and Nonlinear Calibration Models Based on Near Infrared (NIR) Spectroscopy Data for Gasoline Properties Prediction. Chemom. Intell. Lab. 2007, 88 (2), 183–188.
(33) Yang, H.; Griffiths, P. R.; Tate, J. D. Comparison of Partial Least Squares Regression and Multi-Layer Neural Networks for Quantification of Nonlinear Systems and Application to Gas Phase Fourier Transform Infrared Spectra. Analytica Chimica Acta 2003, 489, 125–136.
(34) Al-Sanabani, D. G. A.; Solihin, M. I.; Pui, L. P.; Astuti, W. Development of Non-Destructive Mango Assessment Using Handheld Spectroscopy and Machine Learning Regression. J. Phys. Conference Series 2019, 1367 (1), 012030.
(35) Singh, I.; Singh, S. Honey Moisture Reduction and Its Quality. J. Food Sci. Tech. 2018, 55 (10), 3861–3871.
(36) El-Bialee, N. M.; Sorour, M. A. Effect of Adulteration on Honey Properties. Int. J. Appl. Sci. Tech. 2011, 1 (6), 122–133.
(37) Wan, N. J.; Azilah, A.; Ahmad, Z. S.; Aishath, N. Physicochemical and Microbiological Analysis of Stingless Bees Honey Collected from Local Market in Malaysia. Indonesia J. Chem. 2019, 19 (2), 522–530.
(38) Damto, T. A Review on Effect of Adulteration on Honey Properties. Soc. Sci. Res. Net. 2019, 1–19.
(39) Chirife, J.; Zamora, M. C.; Motto, A. The Correlation Between Water Activity And % Moisture in Honey: Fundamental Aspects and Application to Argentine Honeys. J. Food Eng. 2006, 72 (3), 287–292.
(40) Shamsudin, S.; Selamat, J.; Sanny, M.; Razak, S. B. A.; Jambari, N. N.; Mian, Z.; Khatib, A. Influence of Origins and Bee Species on Physicochemical, Antioxidant Properties and Botanical Discrimination of Stingless Bee Honey. Int. J. Food Pro. 2019, 22 (1), 239–264.
(41) Yap, S. K.; Chin, N. L.; Yusof, Y. A.; Chong, K. Y. Quality Characteristics of Dehydrated Raw Kelulut Honey. Int. J. Food Prop. 2019, 22 (1), 556–571.
(42) Singh, N.; Bath, P. K. Quality Evaluation of Different Types of Indian Honey. Food Chem. 1997, 58 (1–2), 129–133.
(43) Samat, S.; Enchang, F. K.; Abdullah, A. R.; Hussein, F. N.; Wan, I. W. I. Adulterated Honey Consumption Can Induce Obesity, Increase Blood Glucose Level and Demonstrate Toxicity Effects. Sains Malaysiana 2018, 47 (2), 353–365.
(44) Prieto, N.; Pawluczyk, O.; Dugan, M. E. R.; Aalhus, J. L. A Review of the Principles and Applications of Near-Infrared Spectroscopy to Characterize Meat, Fat, And Meat Products. Appl. Spect. 2017, 71 (7), 1403–1426.
(45) Huang, J.; Romero-Torres, S.; Moshgbar, M. Practical Considerations in Data Pre-treatment for NIR and Raman Spectroscopy. American Pharm. Rev. 2010, 13 (6), 116–127.
(46) Ait-Amir, B.; Pougnet, P.; El Hami, A. Meta-model Development in Embedded Mechatronic Systems. Inter. Soc. Technol. Edu, 2 (second edition), 2020, 157–187.
Lim Lee Ying, Lejaniya Abdul Kalam Saleena, and Pui Liew Phing are with the Department of Food Science and Nutrition at UCSI University, in Kuala Lumpur, Malaysia. Mahmud Iwan Solihin is with the Department of Mechanical Engineering at UCSI University, in Kuala Lumpur, Malaysia. Direct correspondence to: puilp@ucsiuniversity.edu.my and zoepui123@gmail.com.●

NIR Spectroscopy Explored as Sustainable Approach to Detecting Bovine Mastitis
April 23rd 2025A new study published in Applied Food Research demonstrates that near-infrared spectroscopy (NIRS) can effectively detect subclinical bovine mastitis in milk, offering a fast, non-invasive method to guide targeted antibiotic treatment and support sustainable dairy practices.
Smarter Sensors, Cleaner Earth Using AI and IoT for Pollution Monitoring
April 22nd 2025A global research team has detailed how smart sensors, artificial intelligence (AI), machine learning, and Internet of Things (IoT) technologies are transforming the detection and management of environmental pollutants. Their comprehensive review highlights how spectroscopy and sensor networks are now key tools in real-time pollution tracking.
New AI Strategy for Mycotoxin Detection in Cereal Grains
April 21st 2025Researchers from Jiangsu University and Zhejiang University of Water Resources and Electric Power have developed a transfer learning approach that significantly enhances the accuracy and adaptability of NIR spectroscopy models for detecting mycotoxins in cereals.