Portable, High-Efficiency Transmission Raman Spectroscopy for At-Line Content Uniformity Testing of Pharmaceutical Tablets
Special Issues
Portable transmission Raman spectroscopy, combined with chemometric modeling, is quickly emerging as a valued technique for content-uniformity testing, given its high chemical specificity, which is particularly useful when dealing with complex pharmaceutical formulations that contain multiple components.
Content uniformity testing is a crucial task in pharmaceutical manufacturing, as it ensures that each product that reaches a consumer contains safe dosages of all components. Recently, transmission Raman spectroscopy has been explored as an alternative technique for content uniformity testing, due to its ability to rapidly obtain quantitative measurements representative of the whole volume of a tablet. In this case study, test tablets were created from five different blends of acetaminophen, mannitol, lactose, microcrystalline cellulose, and magnesium stearate. A portable Raman spectrometer connected to a high-efficiency transmission module was used to collect calibration spectra. The spectra were then used to create partial least squares (PLS) models for the acetaminophen and lactose components (ranging from 10-18% w/w and 10.79-28.66% w/w, respectively). Chemometric models can be used for prediction of acetaminophen and lactose conventrations in manufactured tablets to perform fast and accurate at-line content uniformity testing with portable Raman transmission spectroscopy.
Content uniformity (CU) testing is a crucial task in pharmaceutical manufacturing, as it ensures that each product that reaches consumers contains a safe dosage of the active pharmaceutical ingredient (API). Traditionally, high performance liquid chromatography (HPLC) is performed off-line in a quality control laboratory to monitor the dosage of finished tablets, due to its sensitivity and the ability to obtain a measurement from the entire volume of the tablet (1,2). However, HPLC analysis is a destructive technique that involves large amounts of solvents and consumables, and often requires highly skilled personnel to perform analyses. Depending on the workload of a QC lab, it may take several hours to complete analyses. Consequently, if a batch is found to be outside of specifications, the process defects leading to the deviation may not be found in a timely manner, potentially causing manufacturing delays for pharmaceutical drugs in heavy demand.
Analytical methods for CU testing should ideally be fast, noninvasive, and with limited sample preparation. Recently, transmission near infrared (NIR) spectroscopy and transmission Raman spectroscopy have both been explored as alternative methods for nondestructive CU testing with no sample preparation (3-7). Although quick and nondestructive, transmission NIR spectroscopy suffers from poor chemical selectivity, and is sensitive to changes in the testing environment. Transmission Raman spectroscopy, combined with chemometric modeling, is quickly emerging as a valued technique for CU testing, due to its high chemical specificity, which is particularly useful when dealing with complex pharmaceutical formulations that contain multiple components.
Conventionally, Raman spectrometers collect backscattered signal that is generated upon illumination of the sample surface with a laser. While conventional Raman spectroscopy is quite suitable for identity tests of incoming raw pharmaceutical materials, it does not provide an accurate quantitative measurement representative of the entire volume of a tablet, nor is it able to probe sufficiently beneath layers of coatings on finished tablets. Transmission Raman spectroscopy, however, is able to overcome the limitations of conventional Raman spectroscopy for content uniformity testing. Using transmission Raman spectroscopy, the sample is illuminated at one side, and the Raman signal is collected from the other side. The signal collected contains photons with information that is representative of the full volume of the tablet. Through the use of chemometric models, an accurate quantitative prediction of the content within the tablet can be achieved. This allows for not only reliable content uniformity testing, but can also assist formulation development and detection of pharmaceutical counterfeits.
Although transmission Raman spectroscopy provides measurements representative of the full volume of a tablet, and is simple to operate with the use of predictive chemometric models, transmission Raman spectroscopy is generally a low- efficiency technique that requires long integration times to obtain sufficient Raman signal. In this case study, we demonstrate proof of concept for CU analysis using a portable Raman spectrometer with a high-efficiency transmission sampling attachment. A series of tablet formulations containing acetaminophen, mannitol, lactose, cellulose, and magnesium stearate were measured on a portable transmission Raman spectrometer. Chemometric models for at-line accurate prediction of acetaminophen and lactose were created using model building software. At-line high-throughput transmission Raman spectroscopy allows for increased efficiency of CU testing, and can quickly catch defects present in the tablet manufacturing process.
Experimental
Samples
Blended powders and pressed tablets were provided by courtesy of the Engineering Research Center for Structured Organic Particulate Systems of the Department of Chemical and Biochemical Engineering at Rutgers University (Piscataway, New Jersey). Formulations were blended with laboratory grade acetaminophen, mannitol, lactose, microcrystalline cellulose (MCC), and magnesium stearate. Five different blends were created. The concentration of acetaminophen in these blends ranged from 10-18% (w/w), and the concentration of lactose ranged from 10.79-28.66% (w/w). Blends were compressed to create round tablets approximately 6 mm in diameter and 4.5 mm thick using a Gamlen tablet press. Tablets were pressed with an approximate force of 392 kg. Each pill had a typical mass of ~140 mg. Ten tablets were manufactured from each blend. Table I lists the concentration of ingredients for all blends.
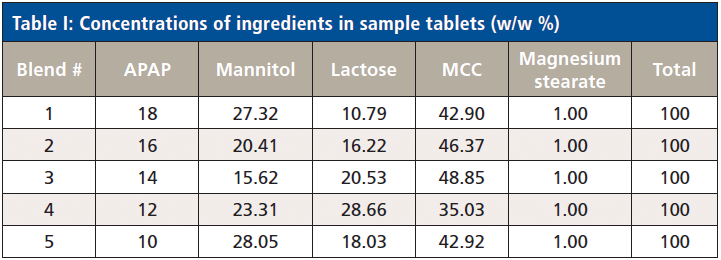
Table I: Concentrations of ingredients in sample tablets (w/w %)
Measurements
The QTRam from B&W Tek with BWAnalyst software was used for all measurements. The QTRam uses a transmission Raman attachment for increased photon efficiency, with a laser spot size of ~4 mm. The system contains a 785 nm laser, with a maximum power of ~340 mW. For method development, method validation, and prediction analyses, all measurements used 100% of the maximum laser power, and a 20 second integration time. Measurements were performed on both sides of the tablets for an accurate representation of the full volume of the tablet. BWIQ software was used to create predictive chemometric models.
Results
Spectral Processing
Seven tablets from each blend were designated as method samples. Triplicate transmission Raman spectra were collected for each sample. Figure 1 shows representative transmission Raman spectra from a tablet containing 18% acetaminophen (Blend 1) and a tablet containing 28.66% lactose (Blend 4), compared to pure acetaminophen and lactose. Spectral regions that correspond to the signal from acetaminophen and the signal from lactose were isolated for chemometric modeling. The spectral regions used in the model are highlighted in blue and gray for lactose and acetaminophen, respectively. The spectral regions of 1190-1300 cm-1 and 1530-1700 cm-1 were isolated in the model spectra because their peaks correspond purely to acetaminophen. Spectral regions of 285-500 cm-1 and 840-890 cm-1 were isolated for lactose because their peaks contain contributions from lactose. Samples from all blends show contributions from both acetaminophen and lactose in these spectral regions. Peaks that were attributed to the other components of the blends were not used in the modeling.
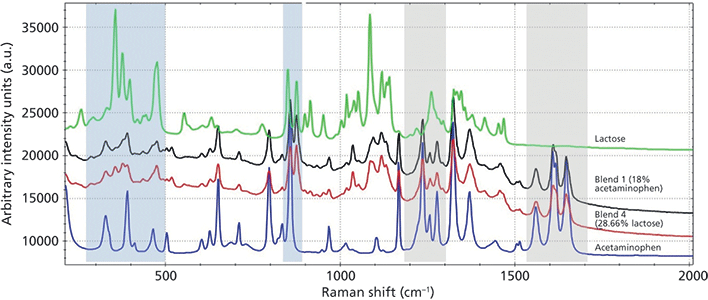
Figure 1: Transmission Raman spectra from two tablet formulation samples compared to acetaminophen and lactose. The blue shaded regions correspond to the areas for lactose modeling. The gray shaded regions correspond to the areas for acetaminophen modeling. Spectra are manually offset.
Chemometric Models
The chemometric software randomly chose 70% of the data as calibration spectra, and designated the remaining 30% as validation spectra. A leverage outlier test found no statistical outliers. Several preprocessing steps were applied to the data in order to minimize background effects and baseline offsets. An adaptive, iteratively reweighted penalized least squares (air-PLS) background removal was used in order to mitigate the background effects from the excipients, and a multiplicative scatter correction (MSC) was used to offset effects from baseline differences. A first derivative (Savitzky-Golay, window 11, order 3) was also applied to the data. Figure 2 shows the method spectra after the applied preprocessing steps. A partial least squares (PLS) regression was chosen to model the data.
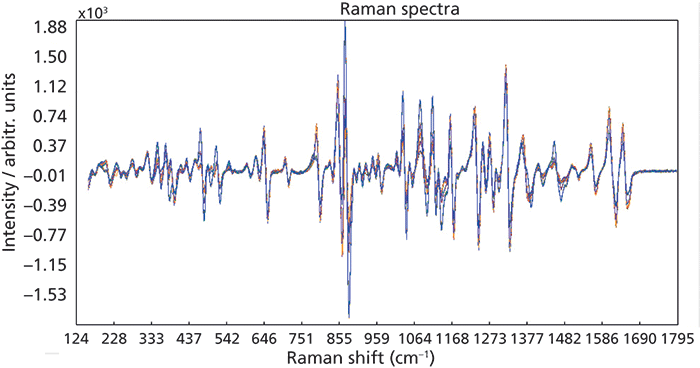
Figure 2: Method spectra after air-PLS background correction, MSC, and Savitzky-Golay first derivative.
Figure 3 shows the plots of the predicted vs. measured values for the acetaminophen and lactose PLS models. Blue samples represent calibration samples, and red samples represent validation samples. Four factors were used in the acetaminophen model, while five factors were used in the lactose model. The R2 coefficient of determination is a measure of how close the data are to the regression line. The R2 value of the calibration spectra for acetaminophen and lactose models were 0.9929 and 0.9915, respectively, indicating good linearity of the models. The root mean square error (RMSE) of the acetaminophen calibration curve was 0.233% and the RMSE of the lactose calibration curve is 0.531%.
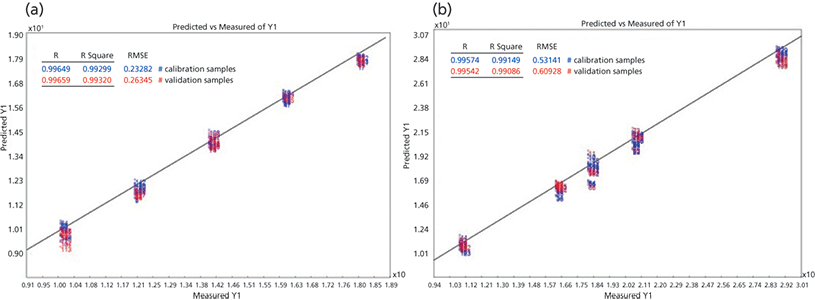
Figure 3: (a) Predicted vs measured plot of the calibration and validation samples for the acetaminophen PLS model. The wavenumber regions used in the model are from 1190-1300 cm-1 and 1530-1700 cm-1. Four factors are used in the model. (b) Predicted vs measured plot of the calibration and validation samples for the lactose PLS model. The wavenumber regions used in the model are from 285-500 cm-1 and 840-890 cm-1. Five factors are used in the model.
Method Validation
Before the method can be released to production for CU analysis, method validation must be completed to make sure that the method is suitable for the tablet CU test. According to USP chapter <1125>, CU testing falls under the analytical category I test, which requires method validation on method specificity, linearity, accuracy, precision and range. For independent method validation, two samples were selected for each blend. Triplicate measurements of each sample were acquired on the spectrometer. The specificity validation was checked using the Mahalanobis distance and Q-residual limit.
Linearity, accuracy, and precision were obtained through the built-in module for method validation. Table II shows the method validation results for the ten validation samples. Both acetaminophen and lactose models show good linearity, with R2 reported as 0.9889 for acetaminophen, and 0.9923 for lactose. Both models also show good precision, with the standard deviations for samples ranging from 0.02-0.17% and 0.13-0.36% for acetaminophen and lactose, respectively. The root mean square error of prediction (RMSEP) was calculated as 0.288% for the acetaminophen model, and 0.504% for the lactose model.
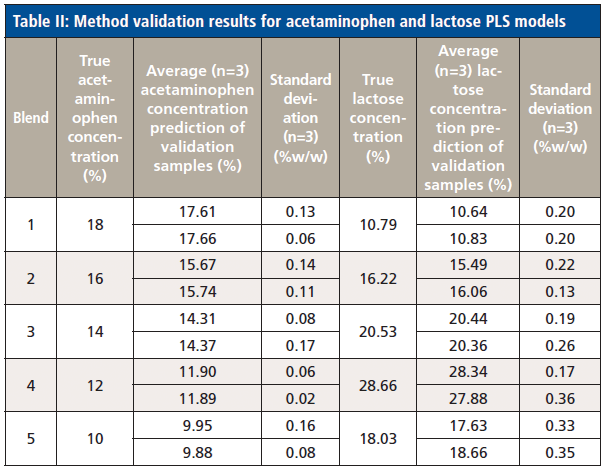
Table II: Method validation results for acetaminophen and lactose PLS models
Prediction
The created chemometric models were used to predict the acetaminophen and lactose contents of new samples in the data analysis software. One tablet per blend was chosen as an independent sample to test the prediction of the acetaminophen and lactose content using the models created. Three spectra were collected for each sample. The prediction results for each tablet are listed in Table III.
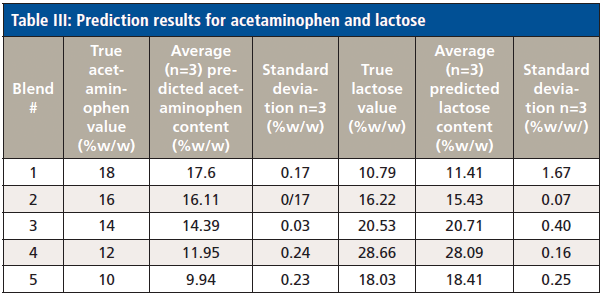
Table III: Prediction results for acetaminophen and lactose
Conclusion
Portable high-efficiency transmission Raman spectroscopy is an effective tool for rapid, at-line content uniformity testing. We demonstrate through a matrix of tablets of varying compositions that portable transmission Raman is able to build methods that can accurately quantitate the acetaminophen and lactose components. As an alternative method of content uniformity testing, portable transmission Raman spectroscopy provides a simple and nondestructive analysis method, with no solvent consumption and no consumables at the point of measurement.
References
(1) I. Yoshida and Y. Sakai, Chem. Pharm. Bull. 47, 678-683 (1999).
(2) B.L. Cohen, J. Chromatogr. Sci.. 25, 202-205 (1987).
(3) N.W. Broad, R.D. Jee, A.C. Moffat and M.R. Smith, Analyst. 126, 2207–2211 (2001).
(4) C. Peroza Meza, M. A. Santos, and R. J. Romañach, AAPS PharmSciTech. 7, E206– E214 (2006).
(5) M.D. Hargreaves, N. A. Macleod, M.R. Smith, D. Andrews, S.V. Hammond, and P. Matousek, J. Pharm. Biomed.Anal. 54, 463–468 (2011).
(6) D. Andrews, K. Geentjens, B. Igne, G. McGeorge, A. Owen, N. Pedge, J. Villaumié, and V. Woodward, Journal of Pharmaceutical Innovation 13, 121-132 (2018).
(7) M. Fransson, J. Johansson, A. Sparén and O. Svensson, J. Chemom. 24, 674-680 (2010).
Kristen Frano, John Maticchio, and Dawn Yang are with B&W Tek in Newark, DE. Direct correspondence to: dawny@bwtek.com

LIBS Illuminates the Hidden Health Risks of Indoor Welding and Soldering
April 23rd 2025A new dual-spectroscopy approach reveals real-time pollution threats in indoor workspaces. Chinese researchers have pioneered the use of laser-induced breakdown spectroscopy (LIBS) and aerosol mass spectrometry to uncover and monitor harmful heavy metal and dust emissions from soldering and welding in real-time. These complementary tools offer a fast, accurate means to evaluate air quality threats in industrial and indoor environments—where people spend most of their time.
NIR Spectroscopy Explored as Sustainable Approach to Detecting Bovine Mastitis
April 23rd 2025A new study published in Applied Food Research demonstrates that near-infrared spectroscopy (NIRS) can effectively detect subclinical bovine mastitis in milk, offering a fast, non-invasive method to guide targeted antibiotic treatment and support sustainable dairy practices.
Smarter Sensors, Cleaner Earth Using AI and IoT for Pollution Monitoring
April 22nd 2025A global research team has detailed how smart sensors, artificial intelligence (AI), machine learning, and Internet of Things (IoT) technologies are transforming the detection and management of environmental pollutants. Their comprehensive review highlights how spectroscopy and sensor networks are now key tools in real-time pollution tracking.