Portable Transmission FTIR Analysis of Volatile Samples Using the DialPath Liquid Cell
Spectroscopy
Traditionally the analysis of volatile liquids by FTIR spectroscopy has always entailed a sealed fixed pathlength cell.
Traditionally the analysis of volatile liquids by FTIR spectroscopy has always entailed a sealed fixed pathlength cell. This technique is widely used for quantitative analysis of analytes in volatile solvents with applications in the fuel, chemical, and pharmaceutical industries. Use of sealed cells requires a skilled user to add the sample to the cell by syringe, taking great care to avoid air bubbles or incomplete filling of the cell. Improper filling can also cause damage to sealed cells by breaking the window or amalgam seal with excess pressure. These cells are also prone to internal reflections that cause significant spectral artifacts called "fringing" and baseline noise features from improper cell fitment into the spectrometer. These drawbacks lead to methods developed with less precision and accuracy, limiting the utility of the analysis. A2 Technology's patented Dialpath™ liquid cell systems are simple to both fill and clean, eliminate spectral artifacts and still provide precise and accurate sample measurement for volatile samples and solvents.
In this application brief, we will demonstrate that the open cell design of the DialPath technology is effective with samples that contain either volatile solutes and/or volatile solvents. The study will illustrate that evaporation does not change the sample concentration, during typical measurement times on the ML analyzer. The experiments in this work were designed to determine the effect of evaporation on quantitative measurements using the TumblIR liquid cell. The results of two experiments, which test the effects of evaporation and diffusion on calibrated methods for dioctyl phthalate (DOP, non-volatile analyte) in tetrahydrofuran (THF, volatile solvent) and benzene (highly volatile analyte) in hexane (volatile solvent), are presented.
Results
Analytical standards of dioctylphthalate (DOP) in THF were prepared volumetrically in the 0–5% range, and the FTIR spectra collected on a ML FTIR analyzer with DialPath Technology. The spectra of the standards were measured in triplicate collecting 64 scans at 8 cm-1 resolution, yielding an 18 s scan time. A quantitative calibration was developed using partial least squares (PLS) modeling of the DOP ester absorbance region; two loading vectors were used. The standard error of cross validation (SECV) for this method was 0.012% DOP; the actual versus predicted correlation coefficient (R2 ) was 0.9999. This method is loaded into the A2 Technologies MicroLab PC software.
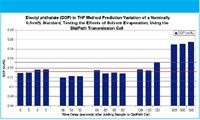
Samples of DOP in THF at 0.5% nominal concentration were prepared volumetrically. The samples were prepared with low volumes for convenience and are only meant to test the repeatability of the instrument and method. The 0.5% sample was measured with the same method parameters (18 s scan time) with increasing delays from sample introduction to the start of scanning. Each sample was introduced with the cell in the closed position using plastic transfer pipettes (the solvent wicks into the cell very easily) and the cell was completely filled (~250 µL). Since the solvent is the volatile component, the effects due to evaporation would increase the DOP concentration. Figure 1 shows the replicate measurements of samples 0, 30, 60, 120, and 300 s delay. The mean value for the 0 s delay is plotted as the red line and the 2% error limits are plotted as the two purple lines. The measured DOP concentration didn't exceed the 2% relative error until the 300 s delay time was reached. Even at a 2 min delay, little effect of the evaporation can be observed. Clearly, evaporation poses no issues to these measurements using the DialPath sample interface with measurement times of up to 2 min.

Figure 1: The DOP vol% results from replicate measurements at increasing delays from sample introduction to DialPath cell and sample scan initialization. The red line is the mean measured DOP concentration with no time delay, and the ±2% relative error from mean time 0 is shown as purple lines.
The second experiment involves a volatile solvent (hexane) and a highly volatile solute (benzene), and represents the worst case scenario for evaporation effects on quantitative analysis. A PLS model was created using the benzene ring in-plane bend absorbance at 670 cm-1 . The model used one loading vector, had an SECV of 0.0076% benzene and the actual versus predicted had a correlation of 0.996. A nominal 0.5% benzene in hexane sample was prepared and used to test the repeatability at 0, 45, and 60 s delay between sample introduction and measurement. Figure 2 shows the results of each measurement as well as the average value of the 0 s delay samples as the red line and the 2% relative error levels as the orange line. Only a single measurement of the 60 s delay showed greater than 2% relative error. These results indicate that analysis times of up to 60 s have no appreciable affect on measurement accuracy, even for highly volatile samples.

Figure 2: The benzene vol% results from replicate measurements at increasing delays from sample introduction to the DialPath cell and sample scan initialization (18 s). The red line is the mean measured benzene % concentration with no time delay, and the ±2% relative error from mean time 0 is shown as purple lines.
Due to the A2 Technologies fast scanning FTIR technology and the much slower rate of diffusion, there is no observed effect of evaporation in the normal 18–45 s scan time used for DialPath methods. The shape and configuration of the DialPath cell, Figure 3, also minimizes the effects of evaporation. The 100 µm pathlength active region between the top and bottom cell window is filled with only 5 µL of solvent, whereas the typical total fill volume for the cell is 250 µL. This large difference between sampled and bulk cell volume, coupled with the distance that the diffusion gradient has to travel before reaching the inner sampling region, explains why there are no significant effects of solvent or solute diffusion or evaporation observed using the DialPath cell.

Figure 3: The iPAL FTIR spectrometer equipped with the TumblIR cell (left) and the expanded sample interface region of the cell (right). The relatively small "active region" (5 µL fill area) in proportion to the total filled cell volume minimizes the effects of evaporation and diffusion in the 18-45 s time scale.
Conclusions
This application note has shown that there is no effect on the accuracy or precision of quantitative methods when measuring samples with volatile solvents or analytes on the TumblIR or Dialpath transmission cells. No effect was seen with methods up to 60 s in length; the PAL spectrometer can measure 140 scans in 60 s at 4 cm-1 resolution. The ease of use and simplicity of the TumblIR technology makes it ideal for many liquid applications including gasoline, ethanol, reaction monitoring, or solvent extraction. The precision of the TumblIR along with the lack of interference fringing and baseline effects provides methods with better accuracy than previously obtainable using infrared spectroscopy.

A2 Technologies
14 Commerce Drive, Danbury, CT 06810
tel. (203) 312-1100; Fax (203) 312-1058
Website: www.a2technologies.com

Thermo Fisher Scientists Highlight the Latest Advances in Process Monitoring with Raman Spectroscopy
April 1st 2025In this exclusive Spectroscopy interview, John Richmond and Tom Dearing of Thermo Fisher Scientific discuss the company’s Raman technology and the latest trends for process monitoring across various applications.
A Seamless Trace Elemental Analysis Prescription for Quality Pharmaceuticals
March 31st 2025Quality assurance and quality control (QA/QC) are essential in pharmaceutical manufacturing to ensure compliance with standards like United States Pharmacopoeia <232> and ICH Q3D, as well as FDA regulations. Reliable and user-friendly testing solutions help QA/QC labs deliver precise trace elemental analyses while meeting throughput demands and data security requirements.