Supplementary Section: Purity Analysis of Adulterated Essential Oils by FT-IR Spectroscopy and Partial-Least-Squares Regression
The peppermint oil results are presented in this supplementary section.
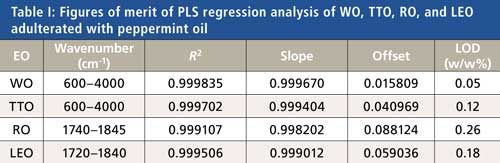
The peppermint oil results are presented in this supplementary section. This section includes Figures 1–4 and Table I.


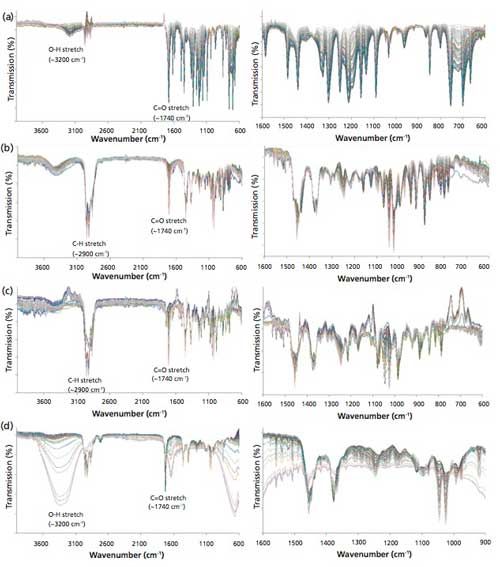
Figure 1 (web): FT-IR spectra of calibration samples of (a, left) WO, (b, left) TTO, (c, left) RO, and (d, left) LEO. Cross sections of FT-IR spectra of (a, right) WO, (b, right) TTO, (c, right) RO, and (d, right) LEO adulterated with peppermint oil. (Peppermint oil adulteration ranged between 1% and 90% [wt/wt].)


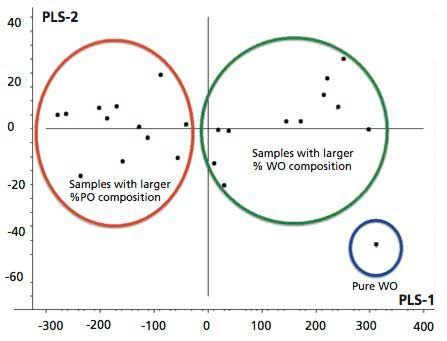
Figure 2 (web): Typical score plot of PLS-1 regression of WO adulterated with peppermint oil.


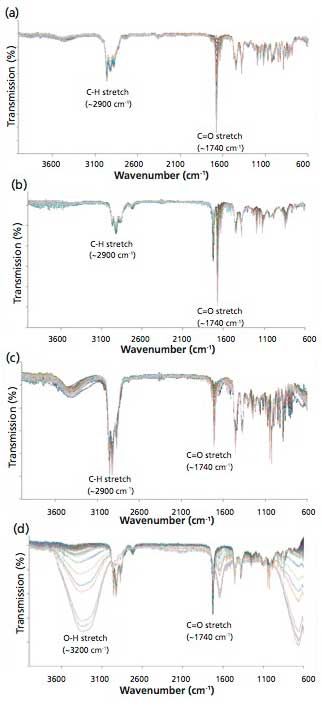
Figure 3 (web): FT-IR spectra of independent validation samples of (a) WO, (b) TTO, (c) RO, and (d) LEO adulterated with with peppermint oil.


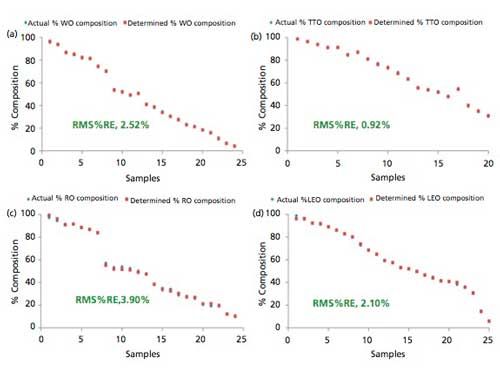
Figure 4 (web): Plots of actual and determined percent composition of independent validation samples of (a) WO, (b) TTO, (c) RO, and (d) LEO adulterated with peppermint oil.


Best of the Week: AI and IoT for Pollution Monitoring, High Speed Laser MS
April 25th 2025Top articles published this week include a preview of our upcoming content series for National Space Day, a news story about air quality monitoring, and an announcement from Metrohm about their new Midwest office.


LIBS Illuminates the Hidden Health Risks of Indoor Welding and Soldering
April 23rd 2025A new dual-spectroscopy approach reveals real-time pollution threats in indoor workspaces. Chinese researchers have pioneered the use of laser-induced breakdown spectroscopy (LIBS) and aerosol mass spectrometry to uncover and monitor harmful heavy metal and dust emissions from soldering and welding in real-time. These complementary tools offer a fast, accurate means to evaluate air quality threats in industrial and indoor environments—where people spend most of their time.


