Quantifying Ethanol Concentration in Hand Sanitizer via Automation

The concentration of ethanol in hand sanitizer was determined using a calibration developed with an automated ATR sampling accessory.
Ethanol-based hand sanitizers have been used to hamper the spread of infectious diseases for decades, especially by healthcare providers. More recently, in response to the COVID-19 pandemic, hand sanitizers have become a popular household item and are now being used routinely by the general public. To effectively destroy viruses such as SARS-CoV-2, the concentration of ethanol must be greater than 60% in volume.
Fourier transform infrared (FT-IR) spectroscopy with attenuated total reflectance (ATR) requires no sample preparation and is an ideal way to determine the concentration of ethanol in a popular hand sanitizer. Here we created a calibration curve from prepared standards, using the PIKE Technologies’ AutoATR—an automated 24-well plate accessory that is designed for rapid calibration development and validation.
Experimental Methods
Ethanol standards were prepared with 99.5% anhydrous ethanol at concentrations of 0.00, 50.00, 75.00, 79.17, 85.00, and 90.00% ethanol (v/v). Each solution was covered and allowed to degas while thoroughly mixing.
FT-IR spectra were collected on a commercial FT-IR spectrometer equipped with a DLaTGS detector, and using the AutoATR sampling accessory. Then, 32 scans were co-added and the spectral resolution was 4 cm-1 . The PIKE AutoPRO7 software was used to control the X-Y stage of the accessory and to signal the FT-IR instrument to collect each background at each sample position prior to the introduction of the sample aliquots. After background collection was complete, sample aliquots were distributed into the 24-well ATR microtiter tray, and covered with an airtight seal to prevent evaporation of ethanol and water within each well. Each sample spectrum was collected and a transmittance spectrum was automatically calculated using its corresponding well-specific background spectrum, as directed by AutoPRO7.
Results
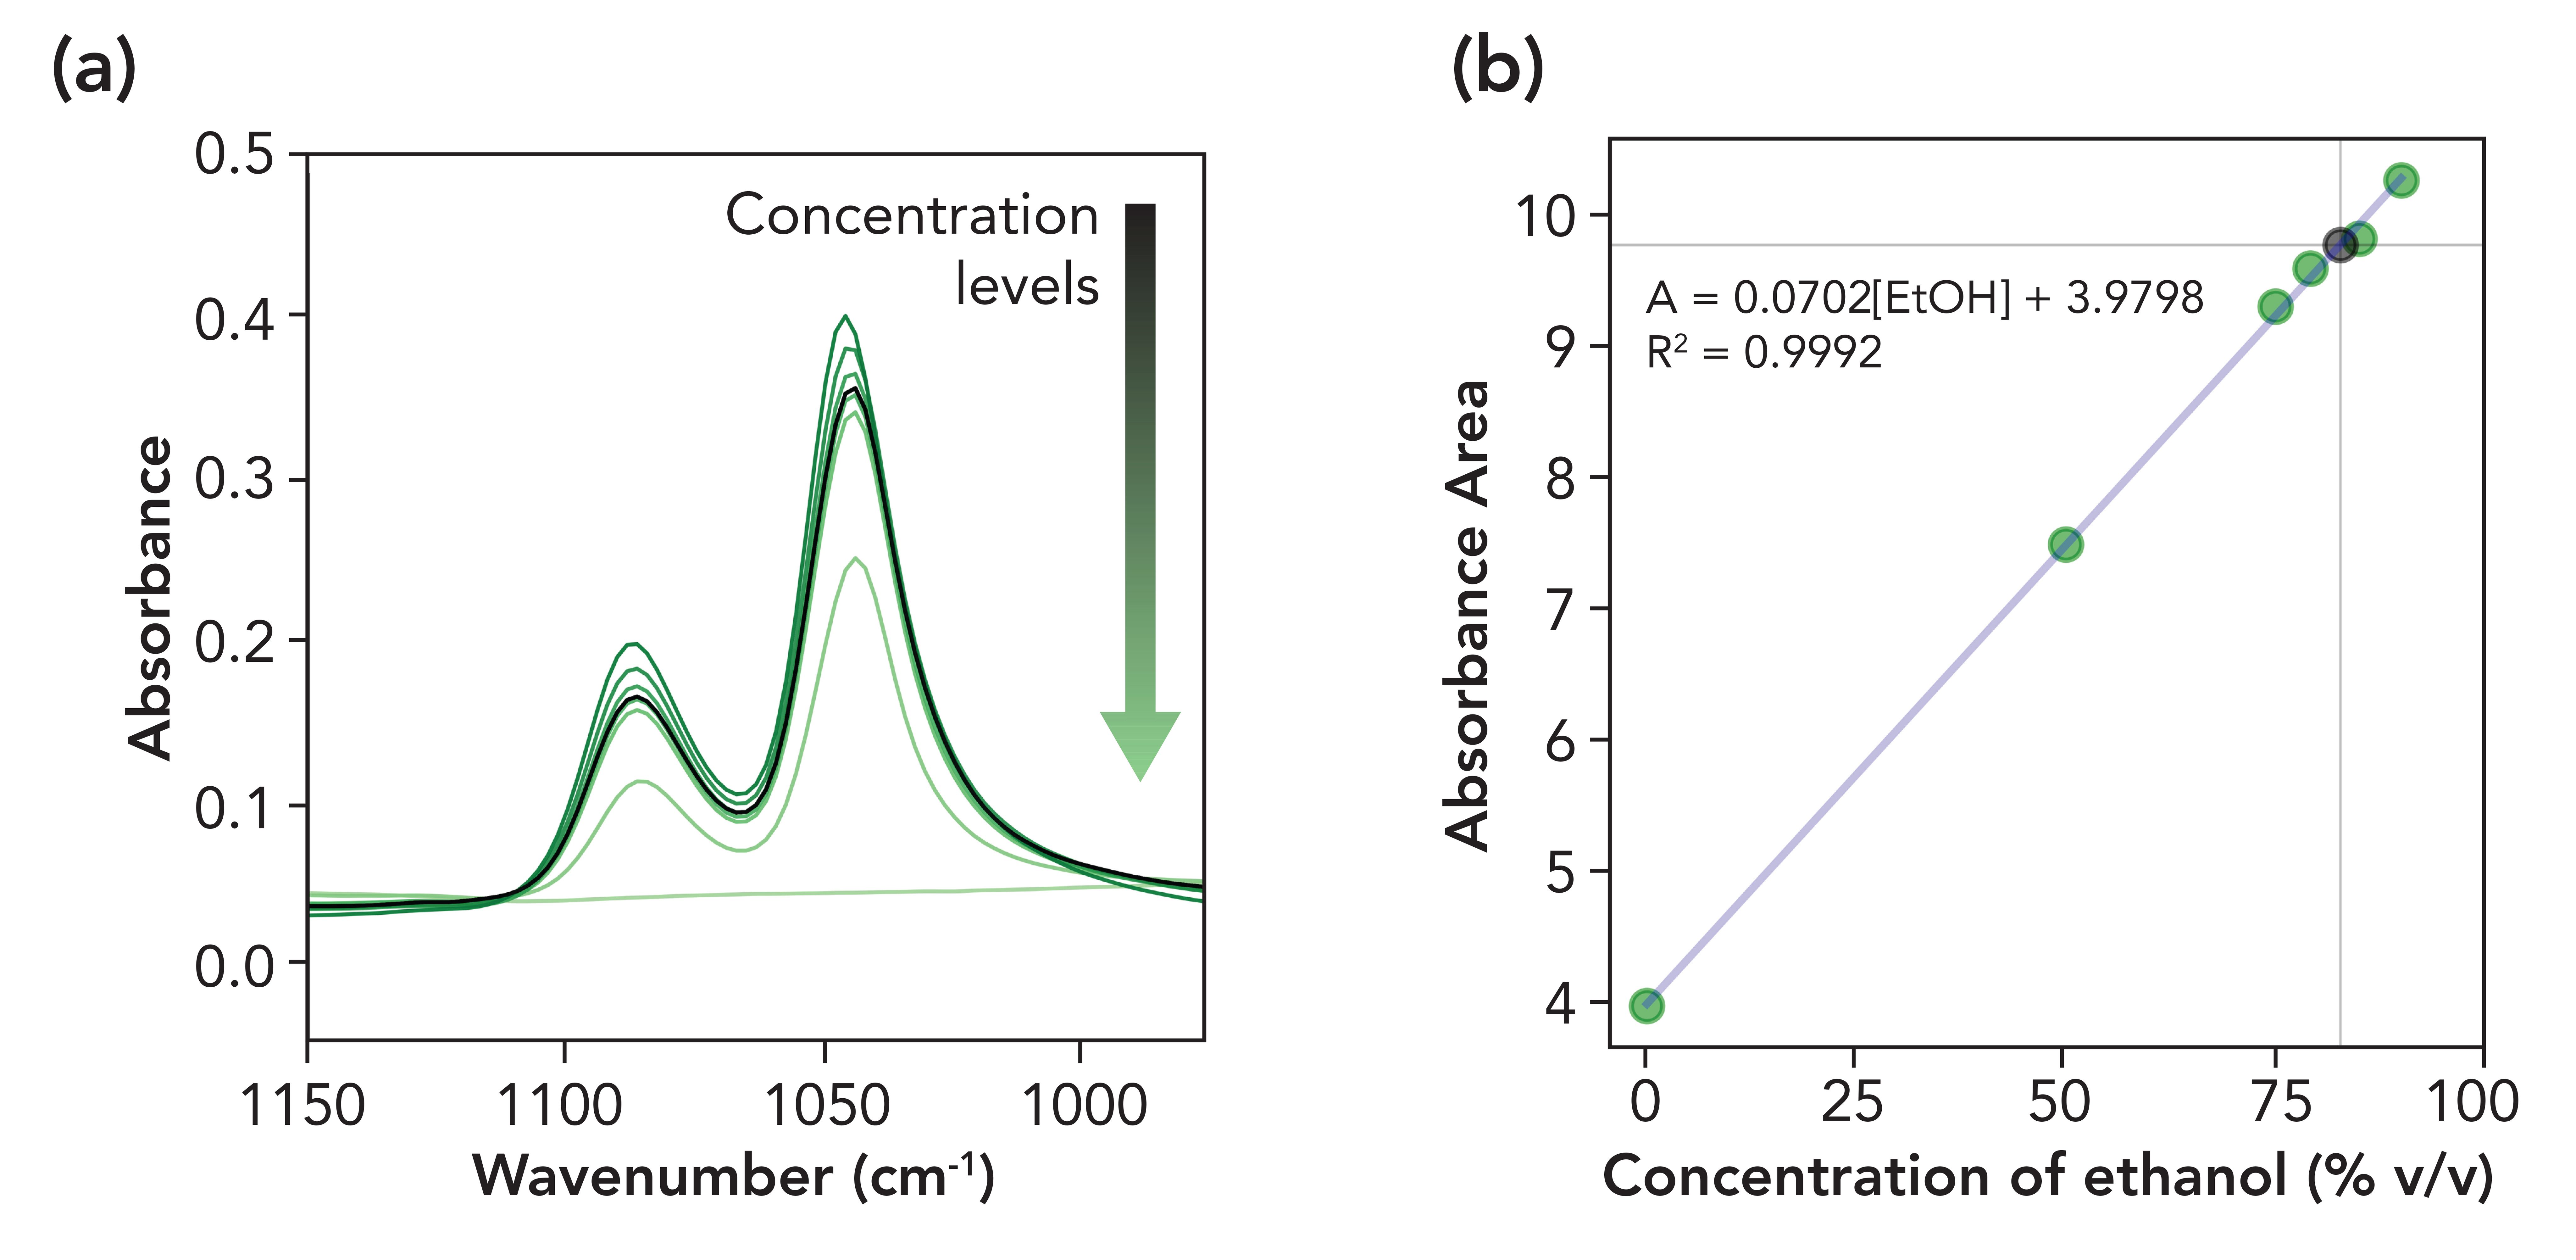
The two prominent ethanol spectral bands located near 1045 and 1087 cm-1 , corresponding to C–O stretch modes, were analyzed (Figure 1a). The calculated area across the 975−1150 cm-1 spectral region of each standard solution was used to generate a calibration plot. A linear regression of the calibration series exhibiting an R2 = 0.9992 was then used to determine the %ethanol (v/v) of a popular ethanol-based hand sanitizer. Based on the linear regression equation shown in Figure 1b, the %ethanol (v/v) of the tested hand sanitizer was determined to be 82.7%.
Figure 1: (a) Absorbance spectra of ethanol/water standards (green lines) and the analyzed hand sanitizer (black line). (b) Calibration plot showing the area of the absorbance bands of ethanol (green markers) with the absorbance area of the hand sanitizer shown by the black marker.

Implementing automation in the laboratory offers an opportunity to increase laboratory efficiency by significantly decreasing calibration-and-validation development time. In the case of the AutoATR, up to 24 samples in a single run may be analyzed with high reproducibility and speed, resulting in high-quality spectra.
Conclusion
To effectively combat pathogens like SARS-CoV-2, manufacturers of hand sanitizers must determine the concentration of components in mixtures. The AutoATR makes these spectroscopic analyses easy and efficient by speeding the calibration development and model validation, while allowing for rapid sample data collection.
PIKE Technologies, Inc.
6125 Cottonwood Drive, Madison, WI 53719
tel. (608) 274-2721
Website: www.piketech.com

A Proposal for the Origin of the Near-Ubiquitous Fluorescence in Raman Spectra
February 14th 2025In this column, I describe what I believe may be the origin of this fluorescence emission and support my conjecture with some measurements of polycyclic aromatic hydrocarbons (PAHs). Understanding the origin of these interfering backgrounds may enable you to design experiments with less interference, avoid the laser illuminations that make things worse, or both.