Raman Chemical Imaging of Explosive Contaminated Fingerprints for Forensic Applications
The use of explosive devices by terrorist groups has become a constant threat in recent years. Because of this threat, the U.S. Army and other organizations are developing spectroscopic techniques to detect explosives and perform forensic examination of scenes where explosives were handled. In our group, Raman chemical imaging (RCI) is being used for forensic examination of latent fingerprints contaminated with traces of explosives. RCI has the potential to be a powerful technique both for detecting explosives and providing the biometric information necessary to identify individuals who have handled explosives.
Due to the widespread proliferation of explosives used by terrorist and insurgent groups, there has been a rapid expansion in research aimed at detecting energetic materials. Organizations, such as the U.S. Army, are conducting this research to combat the threat of improvised explosive device (IED) attacks in Iraq and Afghanistan, while the Department of Homeland Security is concerned with preventing terrorist attacks with explosives here at home. The recent attempted attack on Northwest Airlines Flight 253, as well as the surge of attacks in Afghanistan indicate that the problem is not going to subside soon. A wide variety of techniques are being explored to tackle this challenging problem, with the majority of these efforts aimed at developing predetonation warning systems and forensic examination of surfaces where explosives might be present. One example of the latter is the examination of fingerprints that are contaminated with explosives particles to identify the explosives present and also obtain biometric data (ridge patterns). Spectroscopic examination of trace contaminants in fingerprints could also have other law-enforcement applications, such as counternarcotics operations and nearly identical implementation.
Conventional forensic analysis of fingerprints mainly focuses on the ridge patterns themselves. However, a few different techniques have been explored to obtain both ridge patterns and chemical identification of substances present in the fingerprint with a single instrument. Infrared spectroscopy, in particular, has been explored by several groups with some success (1). However, there are several drawbacks to some of these IR techniques. Techniques using attenuated total reflectance (ATR) spectroscopy require direct physical contact with the sample, potentially damaging or cross-contaminating the sample. More conventional IR reflection techniques can have difficulty discriminating the sample on rough surfaces or substrates with high porosity, such as paper. Their sensitivity can also suffer due to strong background interference from the substrate. Other techniques such as micro X-ray fluorescence have also been explored with some success for imaging of latent fingerprints using trace elements such as potassium and chlorine present in the deposited material (2).
We have been using Raman chemical imaging (RCI) microscopy to examine fingerprints contaminated with traces of explosives (3). Raman spectroscopy is a powerful technique in that chemical detection is highly specific for allowing the differentiation between different types of molecules. The Raman spectrum serves as a type of molecular "fingerprint" for the substance being investigated. Numerous groups have measured the Raman spectra of many different explosives in order to provide reference data. These measurements have included multicomponent samples, such as plastic explosives, as well as traces of explosives on clothing and fingernails (4,5). One difficulty with using Raman spectroscopy for chemical detection is that the signal levels, determined by the Raman cross section, are generally quite small (typically on the order of 10–30 cm2). However, with modern spectrometers, it is possible to obtain usable spectra from particles with dimensions on the order of a few micrometers. Additionally, different techniques have been explored to try to enhance the signal levels, such as surface-enhanced Raman spectroscopy and ultraviolet resonance Raman spectroscopy.
Experimental Conditions
In our work, explosive-laced fingerprints were deposited on aluminum-coated microscope slides (3). A finger was pressed against a small sample of explosive powder and subsequently pressed against the slide. Aluminum-coated slides were chosen for these initial proof-of-principle studies since they have negligible levels of background fluorescence. The fingerprints were then examined by conventional brightfield microscopy for the presence of tiny particles in the fingerprint. These particles can then be focused in on using Raman chemical imaging to determine their chemical makeup. Different techniques can be used to perform chemical imaging. In a point mapping system, a laser beam is tightly focused on a sample, which is then moved in a raster pattern to obtain spectra from many different points. These spectra are then assembled into a "hyperspectral" cube, which is a three-dimensional block of data containing the intensity of the Raman scattered light obtained as a function of x and y position, as well as the Raman shift in wavenumbers. Alternatively, the global imaging technique can be used as well to obtain the same set of information. In global imaging, the laser beam is defocused to illuminate a larger area of the sample. A special filter then selects a Raman shift band, which is imaged onto a camera. The filter is then tuned through the entire wavenumber shift range of interest and a spectrum can be obtained from each position on the sample.
In the present studies, the global Raman imaging technique was used. The measurements were performed using a Falcon II Raman chemical imaging microscope (ChemImage, Pittsburgh, Pennsylvania). A 532-nm laser was used to illuminate an area of the fingerprint through a microscope objective. Raman scattered light was collected back through the same objective and sent through a liquid crystal tunable filter (LCTF). The LCTF was used to select a particular Raman shift band for imaging on a CCD camera. Spectra could then be assembled for each point on the sample. The bandwidth of the LCTF is approximately 10 cm-1, giving moderate spectral resolution. Fingerprints were examined using microscope objectives ranging from 5×–20× magnification with laser power density levels incident on the samples ranging from 35–500 W/cm2. Each RCI hyperspectral cube required approximately 70 min to acquire. In addition to performing Raman spectroscopy, fluorescence chemical imaging can also be done. Excitation of fluorescence in samples is done using 365-nm wavelength light from a mercury lamp, and the broadband fluorescence was measured from 400 to 720 nm.
Results
To determine if explosives were present in the fingerprints measured, the resulting spectra were compared to library spectra of pure samples of explosives. The library spectra of skin fragments, fingerprint oil, and selected explosives (RDX, HMX, PETN, and ammonium nitrate) are shown in Figure 1. The fingerprint oil and skin fragments were found to be relatively poor Raman scatterers compared to the explosives. The explosives were obtained either in standard solution of 1 mg/mL in solvent from Restek, Inc. (Bellefonte, Pennsylvania), or in powdered form from the U.S. Army Edgewood Chemical Biological Center. As can be seen, there are significant differences in the spectra that can be used to differentiate between the explosives. The chemical structures of these explosives are shown in Figure 2. The comparison between the spectra of material in the fingerprint and the library spectra was done using Pearson's cosine cross-correlation, which is a measure of the similarity of two spectra (3,6). This technique considers the spectra to be vectors in an n-dimensional (where n is the number of wavenumber steps) space and calculates the cosine of the angle between these two vectors. A value of Rmicroscope objective and2 is obtained that ranges between 0 and 1, with 1 indicating perfect correlation between the two spectra and 0 indicating no correlation. The value of 1 corresponds to parallel vectors, while 0 corresponds to perpendicular vectors. Each spectrum from a pixel in the RCI is compared to a previously established library of spectra of pure explosives. For those explosives where the value of R2 exceeded a set threshold (here set at 0.5), that particular explosive was considered to be present. False-color images can then be obtained where the brightness of a particular color indicates the level of correlation between the spectrum of that particular pixel and the library spectrum of an explosive.
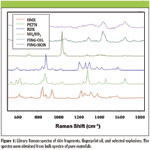
Figure 1
An example of this type of analysis is shown in Figure 3. A group of particles is shown in the brightfield image in Figure 3a that was identified for further examination. These images were acquired with the 50× microscope objective and cover an area of about 30 μm on a side. There are several particles present that are likely skin fragments. A fluorescence image is shown in Figure 3b and most of the larger particles present fluoresce to various degrees. Figure 3c shows the RCI, while Figure 3d shows an overlay of the RCI on the brightfield image. In the RCI in Figure 3c, a particle of the explosive RDX was found to be present. Additionally, the particles showed some isolated pixel matches with the library spectrum for both skin fragments and fingerprint oil. However, due to the generally weak scattering from fingerprint oil and skin fragments, the pattern formed by false coloring identified pixels is rather sparse. In Figure 3b, the large particles fluoresce rather strongly as well, like many biological samples. In comparison the RDX particle fluoresces less, since pure RDX does not have absorption bands in the wavelength region of the fluorescence excitation.
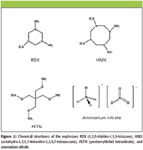
Figure 2
This example shows the powerful discrimination capability of RCI. Despite the fact that the explosive particle was adjacent to larger fragments of skin tissue, it was still possible to positively identify the explosive as being present. It would not be possible to obtain this information simply from the fluorescence or brightfield images alone, as there is, in general, no way to distinguish between the different types of particles, and often the explosive particles are buried under or are resting on top of residue from the fingerprint. This ability to discriminate between different chemicals will prove even more important in field applications, since the fingerprints are likely to be contaminated by dirt, dust, and other materials in the environment, which would likely lead to complex and heterogeneous background spectra.
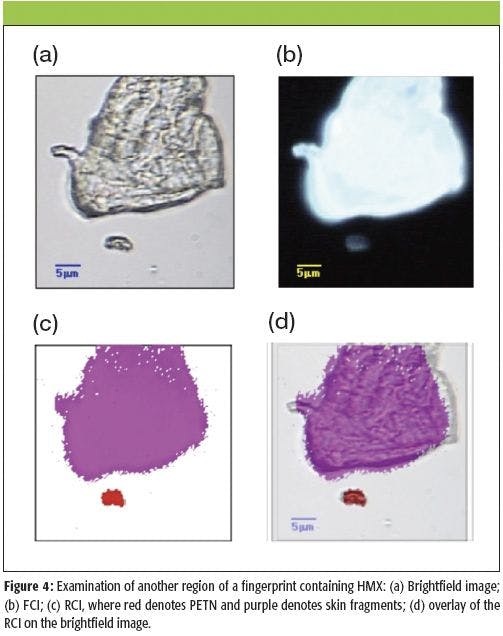
Another example of an explosive-contaminated fingerprint is shown in Figure 4. These images were again acquired with the 50× objective. This fingerprint was contaminated with a small amount of HMX. A brightfield image is shown in Figure 4a, while the FCI is shown in Figure 4b. The RCI is shown in Figure 4c. In the RCI, purple denotes skin fragments, while red denotes the presence of HMX. An overlay of the RCI on the brightfield image is shown in Figure 4d. The large particle fluoresces very strongly, which indicates that it is very likely a fragment of skin. Indeed, in this case the cosine cross-correlation is able to distinctly identify the presence of the skin fragment from its Raman spectrum. A small particle of the explosive HMX is also detected below the larger skin fragment. In comparison with the skin fragment, the HMX particle fluoresces significantly less strongly, since pure HMX has no absorption bands at the wavelength of the fluorescence band excitation.
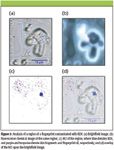
Figure 3
In addition to attempting to detect the presence of explosives in fingerprints, we have also been working on imaging the fingerprint ridges themselves. Figure 5 shows a preliminary laser-induced fluorescence image of a fingerprint. This image was obtained on a point-mapping Raman chemical imaging system (JASCO NRS-3100, Easton, Maryland). The sample was excited with a 532-nm laser and the integrated fluorescence was plotted to give the FCI in Figure 5. The fingerprint ridge pattern is observable, but somewhat noisy. We are continuing this work to obtain higher-quality images.
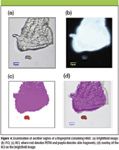
Figure 4
Conclusions
Significant challenges remain with developing a field-portable Raman spectroscopic system for analyzing fingerprints. Our work has been performed using surfaces with low levels of background interference, such as aluminum-coated slides. It will be more difficult, however, to detect fingerprint deposits on surfaces that have significant levels of fluorescence and Raman scattering, such as plastics. We are currently working on extending our measurements to these more challenging surfaces by subtracting the interfering spectral contributions from the substrate. Additionally, we are improving the quality and spatial resolution of Raman chemical images of the fingerprint ridge patterns themselves. This is difficult due to the relatively large area of a fingerprint, on the order of 1 cm2 , and the fairly low levels of scattering from these materials. Most Raman chemical imaging studies to date focus on much smaller areas, however, making montages of images allows an extension to larger areas. Optimizing the density of the pixels in the RCI, as well as the spectral resolution will be important for obtaining a usable image in as short of a time as possible.
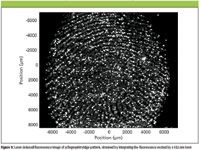
Figure 5
Technical challenges also exist for applying Raman spectroscopy to fingerprint analysis in the field. Typical Raman microscopy systems are large pieces of equipment that are not portable and can require several hours to acquire chemical images. New technologies may reduce the time required to obtain these images, such as fiber-assisted Raman chemical imaging. A combination of fluorescence imaging and Raman spectroscopy may also prove useful in forensic examination of fingerprints. Often samples emit more light due to fluorescence from impurities than from Raman scattering. This emission is not very specific for identifying samples, but may be sufficient in many cases for imaging a fingerprint ridge pattern. This fluorescence emission could be used to image the fingerprint, for example, while Raman scattered light, with the associated information it carries about chemical identity, could be used to identify the presence of explosives. With further technological advances, it may be possible to develop such a system to aid the forensic community.
Acknowledgments
Funding for this work was partially provided by the Joint IED Defeat Organization and the Research and Technology Directorate, ECBC. This research was performed while E.D. Emmons held a National Research Council Research Associateship Award at the U.S. Army Edgewood Chemical Biological Center. Opinions, interpretations, conclusions, and recommendations are those of the authors and are not necessarily endorsed by the United States Government.
Erik D. Emmons is with the National Research Council at the Research and Technology Directorate, Edgewood Chemical Biological Center, Aberdeen Proving Ground, Maryland. Ashish Tripathi is with Science Applications International Corporation, Aberdeen Proving Ground, Maryland. Jason A. Guicheteau, Steven D. Christesen, and Augustus W. Fountain III are with the Research and Technology Directorate, Edgewood Chemical Biological Center, Aberdeen Proving Ground, Maryland.
References
(1) P.H.R. Ng, S. Walker, M. Tahtouh, and B. Reedy, Anal. Bioanal. Chem. 394(8), 2039 (2009).
(2) C.G. Worley, S.S. Wiltshire, T.C. Miller, G.J. Havrilla, and V. Majidi, J. Forensic Sci. 51(1), 57 (2006).
(3) E.D. Emmons, A. Tripathi, J.A. Guicheteau, S.D. Christesen, and A.W. Fountain, Appl. Spectrosc. 63(11), 1197 (2009).
(4) E.M.A. Ali, H.G.M. Edwards, M.D. Hargreaves, and I.J. Scowen, J. Raman Spectrosc. 40(2), 144 (2009).
(5) E.M.A. Ali, H.G.M. Edwards, and I.J. Scowen, Talanta 78(3), 1201 (2009).
(6) A. Tripathi, R.E. Jabbour, J.A. Guicheteau, S.D. Christesen, D K. Emge, A.W. Fountain, J.R. Bottiger, E.D. Emmons, and A.P. Snyder, Anal.Chem. 81(16), 6981 (2009).

Nanometer-Scale Studies Using Tip Enhanced Raman Spectroscopy
February 8th 2013Volker Deckert, the winner of the 2013 Charles Mann Award, is advancing the use of tip enhanced Raman spectroscopy (TERS) to push the lateral resolution of vibrational spectroscopy well below the Abbe limit, to achieve single-molecule sensitivity. Because the tip can be moved with sub-nanometer precision, structural information with unmatched spatial resolution can be achieved without the need of specific labels.
AI-Powered SERS Spectroscopy Breakthrough Boosts Safety of Medicinal Food Products
April 16th 2025A new deep learning-enhanced spectroscopic platform—SERSome—developed by researchers in China and Finland, identifies medicinal and edible homologs (MEHs) with 98% accuracy. This innovation could revolutionize safety and quality control in the growing MEH market.

.png&w=3840&q=75)

.png&w=3840&q=75)


.png&w=3840&q=75)


.png&w=3840&q=75)

