Raman Microscopy for Detecting Counterfeit Drugs — A Study of the Tablets Versus the Packaging
Spectroscopy
Results of tablet matching measurements and characterization of packaging are presented.

With the increasing proliferation of counterfeit drug products, there is an incentive to screen drugs for legitimacy. One method is to examine the tablet itself, which is usually a destructive operation. Another method that has been explored is to characterize the packaging, which enables nondestructive screening of the product. Raman microscopy has been found to be a useful tool, and it is often the tool of choice for these measurements. Raman mapping of tablets enables not only the identification of components, but also the mapping pattern can enable matching manufacturing sites of different tablets. The study of packaging materials can provide an identification of coating and a depth-profile measurement of thickness. In addition, unlike Fourier transform infrared spectroscopy, which can only measure surface materials, Raman microscopy can provide spectra of dyes and pigments, even if they are printed below a surface film.
In this column installment, we present results of tablet matching measurements and characterization of packaging. The examples show how these measurements aid in the detection of counterfeit drugs.
Raman Tablet Mapping
Two tablets of a well-known drug product were acquired, one from a pharmacy in the United States and one via the mail from an internet pharmacy. Initially, maps of the entire tablets were produced using a DuoScan Raman imaging system (Horiba Scientific) with a 10× objective and a 200-μm pixel. Although maps were acquired in reasonable amounts of time, there did not seem to be any variability in the data. That is, on the 200-μm scale, the tablets were homogeneous, at least for this product. So, smaller maps were collected to make chemical and textural comparisons. This work was performed on an Evolution Raman microscope (Horiba Scientific), an 800-mm focal length system, using a 600-grooves/mm grating, and a 532-nm laser. Maps were acquired in the fingerprint region (200–1800 cm-1) and the CH–OH region (2700–3700 cm-1). LabSpec multivariate analysis software (Horiba Scientific) was used to create the Raman maps, using either the classical least squares (CLS) algorithm when identifiable species could be seen in the data set, or the multivariate curve resolution (MCR) algorithm when the chemical factors were not apparent. As the results will show, operating on the two data sets independently produced verification of the conclusions.
In reality, it was Witkowski of the Food and Drug Administration (FDA) Forensic Chemistry Center in Cincinnati, Ohio, who originally proposed the use of Raman mapping for identifying chemical species and morphological distribution as a means of differentiating counterfeit from authentic tablets, and for differentiating counterfeits from various manufacturing sites (1). Since that work was done, developments in mapping hardware have improved data collection times and multivariate software provides better quality images resulting from the use of scores mapping rather than intensity between cursors, which is subject to much more noise.
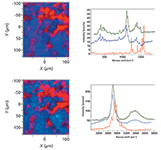
Figure 1: Left: Raman maps of tablet purchased from a pharmacy in the United States produced with fingerprint spectra (top) and CHâOH spectra (bottom). Right: Spectral loadings used to create the maps on the left. The red species is presumably the active drug, having bands near 1600 cm-1 and above 3000 cm-1 that indicate unsaturation. The reference spectrum shown in dark green is that of a cellulose paper filter.
Before data collection, the tablets need to have the coating (usually opaque and pigmented) removed and the surface flattened. The maps shown in Figures 1 and 2 were acquired with step sizes between 5- and 15-μm, using the DuoScan Raman imaging system to distribute the laser intensity over each pixel in the map. The SWIFT imaging option (Horiba Scientific) was used to further reduce the acquisition times by eliminating stop and start operations at each data point. After the acquisition of a map, the entire hyperspectral cube was baseline-flattened to improve the quality of the multivariate results. Then we either surfed the file to identify regions of homogeneous spectra that could be used with the CLS algorithm or the MCR algorithm was invoked to "find" the spectral components in the file. Figures 1 and 2 show maps for each of the two tablets based on the fingerprint spectra and then the CH–OH spectra. The loadings ("spectra") used to produce the maps are also shown with reference spectra of the excipient presented for comparison. Because the identity of the active pharmaceutical ingredient (API) was not known, its spectrum could not be shown for comparison. However, APIs tend to be aromatic with large intensities above 1500 cm-1; the loadings shown in red in Figures 1 and 2 are presumed to be API and one can see that the red factors show the same spectra from the two tablets. That is, the counterfeit tablet did contain the active ingredient.
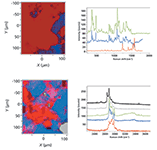
Figure 2: Left: Raman maps of tablet purchased over the internet produced with fingerprint spectra (top) and CHâOH spectra (bottom). Right: Spectral loadings used to create the maps on the left. The red species is presumably the active drug, having bands near 1600 cm-1 and above 3000 cm-1 that indicate unsaturation. The reference spectrum shown in green is that of lactose. Note that use of the MCR algorithm in the CH region identified the presence of a third species (shown in grey) whose spectrum is similar to that of Mg stearate.
Note that for the internet sample, whose results are shown in Figure 2, the CH–OH map has more morphological detail than the fingerprint map. Also, the use of the MCR algorithm revealed the presence of a hydrocarbon like magnesium (Mg) stearate. If we go back to the fingerprint map and examine the spectrum in the region where Mg stearate appeared in the CH region, then that component can be added to the factors, producing the map shown in Figure 3. Surprisingly, in this case the CH–OH region provided more information than the fingerprint region, as originally examined. We believe that this is because the fingerprint region will be dominated by the unsaturated API, whereas in the CH region, all species have similar intensities.

Figure 3: Left: Raman maps of tablet purchased over the internet produced with fingerprint spectra. Right: Spectral loadings used to create the maps on the left. The red species is presumably the active drug, having bands near 1600 cm-1 and above 3000 cm-1 that indicate unsaturation. Both excipient spectra (grey = hydrocarbon and blue = lactose) are heavily contaminated with the API probably because the materials do not segregate on this length scale. The reference spectra shown represent lactose in green, and Mg stearate in black.
Package Matching
Examining the exterior packaging of drug products could provide a more rapid and nondestructive means of screening products for authenticity. The packaging of four samples was examined. To measure the inks and papers, it was necessary to use Raman spectroscopy instead of FT-IR because in FT-IR the radiation will not penetrate any coating present on the paper. Figure 4 shows the spectra of the blue and blue-green pigments on each package, after baseline subtraction. Band frequencies in the bottom spectrum are labeled to assign these spectra as resonance-enhanced. Under such circumstances, overtone and combination bands are strong, and CH stretches are usually nonexistent. For example, 2 × 1343 ≈ 2677 cm-1, 1343 + 1531 ≈ 2877 cm-1, and 2 × 1531 cm-1 ≈ 3062 cm-1. (Note that the matches are usually not exact because of anharmonicity of the vibrations.)
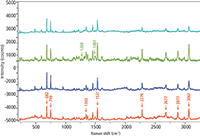
Figure 4: Raman spectra of green or blue inks from pharmaceutical packaging of a drug product and three possible counterfeits of that product. Spectra were excited with the 633-nm laser line and detected on an Evolution Raman microscope (Horiba) equipped with a 600-grooves/mm grating. All spectra exhibited a fluorescence background, presumably from the pigment itself; spectra were baseline-corrected for the display.
The three bottom spectra in Figure 4 appear to be quite similar. Although the bands in the top spectrum do coincide with bands in the other samples, some of the spectral bands in the bottom three samples are absent; in particular, small bands at 1269 and 1487 cm-1 are missing. In the absence of information on the pigments, one can presume that the unsaturated cores of the molecule that provide the color are quite similar, with some small (unsaturated) modifications which would account for small spectral differences.
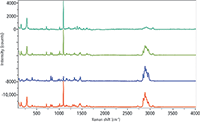
Figure 5: Raman spectra of white regions from pharmaceutical packaging of a drug product and three possible counterfeits of that product. Spectra were excited with the 633-nm laser line and detected on an Evolution Raman microscope (Horiba) equipped with a 600-grooves/mm grating. Spectra were baseline-corrected for the display.
Figure 5 shows spectra acquired from the noncolored regions of the same packages. There is a one-to-one correspondence between Figures 3 and 4; that is, the top spectra on each figure come from the same sample, and likewise for the other spectra. Again, one can see that the top spectrum is an outlier.
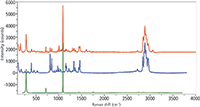
Figure 6: Raman spectrum of white region of one of the packaging samples (top, red) superimposed on a reference spectrum of polypropylene (middle), and calcite (bottom).
The goal of these measurements was to determine if the packaging materials could be differentiated, and obviously that is documented. But since we have been looking at spectra for so long, we always like to challenge ourselves and see if we can guess what is present. Clearly, that is a frightening idea for the novice who is looking for quick answers to a problem. So, at this point we want to show how current commercial products can alleviate the need for highly experienced spectroscopists. We looked at the spectra of the white packaging and recognized the presence of calcite and polypropylene. Figure 6 shows the bottom spectrum of Figure 5 superimposed on our reference spectra of calcite and polypropylene. It is easy to see that most of the spectral features and intensity can be accounted for by these two species. However, the interesting thing was to determine what the BioRad KnowItAll software (2) (BioRad Laboratories) and database could do with this spectrum. Figure 7 shows the results of a mixture analysis performed in that software. The top part of the figure shows the components that were used to fit the spectrum; note that although we were aware of the calcite and polypropylene we were not aware of the polystyrene until the mixture analysis pointed out its presence. Each of these spectra are shown, as well as the measured spectrum and the residual from the fit. Note that because of the tendency of polymers to orient, the relative intensities of the various bands will vary from measurement to measurement, so most of the features in the residual spectrum are not of concern. In addition, the weighting column at the top of the figure shows the relative contributions that were used to fit the measured spectrum. The bottom part of Figure 7 shows, in more detail, the measured spectrum superimposed on the composite spectrum.
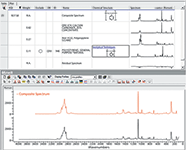
Figure 7: Results of the mixture analysis in the KnowItAll software. The bottom of the figure shows the measured spectrum (in black) superimposed on the composite spectrum (in red) which is constructed using the pure spectra shown in the top of the figure
Summary
In the first part of this column installment, we showed that Raman images constructed from XY maps of tablet surfaces can provide information both on the composition of the tablets and the components' distribution pattern, both of which can help determine if a sample is authentic or not. In addition, differences can aid in determining if counterfeit samples have a common origin. In the second part of this column, we showed that spectra of the packaging material, which can be recorded without any sample destruction, can also aid in the identification of counterfeits. In addition, for those who want to be able to identify material from the spectra, we showed how the use of commercially available software can provide identification, even for a mixture sample.
References
(1) F. Adar, E. Lee, and M. Witkowski, "Single Point Analysis and Raman Mapping of Dosage Formulation as a Means for Detecting and Sourcing Counterfeit Pharmaceuticals," presentation at Pittcon 2007.
(2) Bio-Rad Laboratories, Inc., Philadelphia, Pennsylvania, 2014.
Fran Adar is the Principal Raman Applications Scientist for Horiba Scientific (Edison, New Jersey). She can be reached by e-mail at fran.adar@horiba.com

Fran Adar
Pauline Leary is the applications manager for the Americas for the chemical and biological product line at Smiths Detection. Prior to holding her current position at Smiths, Pauline worked as a pharmaceutical R&D scientist at Purdue Pharma in Ardsley, New York. Pauline holds a B.A. degree from Marist College, an M.S. degree from John Jay College of Criminal Justice, and a PhD from the Graduate Center of the City University of New York.

Pauline Leary
Thomas A. Kubic, PhD, is an Associate Professor of Forensic Science and Chemistry at John Jay College and the Graduate Center, CUNY. He has been in the academic world for more than 15 years after completing 23 years in a municipal crime laboratory. His research interests are in the applications of light and electron microscopy along with UV–vis and vibration spectrometry to the analysis of micro and ultramicro samples.

Thomas A. Kubic, PhD
AI-Powered SERS Spectroscopy Breakthrough Boosts Safety of Medicinal Food Products
April 16th 2025A new deep learning-enhanced spectroscopic platform—SERSome—developed by researchers in China and Finland, identifies medicinal and edible homologs (MEHs) with 98% accuracy. This innovation could revolutionize safety and quality control in the growing MEH market.
New Raman Spectroscopy Method Enhances Real-Time Monitoring Across Fermentation Processes
April 15th 2025Researchers at Delft University of Technology have developed a novel method using single compound spectra to enhance the transferability and accuracy of Raman spectroscopy models for real-time fermentation monitoring.
Nanometer-Scale Studies Using Tip Enhanced Raman Spectroscopy
February 8th 2013Volker Deckert, the winner of the 2013 Charles Mann Award, is advancing the use of tip enhanced Raman spectroscopy (TERS) to push the lateral resolution of vibrational spectroscopy well below the Abbe limit, to achieve single-molecule sensitivity. Because the tip can be moved with sub-nanometer precision, structural information with unmatched spatial resolution can be achieved without the need of specific labels.