Raman Spectroscopy as a Rapid Characterization Tool for Heterogeneous Solids
Special Issues
There are many situations in which it would be highly desirable to apply the benefits of Raman to larger volumes of solid material such as powders, tablets, and composites. Raman benefits such as minimal sample preparation, the ability to provide rich information on both organics and inorganics, and its ability to measure through glass and plastic packaging make it highly amenable to these kinds of samples.
The capability to identify or characterize both organic and covalently bonded inorganic materials in solid form with almost no sample preparation, combined with the ability to measure directly through glass and plastic packaging, has made Raman spectroscopy an increasingly attractive technique to a number of industries. Raman is already well established in the microscopy arena, where the very small measurement area provided by a narrow-diameter excitation laser beam contributes to the goal of restricting the measurement to a small area. Typical beam diameters of excitation lasers used in Raman spectroscopy are along the lines of 1 or 2 mm, and with appropriate focusing optics they can be easily focused down to less than 1 14m in diameter.
There are many situations in which it would be highly desirable to apply the benefits of Raman to larger volumes of solid material such as powders, tablets, and composites. Raman benefits such as minimal sample preparation, the ability to provide rich information on both organics and inorganics, and its ability to measure through glass and plastic packaging make it highly amenable to these kinds of samples. The challenge in doing this is that many of these solid form materials are heterogeneous, and in these situations, the small measurement area provided by a narrow-diameter excitation laser works against the goals of the measurement, which typically are to identify or characterize all of the components that are present. Often, the small measurement area provided by typical Raman excitation lasers is insufficient to give an accurate representation of the composition of the material. Heterogeneity presents a challenge to the analysis of the data as well as to the measurement. The resulting spectrum is an amalgam of the spectra of all of the components of the material, making for a more complex spectrum that is more difficult to interpret and identify. This article describes new approaches to overcoming the challenges presented by the measurement of heterogeneous solids with Raman spectroscopy. It will be shown how the ultimate goal of rapid routine measurement and analysis can be achieved for many situations in which Raman is being applied to measurement of powders or tablets.
Overcoming the Challenge of Obtaining Representative Measurements
The first challenge in getting to rapid routine measurement and analysis is generating a spectrum that accurately represents the heterogeneous material being measured. Historically, a number of approaches have been taken to overcome this challenge, although each has had its disadvantages. These approaches have included rotating or spinning the sample, which can work well for ideal samples, but the sampling device must be closely matched to the geometry of the sample. Techniques involving defocusing the laser to form a line, larger circle, or larger rectangle also have been tried. However, the collection efficiency of Raman scattering is reduced in this approach and sensitivity suffers. Another approach has been to collect a map consisting of discrete measurements from across the surface of the sample. The resulting measurements are then averaged to produce a representative spectrum. This results in a more representative measurement, but the measurement time is increased dramatically.

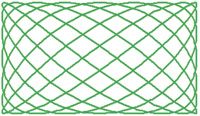
Figure 1: The Lissajous curve pattern generated by the rastering of the laser across the sample using VDPS. Both dimensions of the rectangle are software-controlled and are adjustable to a maximum of 5 mm.
An approach developed more recently called variable dynamic point sampling (VDPS) provides an adjustable measurement area by rapidly rastering the laser across the designated area of the sample without sacrificing focus or sensitivity while still maintaining a measurement time equivalent to that of a traditional single-point measurement. The pattern formed by the laser on the sample is a Lissajous curve, as shown in Figure 1. An example of the effectiveness of the technique is shown in Figure 2, utilizing a pharmaceutical tablet. The spectra were collected with a DXR SmartRaman spectrometer (Thermo Scientific, Madison, Wisconsin).

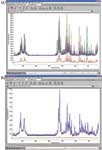
Figure 2: Spectra collected from 25 different sampling points on the surface of an uncoated painkiller tablet: (a) VDPS turned off and (b) VDPS turned on with 5-mm2 sampling area. The red spectrum at the bottom of each image is the variance spectrum.
Spectra were collected from 25 equally spaced points on the surface of an over-the-counter painkiller tablet and displayed in the same data collection window in both Figures 2a and 2b. Figure 2a shows the spectra collected with the VDPS turned off. Figure 2b shows the impact with VDPS, which is a far more reproducible and representative measurement with no loss in sensitivity.
Existing Approaches to Data Analysis
After a representative measurement has been obtained from the sample, the next challenge in the process of characterizing heterogeneous solids is to extract an identification of the compounds that are present from the spectral data. A simple library search often offers a quick means of identifying the dominant component in the material in those situations where there is a clear dominant component. Even in those cases where there is not a clear dominant component, an experienced analyst will still find library searching tools to be useful in breaking the data apart. Searches can be focused on the primary bands in the spectrum to identify likely components responsible for those bands. In both cases, after a component has been identified, a reference spectrum can be subtracted from the original spectrum to remove the contributions of the component and then the process of using library searching tools to identify another component can be repeated for several iterations to produce a reasonable characterization of the total material. This process has its limitations, as the subtraction generally is not perfect and the quality of the spectrum degrades with each successive subtraction. It also requires a significant amount of experience and skill on the part of the analyst.
Another approach that works well with some samples is to use the measurement technique described earlier, in which the sample surface is mapped, but rather than averaging the individual spectra to produce a composite spectrum, library searching is applied to each of the individual spectra. If the sample is a low-scattering material where the heterogeneity is at a level at which areas of pure components are larger than the measurement area for the individual spectra, then this method can work quite well, as the resulting array of spectra will have many spectra that are close to single component spectra, which are easily identified by library searching.
The simple approach of just performing library searches on these data sets falls short when the particle size of the individual components is much smaller than the excitation spot size or the sample exhibits a very high degree of scattering (which is often the case with powders and tablets). In these situations, the resulting spectra from individual points are still composites and the user is still left with the task of pulling apart the spectra to identify the individual components. There are still advantages to this approach, which results in a large number of spectra that more than likely will have varying degrees of the underlying components represented in each spectrum. This opens the door to using multivariate techniques, such as multivariate curve resolution (MCR) to leverage variation across the dataset and automate the extraction of the individual components, which can then be searched easily against a library to obtain the identity of each (1). This approach still involves longer measurement times, because a large number of individual measurements must be collected to generate a map with high-quality spectra at each point.
Simplifying Data Analysis
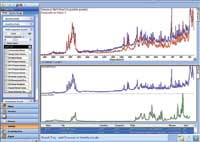
Another approach greatly simplifies the analysis. The approach is still based upon library searching of a single composite spectrum; however, now a multicomponent searching algorithm optimized for use with Raman spectra can be applied. This allows the user to quickly identify the major components of a heterogeneous solid with just a few mouse clicks. The algorithm avoids the analyst having to go through the iterative subtraction process to identify possible matches to the materials. Figure 3 presents an example in which a powder sample of an illicit street drug is measured with a single measurement and then analyzed using the multicomponent searching algorithm available in the software (Omnic Specta, Thermo Scientific).

Figure 3: Spectrum collected of a white powder illicit drug sample and results of multicomponent library search. The search results show that the dominant component is heroin and that the sample also contains a significant amount of lactose.
In this example, the multicomponent search quickly revealed that the dominant contribution to the spectrum was heroin, and at the same time, it also revealed that the heroin had been cut with a significant amount of lactose. The ability to get to results this quickly and with so little effort represents a significant leap forward in the data analysis step of the process of characterizing heterogeneous solids.
Conclusion
Raman spectroscopy does still have limitations. All techniques relying upon library searching for identification will ultimately be limited by the quality and scope of the spectral libraries available, and the analyst should always apply some scrutiny to the results. This makes it very important to have a large collection of library reference spectra covering the range of materials that are expected to be encountered. It is also very important for the instrument to be rigorously calibrated on both the wavelength and intensity axes so that the data produced are readily comparable to library data. Still, the possibility of collecting a quick, single measurement to obtain a representative spectrum of a heterogeneous solid using VDPS and then obtaining multicomponent search results with just a few mouse clicks more does make Raman a highly viable technique for this type of analysis. This opens the door to more widespread utilization of Raman for the routine analysis of heterogeneous solids in situations where some of the benefits of the technique, such as sampling directly though glass and plastic packaging, will offer an advantage to the overall operation of the laboratory.
Joe Hodkiewicz and Mark Wall are with Thermo Fisher Scientific, Madison, Wisconsin.
References
(1) P. Henson, G.I.T. Laboratory Journal 12, 36–37 (2008).

AI-Powered SERS Spectroscopy Breakthrough Boosts Safety of Medicinal Food Products
April 16th 2025A new deep learning-enhanced spectroscopic platform—SERSome—developed by researchers in China and Finland, identifies medicinal and edible homologs (MEHs) with 98% accuracy. This innovation could revolutionize safety and quality control in the growing MEH market.
New Raman Spectroscopy Method Enhances Real-Time Monitoring Across Fermentation Processes
April 15th 2025Researchers at Delft University of Technology have developed a novel method using single compound spectra to enhance the transferability and accuracy of Raman spectroscopy models for real-time fermentation monitoring.
Nanometer-Scale Studies Using Tip Enhanced Raman Spectroscopy
February 8th 2013Volker Deckert, the winner of the 2013 Charles Mann Award, is advancing the use of tip enhanced Raman spectroscopy (TERS) to push the lateral resolution of vibrational spectroscopy well below the Abbe limit, to achieve single-molecule sensitivity. Because the tip can be moved with sub-nanometer precision, structural information with unmatched spatial resolution can be achieved without the need of specific labels.