Rapid Quantitative Analysis of Puerarin Using Raman Spectroscopy
A method that demonstrates Raman spectroscopy can be a rapid and reliable analytical method for the identification and quantitative determination of puerarin, a compound found in a traditional Chinese medicine.
In this study Raman spectroscopy was used to identify and quantitate puerarin, an isoflavone present in the traditional Chinese medicine Radix puerariae. Information was obtained about puerarin's molecular structure, and a quantitative model was established using a linear relationship between the ratio of characteristic band intensity of puerarin and that of ethanol as the internal standard and the concentration of puerarin. This model was successfully applied for quantifying puerarin extracted from Radix puerariae.
Radix puerariae, a commonly used traditional Chinese medicine, is the dry root of Pueraria lobata (wild) Ohwi and Pueraria thomsonii Benth (1). It is effective in the treatment of hypertension, shoulder or wrist stiffness, the common cold, influenza, cardiovascular diseases, and alcohol abuse (2–5). Studies on pharmacology and clinical practice have shown that the active constituents in Radix puerariae are isoflavones, of which puerarin is present in the greatest amount (6). Figure 1 shows the chemical structure of puerarin with the molecular formula C21H20O9. Puerarin has many physiological activities such as antiproliferative effects on human cancer cell lines, inhibition of alcohol dehydrogenase, promotion of blood circulation, prevention of cardiovascular diseases, treatment of arrhythmia, and inhibition of xanthine oxidase (7–10). Recent research indicates that puerarin is an effective antioxidant and shows antihyperglycemic effects, as well as hepatoprotective activity relating to the inhibition of β-glucuronidase and estrogenic effects (11–14). Puerarin has been widely added into various pharmaceutical preparations and its content directly affects the efficacy of the drug.

Figure 1: The molecular structure of puerarin.
So far, many analytical methods have been developed to determine puerarin including high performance liquid chromatography (HPLC), ultraviolet (UV) spectrophotometry, thin-layer chromatography (TLC), and near-infrared (NIR) spectroscopy (15–18). The most commonly used method is HPLC, but it requires complicated procedures for sample preparation, processing, and analysis. Although the results are accurate, it consumes a lot of time and reagents. In addition, HPLC has some shortcomings such as low separation efficiency and short column lifetime. The other three methods suffer from relatively low sensitivity. Therefore, it is necessary to establish a rapid, simple, and reliable method for the identification and quantification of puerarin.
Raman spectroscopy is an effective analytical method in the identification and quantification of complex mixtures because it provides fingerprint spectra of molecular structures that are unique to each specific substance and the intensity of the Raman band is related to analyte concentration (19,20). Raman spectroscopy has several advantages compared to other analytical methods for sample analysis. The time for Raman analysis is short because each spectrum can be acquired within a few seconds, and it requires minimal sample preparation, which allows for high-throughput screening and automation. In addition, sample presentation is flexible and may be used for solids, liquids, gases, and gel forms. Raman spectroscopy also enables nondestructive measurements. Another advantage of this method, especially in comparison with infrared (IR) spectroscopy, is that the analysis of liquid samples is not interfered with by water. Also, the Raman spectrum is often less complex than the IR spectrum, which simplifies the analysis (21–24). In recent years, Raman spectroscopy has been widely applied in the analysis of food, pharmaceuticals, and chemicals. It is increasingly used as an important tool for quality control in food, pharmaceutical, and biological products (25,26).
This article attempts to establish the qualitative and quantitative detection of puerarin using Raman spectroscopy. Raman absolute band intensity depends on the concentration of the analyte and other factors such as laser power and instrumental effects, which cannot be reliably reproduced. Therefore, to obtain a quantitative model, a fit standard is required (27). At present, the solvent can be used as an internal standard when the tested sample is a solute in solution because it is not affected by the analyte concentration. In this study, ethanol was selected as the internal standard because it can dissolve and extract puerarin from Radix puerariae (28). The quantitative model was built by analysis of the relationship between intensity ratios of the Raman band of puerarin to that of ethanol and a series of concentration of samples. This method was applied for the determination of the amount of puerarin extracted from Radix puerariae.
Materials and Methods
Materials and Samples Preparation
Puerarin (98%) and powders of Radix puerariae containing 2.5% puerarin were provided by China National Analytical Center, Guangzhou. Ethanol (95%) as the solvent was purchased from Guangzhou Chemical Reagent Company. All the above compounds were used without further purification. All experimental tools were washed by ultrapure water.
Puerarin standard substance dissolved in ethanol was prepared for a reference solution at a concentration of 3.47 × 10⁻² mol/L. A series of standard solutions at concentrations of 6.9 × 10⁻³, 1.39 × 10⁻², 2.08 × 10⁻², and 2.78 × 10⁻² mol/L were prepared by diluting the prepared reference solution with solvent. Approximately, 2.5% powders of Radix puerariae (1 g) were weighed and soaked in 10 mL of 95% ethanol for 30 min with ultrasonic agitation (250 W, 60 kHz). The sample was cooled to room temperature and an additional volume of ethanol equivalent to that lost during the extraction was added. Then the Radix puerariae alcohol solution was centrifuged at 10,000 rpm for 10 min. The supernatant was used as the test solution. The isolated liquid samples were subsequently sealed in capillaries for measurement. The powder sample was tested directly on glass slides.
Raman Spectrometer
Raman spectra were measured using a Renishaw micro-Raman spectroscopy system. The excitation wavelength was 514.5 nm from an argon ion laser. A 20× microscope objective was used to focus the laser beam on the sample and collect the backscattered Raman signals. To ensure the accuracy of the Raman shift, the wavelength of the Raman laser had to be corrected. Therefore, the wavelength of the Raman laser was adjusted by the band intensity of silicon at 520 cm-1 before measurement. Raman signals were collected in a spectral interval of 100 cm-1 until 3200 cm-1, but only the 250–2000 cm-1 region was selected for analysis. The laser power focused on the sample was 50 mW. The acquisition time for all spectra was 10 s. Each sample was measured five times. All Raman spectra were measured under the same conditions.

Figure 2: Baseline correction of the Raman spectrum: (a) before and (b) after correction.
Raman Analysis
The baseline of the Raman spectrum was shifted as a result of fluorescence derived from substance. The fluorescence background was removed by a baseline correction algorithm (29,30) and the baseline was corrected to zero throughout the complete range. An illustration of the baseline correction is shown in Figure 2. Then Origin 8.5 software (OriginLab Corporation) was used to read the band intensity at 1628 cm-1 of puerarin and 880 cm-1 of ethanol and calculate the ratios that were subsequently used for linear regression to generate a calibration curve. The calibration curve was generated by plotting the band intensity ratios against the analyte concentration. The limit of detection (LOD) was determined based on the signal-to-noise ratio (S/N) of 3:1.
Results and Discussion
Raman Spectrum of Puerarin and Puerarin in Ethanol
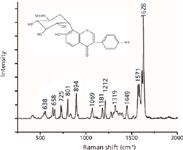
The Raman spectrum of pure puerarin powder in the spectral region 600–1700 cm-1 is presented in Figure 3. These Raman bands are known as the fingerprint regions that contain information about the molecular structure used to identify the unique material. The strong intensity band at 1628 cm-1 is assigned as mixed benzene ring stretching vibrations (C=Cring) and C=O stretching vibrations. The bands at 1571 and 1449 cm-1 are assigned as bending of O–H. Most of the bands in the region 1300–1400 cm-1 are assigned as CH deformations. Vibrations between 1000 and 1300 cm-1 are mainly due to C–O stretching vibrations. The two bands at 894 and 801 cm-1 are associated with the stretching vibrations of C–C and the deformation of the benzene ring. The band at 725 cm-1 is attributed to bending of C–H. The bands observed at 658 and 638 cm-1 are associated to out-of-plane bending of O–H. All of the above Raman bands were characteristic bands of puerarin; the band at 1628 cm-1 can be considered the marker of puerarin because the band is most obvious and not easily interfered with by other bands.

Figure 3: Raman spectrum of pure puerarin.
The Raman spectra of puerarin in the ethanol solution at a concentration of 3.47 × 10⁻² mol/L and ethanol alone are depicted in Figure 4, respectively. Because of the influence of the Raman bands of ethanol, the bands of puerarin exhibit some changes: The Raman band intensity was weakened and some bands were overlapped by bands of ethanol. However, the characteristic bands of puerarin at 801, 1212, 1319, and 1628 cm-1 can be observed clearly (Figure 4a). Among these bands, the band at 1628 cm-1 was chosen for quantitative analysis of puerarin in ethanol because of strong intensity and lack of interference with ethanol-based bands. The Raman band at 880 cm-1 of ethanol, which is assigned to stretching vibrations of C–C–O skeleton (31), is used as a representative of the ethanol because its intensity is very high and stable (Figure 4b). In conclusion, the relative intensity of the band at 1628 cm-1 of puerarin and the band at 880 cm-1 of ethanol forms the basis for the quantitation of puerarin in ethanol.

Figure 4: Raman spectra of (a) puerarin in ethanol and (b) ethanol.
Quantitative Analysis System
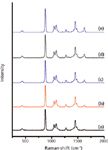
Raman spectroscopy is used for the quantitative analysis of the sample solution. The absolute Raman intensity was influenced by several factors, including laser power, fluorescence effect, noise of solvent, self-absorption of the sample, and experimental environmental impacts. Therefore, there is a greater chance for error if the Raman absolute intensity is directly used for quantitative analysis of the sample solution. The internal standard method was chosen to eliminate such errors. Because the internal standard and sample were analyzed under the same experimental conditions, the influence factors offset each other. The solvent was used as the internal standard in the sample solution (32). The intensity of the Raman characteristic band of the solvent was relatively unchanged with variation of solute concentration, and only the Raman intensities of the analyte varied with the analyte concentration. Figure 5 displays the intensity of the Raman characteristic band of puerarin at 1628 cm-1. Note that it gets stronger with increasing amounts of puerarin. At the same time, the band intensity of ethanol was at a relatively constant rate. The intensity ratio between the characteristic band of puerarin and ethanol was used for quantitative analysis of puerarin.

Figure 5: Raman spectra of puerarin in ethanol at concentration of (a) 6.9 Ã 10-3 mol/L, (b) 1.39 Ã 10-2 mol/L, (c) 2.08 Ã 10-2 mol/L, (d) 2.78 Ã 10-2 mol/L, and (e) 3.47 Ã 10-2 mol/L.
Calibration Curve
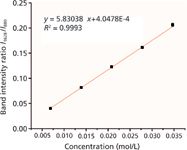
The Raman spectra of puerarin in ethanol at concentrations of 6.9 × 10⁻³, 1.39 × 10⁻², 2.08 × 10⁻², 2.78 × 10⁻², and 3.47 × 10⁻² mol/L were measured five times. The intensity ratio of the characteristic band of puerarin and ethanol was calculated and plotted against analyte concentration. The calibration curve for puerarin in ethanol is shown in Figure 6. The ratio of band intensity is proportional to the analyte concentration. There is a good linear relationship between the intensity ratio and the analyte concentration. The regression equation of the calibration curve was y = 5.83038x + 4.0478E-4 with an R2 of 0.9993, where x and y represent the concentration of puerarin in ethanol and the Raman intensity ratio, respectively. The limit of detection was determined to be 2 × 10⁻⁴ mol/L. The result illustrates that the ratio of band intensity was successfully applied as the parameter for quantitative analysis of puerarin. To reduce the interference with additional substances and avoid error caused by the environmental factors in the quantitative analysis, we selected a solvent as the internal standard in Raman quantitative detection.

Figure 6: Calibration curve for the ratio of band intensity to concentration of puerarin in ethanol. Each point is the average of five spectra, and the error bar shown is one standard deviation.
Quantitative Analysis Puerarin in Radix puerariae
Puerarin was extracted from Radix puerariae with an ethanol solution. The characteristic Raman band of puerarin at 1628 cm-1 and the band at 880 cm-1 of ethanol were observed. The intensity ratio between the characteristic band of puerarin and ethanol was calculated. The concentration of puerarin was obtained by the regression equation of the calibration curve. The calculation results indicate that pueraria powders contain 2.55% puerarin. This result is basically in accordance with the known concentration (2.5%) of puerarin detected by the China National Analytical center. Raman spectroscopy was successfully applied for the detection the amount of puerarin extracted from Radix puerariae.
Conclusion
Raman spectroscopy was used for the identification and quantification of puerarin. The Raman spectrum provided clear and distinct evidence for information of molecular structure of puerarin. The Raman quantitative model was established using a ratio of band intensity between the sample and solvent; it showed a good linear relationship with analyte concentration. This model was applied to detect the amount of puerarin in Radix puerariae, and the result was in accordance with the known sample concentration. Raman spectroscopy can be a rapid and reliable analytical method for the identification and quantitative determination of puerarin.
Acknowledgments
This project was supported in part by the National Natural Science Foundation of China (Grant No. 30873238) and the Key Science and Technology Project of Guangdong Province of China (Grant Nos. 2007B031401010 and 2011B031700056).
References
(1) S.B. Chen, H.P. Liu, R.T. Tian, D.J. Yang, S.L. Chen, H.X. Xu, A.S. Chan, and P.S. Xie, J. Chromatogr. A. 1121, 114–119 (2006).
(2) K.H. Wong, G.Q. Li, K.M. Li , V. Razmovski-Naumovski, and K. Chan, J. Ethnopharmacol. 134, 584–607 (2011).
(3) J.W. Kim, Y.C. Jin, Y.M. Kim, S. Rhie, H.J. Kim, H.G. Seo, J.H. Lee, Y.L. Ha, and K.C. Chang, Life. Sci. 84, 227–234 (2009).
(4) W.M. Keung, Alcohol. Clin. Exp. Res. 17, 1254–1260 (1993).
(5) X.J. Yao, J.A. Yin, Y.F. Xia, Z.F. Wei, Y.B. Luo, M. Liu, C. Feleder, and Y. Dai, J. Ethnopharmacol. 141, 322–330 (2012).
(6) Y.F. Wu, X.S. Wang, and E. Fan, Phytochem. Anal. 23, 513–519 (2012).
(7) Y.J. Lin, Y.C. Hou, C.H. Lin, Y.A. Hsu, J.J. Sheu, C.H. Lai, B.H. Chen, P.D. Lee Chao, L. Wan, and F.J. Tsai, Biochem. Biophys. Res. Commun.378, 683–685 (2009).
(8) S. Zhang, G. Ji, and J. Liu, J. Nutr. Biochem. 17, 485–491 (2006).
(9) X.H. Meng, C. Ni, L. Zhu, Y.L. Shen, L.L. Wang, and Y.Y. Chen, Vascul. Pharmacol. 50, 110–115 (2009).
(10) D.K. Yeung, S.W. Leung, Y.C. Xu, P.M. Vanhoutte, and R.Y. Man, Eur. J. Pharmacol. 552, 105–111 (2006).
(11) B. Jiang, J.H. Liu, Y.M. Bao, and L.J. An, Cell. Biol. Int. 27, 1025–1031 (2003).
(12) G.Y. Zhu, X. Zhu, Q. Fan, and X. L. Wan, Spectrochim. Acta. Part A. 78, 1187–1195 (2011).
(13) B.K. Noh, J.K. Lee, H.J. Jun, J.H. Lee, Y. Jia, M.H. Hoang, J.W. Kim, K.H. Park, and S.J. Lee, Biochem. Biophys. Res. Commun. 414, 361–366 (2011).
(14) S. Malaivijitnond, D. Tungmunnithum, S. Gittarasanee, K. Kawin, and N. Limjunyawong, Fitoterapia. 81, 569–576 (2010).
(15) B.S. Yu, X.P. Yan, G.B. Zhen, and Y.P. Rao, J. Pharm. Biomed. Anal. 30, 843–849 (2002).
(16) L. Liu, F. Feng, S. Shuang, Y. Bai, and M.M. Choi, Talanta 91, 83–87 (2012).
(17) Y.K. Liu, E. Yan, H.Y. Zhan, and Z.Q. Zhang, J. Pharm. Anal. 1, 13–19 (2011).
(18) C.C. Lau, C.O. Chan, F.T. Chau, and D.K. Mok, J. Chromatogr. A. 1216, 2130–2135 (2009).
(19) G.Y. Zhu, X. Zhu, Q. Fan, and X.L. Wan, Spectrochim. Acta Part A. 78, 1187–1195 (2011).
(20) P. Niemelä, M. Päällysaho, P. Harjunen, M. Koivisto, V.P. Lehto, J. Suhonen, and K. Järvinen, J. Pharm. Biomed. Anal. 37, 907–911 (2005).
(21) S. Mazurek and R. Szostak, Food. Chem. 125, 1051–1057 (2011).
(22) D.S. Hausman, R.T. Cambron, and A. Sakr, Int. J. Pharm. 299, 19–33 (2005).
(23) C. Eliasson, N.A. Macleod, L.C. Jayes, F.C. Clarke, S.V. Hammond, M.R. Smith, and P. Matousek, J. Pharm. Biomed. Anal. 47, 221–229 (2008).
(24) M.S. Hwang, S. Cho, H. Chung, and Y.A. Woo, J. Pharm. Biomed. Anal. 38, 210–215 (2005).
(25) J.W. Qin, K.L. Chao, and M.S. Kim, J. Food. Eng. 107, 277–288 (2011).
(26) K. Buckley and P. Matousek, J. Pharm. Biomed. Anal. 55, 645–652 (2011).
(27) Y. Numata, Y. Iida, and H. Tanaka, J. Quant. Spectrosc. Radiat. Transfer. 112, 1043–1049 (2011).
(28) M.H. Lee and C.C. Lin, Food Chem. 105, 223–228 (2007).
(29) Z.M. Zhang, S. Chen, and Y.Z. Liang, Analyst. 135, 1138–1146 (2010).
(30) Z.M. Zhang, S. Chen, Y.Z. Liang, Z.X. Liu, Q.M. Zhang, L.X. Ding, F. Ye, and H. Zhou, J. Raman. Spectrosc. 41, 659–669 (2009).
(31) B. Chazallon, Y. Celik, C. Focsa, and Y. Guinet, Vib. Spectrosc. 42, 206–214 (2006).
(32) P.J. Aarnoutse and J.A. Westerhuis, Anal. Chem. 77, 1228–1236 (2005).
Xin Qi and Han-ping Liu are with the MOE Key Laboratory of Laser Life Science & Laboratory of Photonic Chinese Medicine in the College of Biophotonics at South China Normal University in Guangdong, China.
Chang-chun Zenga is with the MOE Key Laboratory of Laser Life Science & Laboratory of Photonic Chinese Medicine in the College of Biophotonics at South China Normal University and the School of Basic Medical Sciences at Guilin Medical University in Guangxi, China.
Song-hao Liu is with the School for Information and Optoelectronic Science and Engineering at South China Normal University in Guangzhou, China.
Please direct correspondence to: gzzysys@scnu.edu.cn

LIBS Illuminates the Hidden Health Risks of Indoor Welding and Soldering
April 23rd 2025A new dual-spectroscopy approach reveals real-time pollution threats in indoor workspaces. Chinese researchers have pioneered the use of laser-induced breakdown spectroscopy (LIBS) and aerosol mass spectrometry to uncover and monitor harmful heavy metal and dust emissions from soldering and welding in real-time. These complementary tools offer a fast, accurate means to evaluate air quality threats in industrial and indoor environments—where people spend most of their time.
NIR Spectroscopy Explored as Sustainable Approach to Detecting Bovine Mastitis
April 23rd 2025A new study published in Applied Food Research demonstrates that near-infrared spectroscopy (NIRS) can effectively detect subclinical bovine mastitis in milk, offering a fast, non-invasive method to guide targeted antibiotic treatment and support sustainable dairy practices.
Smarter Sensors, Cleaner Earth Using AI and IoT for Pollution Monitoring
April 22nd 2025A global research team has detailed how smart sensors, artificial intelligence (AI), machine learning, and Internet of Things (IoT) technologies are transforming the detection and management of environmental pollutants. Their comprehensive review highlights how spectroscopy and sensor networks are now key tools in real-time pollution tracking.