Single-Cell ICP-MS Analysis: Quantifying the Metal Concentration of Unicellular Organisms at the Cellular Level
Spectroscopy
Single-cell ICP-MS can accurately quantify the metal concentrations within individual cells, providing new information about the mean metal content and the variation within a cell population. This method is shown to be a vital tool for assessing the specific uptake of metals by ovarian cancer cells and fresh water algae.
Accurate quantification of the metal content of individual cells is vital to understanding the uptake mechanisms for risk and dosimetry assessments in environmental and human health sciences. Traditional methods use nominal mass concentrations, missing vital information on metal distribution and the variations that occur at the unicellular level. In this study, we use single-cell inductively coupled plasma–mass spectrometry (ICP-MS) and discuss the steps required for a successful single-cell ICP-MS analysis using a mammalian case study of the uptake of cisplatin into ovarian cancer cells and an ecotoxicological example of the uptake of dissolved and nanoparticulate gold into freshwater algae cells.
All cells need nutrients to survive (1–4). Some of these nutrients are metallic and are absorbed and expelled through the cell membrane from the surrounding media, whether that is an environmental medium (5) or bodily fluid (6). A similar mechanism can lead to the uptake of heavy metal contaminants, nanoparticles (NPs), or metallic drugs that are not beneficial to the cells' survival, and can up-regulate or down-regulate essential cellular metals (7,8).
The manufacture and use of products containing metals, or metallic NPs, has increased in the last few years (9,10). Some of these products have been designed to biologically interact, such as medical (11) or antibacterial products (12,13), while others have not, such as paints, fuel additives, and sunscreens (14). In either case, the interaction of metals on a cellular level is inevitable. These cellular interactions can be advantageous, such as in the delivery of metal-containing drugs into cancer cells (15–17), or harmful, such as the uptake of heavy metals into algal cells (18–20). Quantification of the metal content within cells can be challenging because of the small concentrations contained within the cells, being in the attogram-per-cell range.
There are currently a few average-based methods for measuring or identifying cellular metal content. Total metal content has typically been measured by removing the cells from their culture or exposure media and acid-digesting them for analysis by inductively coupled plasma–mass spectrometry (ICP-MS) (21). This methodology provides the total metal content in a given number of cells and offers an average concentration of metal per cell, by assuming a homogenous distribution. This assumption does not provide a realistic overview, since each individual cell will not accumulate the same amount of ionic or nanoparticulate metal. A more realistic view of NPs and dissolved uptake of metals by cells can be seen in Figures 1a and 1b, respectively, where cells bioaccumulate metals in a non-uniform way with some cells accumulating more metal than others.
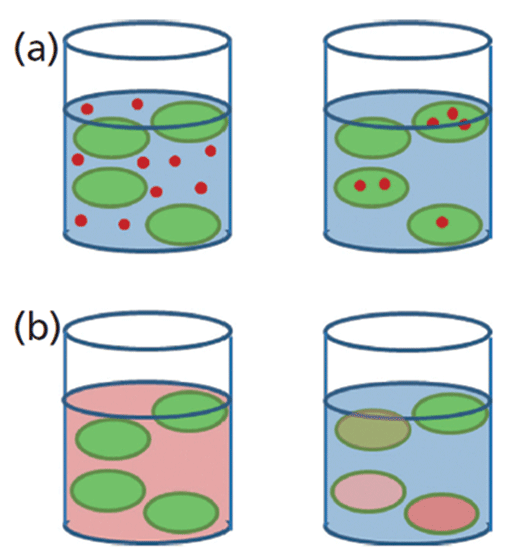
Figure 1: Schematic representation of (a) NPs and (b) dissolved metal uptake by cells.
Total metal content analysis is often supplemented with techniques such as transmission electron microscopy (TEM), scanning electron microscopy (SEM) (22), and fluorescent tracking (23) to directly visualize metals and metal NPs inside individual cells. These techniques are only qualitative and are prone to artefacts, resulting in false positives.
Single-cell ICP-MS is a novel ICP-MS technique that directly quantifies the metal content within individual cells at the attogram (ag, 10-18 g)-per-cell level. The technique allows for the analysis of single-celled organisms to determine intracellular metal concentrations in both environmental and human health sciences, with minimal sample preparation.
This work focuses on the key considerations, work flow, and sample introduction alterations needed to successfully preform single-cell ICP-MS as well as its application; two examples are provided that highlight the use of this approach in life and environmental sciences. In the first example, we describe the use of single-cell ICP-MS to measure the uptake of cisplatin using cisplatin-sensitive A2780 and cisplatin-resistant CP70 ovarian cancer cell lines. In the second example, we describe the uptake of dissolved and gold (Au) NPs into various strains of flagellated freshwater algae.
Experimental
Hardware and Instrument Conditions
Introduction: Design Consideration for Single-Cell ICP-MS
Acquiring single-cell suspensions and the introduction of individual intact cells into the plasma are the two biggest challenges for single-cell ICP-MS to be successful. These challenges come with many key components that need to be optimized, as shown in Figure 2, which shows the parts of the single-cell ICP-MS experimental design that must be considered. A more thorough discussion of these parameters follows.
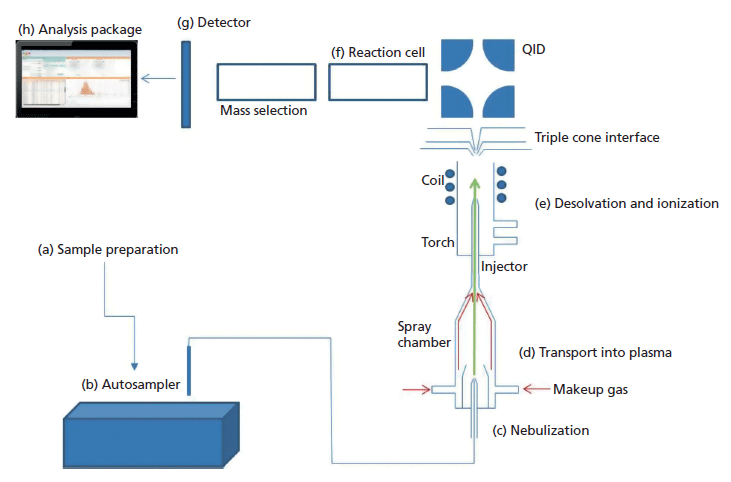
Figure 2: Schematic of optimization and design of single-cell ICP-MS encompassing the following parameters: (a) sample preparation, (b) automated sample injection, (c) aspiration of cell suspensions, (d) spray chamber design, (e) desolvation and ionization, (f) reaction cell gases, (g) sample detection, and (h) sample analysis.
Sample preparation protocols are critical, and need to ensure that cellular integrity is maintained (Figure 2a). Depending on the cell type being analyzed, the requirements for the cell culture vary greatly, and are described in the cell culture section below. Care needs to be taken to ensure that the cells exist as individual cells in suspension (not aggregates), and that treatment of the cells before analysis does not cause cell lysis, resulting in cell fragments entering the plasma, and causing the appearance of either more events or a false background. Additionally, the media in which cells are grown can range in complexity, ionic strength, and organic content depending on the cell type. Some growth media contains high levels of the metal of interest, which is particularly a problem for intrinsic metal analysis. This background can mask the signal from the cells, making it necessary to resuspend the cells into a media free of that metal.
Automated sampling for single-cell ICP-MS has some specific requirements (Figure 2b). Typically, cells do not remain in suspension and rapidly settle, necessitating the need for cell resuspension before analysis. Additionally, some cells require precise temperatures for survival to reduce the probability of cellular lysis or death. Microsampling and microflow sample delivery to the plasma (flow rates of 20–100 µL/min) were also required. In this work, a Single Cell Autosampler (PerkinElmer, Inc.) was used. This autosampler is able to mimic pipette-driven agitation to resuspend the cells before sample injection. The sample is then transported into a sample loop before it is introduced into the ICP-MS system via a syringe-driven mechanism delivering microflow rates. It also uses interchangeable temperature-controlled sample racks to promote cell survival before analysis.
The sample is injected into the spray chamber through a nebulizer (Figure 2c). The nebulization process applies physical pressure on cells that can result in cell lysis, while the restriction on the sample flow rate means that a high efficiency nebulizer (HEN) is required. The amount of pressure a cell can withstand is highly dependent on cell type, so nebulizer gas flow and sample flow rate of the HEN needs to be evaluated for each cell type to ensure that cell damage does not result from the nebulization process.
Conventional cyclonic spray chambers transport a maximum droplet size of ~4 µm to the plasma, with the majority of these being much smaller (28,29). This maximum size is problematic when introducing cells into the plasma, as they are typically 1–100 µm in size. The inefficiency of the cyclonic spray chamber in transporting micrometer-sized particles to the plasma was assessed by comparing the transport efficiency (TE) of 2.5-µm diameter lanthanide-laced polystyrene beads to that of 60-nm Au NPs. The TE for these beads was only 0.03% (± 0.01), compared to a TE of around 7% for 60-nm Au NPs, meaning that micrometer-sized particles are less likely to reach the plasma than NPs. This TE difference highlights why this design is not a viable option for single-cell ICP-MS. A new linear-pass spray chamber (Asperon, PerkinElmer) was developed to increase cell transport, decrease collisions of the cells with the chamber wall, and limit the amount of solvent entering the plasma, thereby improving stability and cell viability (Figure 2d). A dual make-up gas inlet was positioned to create a tangential flow in the spray chamber, creating a laminar flow that prevents cells from colliding with and sticking to the chamber walls and ensuring maximum transport of the cells to the plasma. Using this spray chamber, the TE experiments using the lanthanide-laced polystyrene beads and Au NPs were repeated. A transport efficiency of 33% for both nano- and micrometer-sized particles was obtained, showing equal transportation through the chamber (37). This result demonstrated that the Asperon spray chamber did not differentiate between droplet sizes and ensured optimal delivery to the ICP-MS plasma.
After successfully transporting intact individual cells to the plasma, the plasma atomizes and ionizes the cells (Figure 2e). The resulting ions travel as ion plumes through the ion optics of the instrument, including passing through the reaction cell (Figure 2f), which can either be run in standard mode or reaction mode, to reduce interferences. The ion of interest is then mass-selected by a quadrupole before detection. The detector (Figure 2g), along with advanced data processing, is capable of fast data acquisition with dwell times down to 10 µs and zero settling time, thereby providing an accurate measurement of the total metal content within each individual cell. Finally, the analysis of the data (Figure 2h) was achieved using dedicated software that allows for real-time visualization of the individual cell events, providing a peak-area distribution of the cell population during data acquisition (Figure 3). The peak areas are then converted into mass of metal per cell (attograms per cell), and displayed in a histogram of mass per cell against frequency of that mass range.
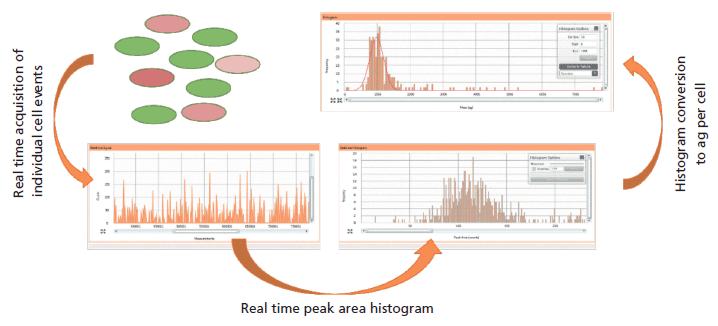
Figure 3: Conversion of metals within individual cells to mass per cell histogram using the Syngistix single-cell application software module.
Instrumental Conditions
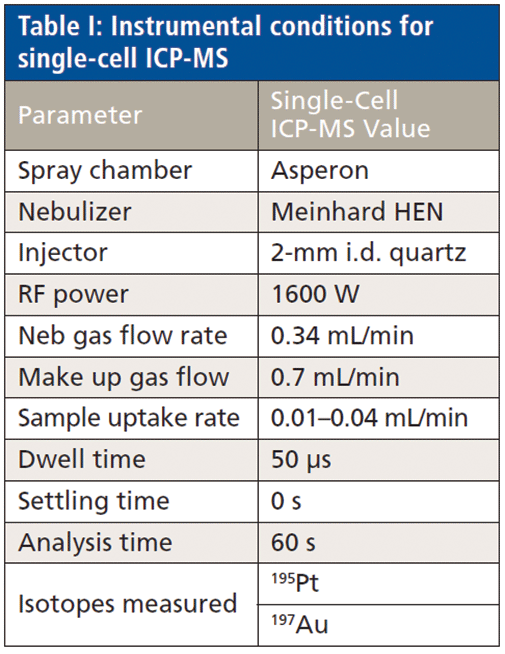
Analyses were performed with a Nexion ICP-MS using the Syngistix Single Cell application software module for data collection and processing (PerkinElmer, Inc.). Instrumental conditions are shown in Table I. Sample introduction was accomplished with a high-efficiency nebulizer coupled to an Asperon spray chamber.
ICP-MS Methods
Cancer Cell Experiments
Ionic platinum standards (1, 2, and 3 ppb) were prepared in phosphate-buffered saline (PBS) to matrix-match the cell samples. The transport efficiency was determined using 60-nm gold nanoparticles (National Institute of Standards and Technology [NIST]) in PBS.
Algae Experiments
Calibrations were performed with both ionic–dissolved and NP standards. The ionic calibration was performed with 1, 2, and 3 ppb Au, and the NP calibration was done using 10-, 30-, and 60-nm Au NPs (NIST 8011, 8012, and 8013, respectively), prepared at 50,000 part/mL. All standards were prepared in the algae media to matrix-match the cell suspensions. Transport efficiency was determined using the 60-nm Au NPs.
Cell Cultures
Cancer Cell Culture and Cisplatin Treatment
Ovarian cancer cell lines A2780 and A2780/CP70 were used in all experiments. Cells were grown in RPMI 1641 media (Gibco) supplemented with 10% fetal bovine serum (FBS, Gibco), insulin (Sigma-Aldrich), l-glutamine, and pen/strep (Gibco) under 5% CO2at 37 °C. Cisplatin was resuspended at 1 mg/mL in sterile saline and vigorously shaken for 30 min before treatment. Cells were treated with 30 µM cisplatin and samples collected at intervals of 1, 2, 4, and 8 h post-treatment. For analysis, cells were washed twice with PBS and collected using the non-enzymatic cell dissociation solution Cellstripper (Corning). Cells were centrifuged at 500g for 10 min. The supernatant was discarded, and the cells were resuspended in 1 mL PBS, filtered through a 70-µm nylon mesh, and quantitated by hemocytometer counting. Cells were diluted in PBS to a final concentration of 100,000 cells/mL and kept on ice until analysis.
Algae Cell Culture and Metal Gold (Au) Treatment
Stock cell cultures were kept at 20 °C and exposed to light–dark cycles of 12 h each. They were gently agitated each day and fresh media added twice a week to ensure healthy growth conditions. Cell cultures were prepared at concentrations of 200,000 cells/mL and exposed to either dissolved Au (1 ppb) or Au NPs (60 nm NPs, NIST 8013, 500,000 part/mL). The cells were exposed to the solutions 1 h after the initiation of the light cycle. Each exposure study was run in triplicate at 20 °C for 3 h under an ultraviolet (UV) lamp.
During the exposure, 1-mL aliquots were removed periodically for analysis. The cell number in the cultures was measured via hemocytometer at each time point. Before analysis, the algae cells were separated from the exposure media and washed with fresh media three times. Each wash cycle consisted of centrifuging the cells for 15 min at 300 g and resuspending in 1 mL of the fresh culture media (containing no NP or ionic Au). After the three washes, the cell recovery was 43.8 ± 8.6%.
The supernatant from the first cycle was analyzed for changes in the metal exposure and the washed cells were analyzed for metal cellular content. Both of these conditions are important for environmental risk assessment because metals and metal NPs undergo transformations under environmental conditions (35), while cells may be more susceptible to taking up metals that have transformed versus those that have not (36). T-tests were performed to measure the statistical differences between samples.
Results and Discussion
Cancer Cell Treatment with Cisplatin
Cisplatin is a platinum-based chemotherapy drug used to treat a variety of cancers. The effectiveness of cisplatin therapy is related to its ability to form DNA-Pt adducts, which results in cell death (30). Understanding how a population of cancer cells takes up cisplatin dictates the response to the chemotherapy. There are three molecular mechanisms of cisplatin resistance: increased DNA repair, increased cytosolic inactivation, and altered cellular accumulation (30), including decreased cellular uptake or decreased cellular export. The paired ovarian cancer cell lines A2780 and A2780/CP70 were chosen as a model to demonstrate the capability of single-cell ICP-MS. A2780 is the cisplatin-sensitive cell line from which the cisplatin-resistant A2780/CP70 cell line was derived. The A2780/CP70 cells were shown to have an increased resistance to cisplatin (IC5030 µM) in comparison to A2780 cells (IC503 µM). Reduced cisplatin uptake and increased DNA repair are the molecular mechanisms by which the A2780/CP70 cell line mitigates resistance to cisplatin (31). Thus, this paired cell line, with altered cisplatin uptake, is an attractive model for the development of measuring cisplatin at the level of a single cell.
Time course experiments were performed on A2780 and A2780/CP70 cell lines to analyze how the uptake of cisplatin changed over time within the cell population. Both cell lines were treated with 30 µM cisplatin for 1, 2, 4, and 8 h. Both cell lines displayed an overall heterogeneous distribution of cisplatin uptake, yet differences were observed between the cell lines (Figure 4). At 1 h post-cisplatin treatment, both cell lines had measurable levels of intracellular cisplatin, although the A2780 cells had a higher number of platinum-containing cells than the A2780/CP70 cells. Two hours after cisplatin treatment, both cell lines displayed an increase in the number of cells containing platinum and higher intracellular cisplatin levels. With the A2780 cells showing a larger increase compared to the A2780/CP70 cell line. At 4 h post-cisplatin treatment, the A2780 cellular population displays a wide variation in intracellular cisplatin levels. This trend continued at 8 h where highly varied cisplatin levels are observed. Interestingly, a new population of cells containing low cisplatin levels became prominent. This development suggests that there was a small population of cells that did not immediately import cisplatin and therefore displayed a partial resistance. In contrast, a steady increase in the intracellular levels of cisplatin and the distribution of cisplatin within the cell population was observed at 4 and 8 h post-treatment in the A2780/CP70 cell population.
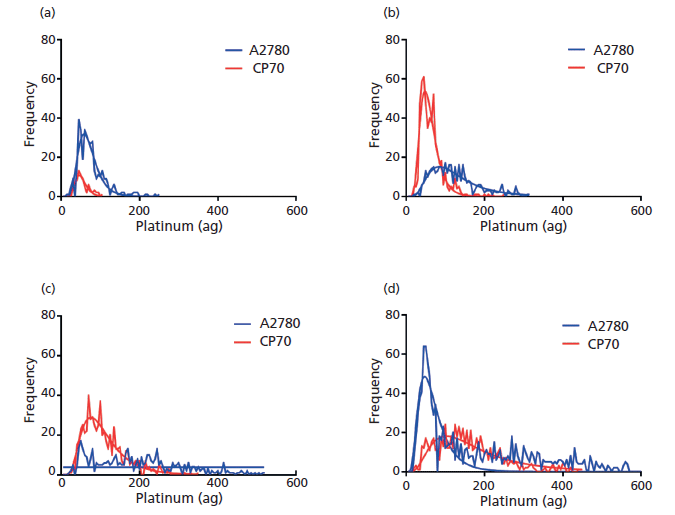
Figure 4: Single-cell ICP-MS plots demonstrating the change in cellular platinum distribution for cell lines A2780 (blue) and A2780/CP70 (red) after (a) 1-, (b) 2-, (c) 4-, and (d) 8-h post 30 µM cisplatin treatment.
Results from the time-course experiments are summarized and graphed by plotting the mean intensity for each cell line, as shown in Figure 5. As expected, the cisplatin-sensitive A2780 cells have increased cisplatin uptake in comparison to the cisplatin-resistant A2780/CP70 cells over time. These results were concordant with what has been observed previously in the literature-A2780 cells accumulate more platinum than the cisplatin-resistant cell line A2780/CP70 (31). However, when the results were plotted in this traditional manner, the intracellular variation of the cellular population was not apparent.
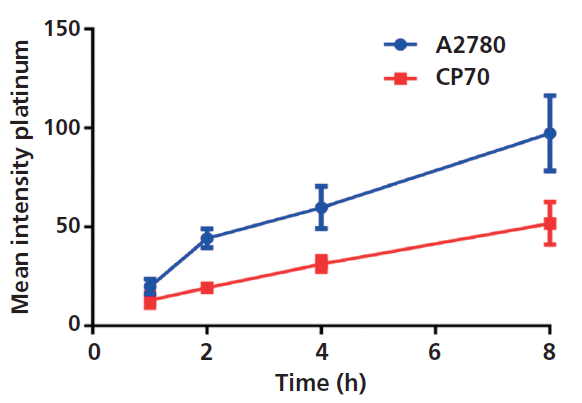
Figure 5: Mean amount of platinum per cell for the two cell lines over an 8-h period.
Algae Exposures to Au
Accurately measuring exposure levels and cellular uptake of metallic products in environmental systems can be challenging because of either low levels (32–34) or biological diversity. We used single-cell ICP-MS to quantify the metal exposure concentration, NP transformations in the media, and the metal distribution within the cells.
There algal strains (Chroomonas sp., Cryptomonas ovata, and Gonyostomum semen) were exposed to both 60-nm Au NPs and dissolved Au (Figure 6). The black bars represent the total number of cells in the culture, as measured by hemocytometer, and the gray bars represent the number of those cells that contain Au metal after 3 h of exposure (all percentages were normalized to the original number of cells at 0 h). The results show that different algae cell lines take up dissolved and NPs Au differently. Chroomonas sp. takes up both dissolved and NP Au quickly and at the same rate, with 50–60% of the cells containing Au metal in both cases. In comparison, C. ovata takes up significantly less Au in both the dissolved and NP form over this short time period, but takes up both almost equally, with about 15–20% of the cell population containing Au in both exposures. However, the largest cells, G. semen, take up significantly more NPs than dissolved Au, with around 95% of the total cell population containing Au NPs, and only 15% containing dissolved Au. This result shows that the uptake of Au is dependent both upon the algal species and the form of the metal to which is it exposed. These results also highlight that not all cells within a population necessarily take up Au, indicating that the uptake of a given metal may be heterogeneous as described in Figure 1, where this information is overlooked when using traditional techniques.
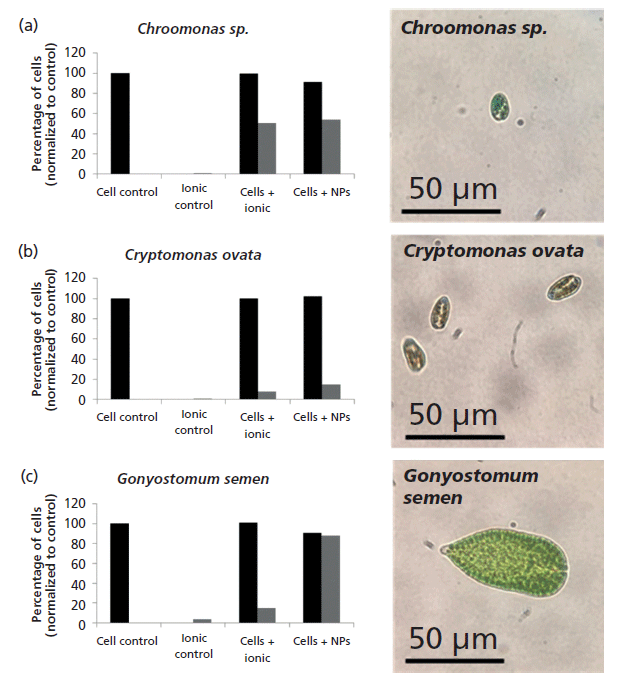
Figure 6: Percentage of cells containing Au after 3 h of exposure (a) Chroomonas sp., (b) C. ovata, and (c) G. semen.
The average mass of Au per cell was quantified using single-cell ICP-MS for both dissolved and NP exposures (Figures 7a and 7b), while the concentration and form of Au left in the media was determined by measuring the first supernatant during the washing stages (Figures 7c and 7d). Figure 7a shows that after 3 h of exposure to dissolved Au, the average mass of Au per cell was found to be greatest in G. semen (around 165 ag/cell) and least in Chroomonas sp. (110 ag/cell) even though fewer G. semen cells contained Au (Figure 6c).
In contrast, cells that were exposed to NPs contained the same amount of Au, around 1770 ag/cell (Figure 7b). These results were not significantly different between algal species or the amount of Au contained in a single NP (dashed line in Figure 7b), showing that most cells contained a single NP. Cells containing multiple NPs (n) would cause the appearance of populations of cells with average masses of n*1770 (that is, 3540 ag/cell for 2 NPs/cell, 5310 ag/cell for 3 NPs/cell, and so on).
Because of transformations (such as NP dissolution, reprecipitation, or aggregation), uptake into cells, and adsorption to the container walls, the NP or dissolved exposure concentration can change dramatically with time. This is an important factor to quantify because it can change the exposure conditions, reducing the amount of metal available to the cells. Figure 7c shows that the amount of ionic dissolved Au in the media after 3 h of exposure to algae cells was reduced compared to the ionic control. Dissolved Au is only significantly present in the ionic exposures and ionic control. The ionic concentration decreased by approximately 60% in exposed Chroomonas sp and C. ovata, and about 40% in the G. semen exposure study. The number of NPs in the media for the exposures and controls can be seen in (Figure 7d). In this case, between 10% and 40% of the NPs have been removed from the media after 3 h of exposure to cells with variations observed between cell lines. Although no transformations have occurred (mass/NP is not significantly different from controls), the exposure concentration has significantly reduced, even within the first 3 h of exposure, resulting in a dramatic change in the amount of NPs left in the media for the cells to interact with and leading to a reduced exposure concentration. This effect would be even greater over the duration of a typical toxicity test of 72 h.
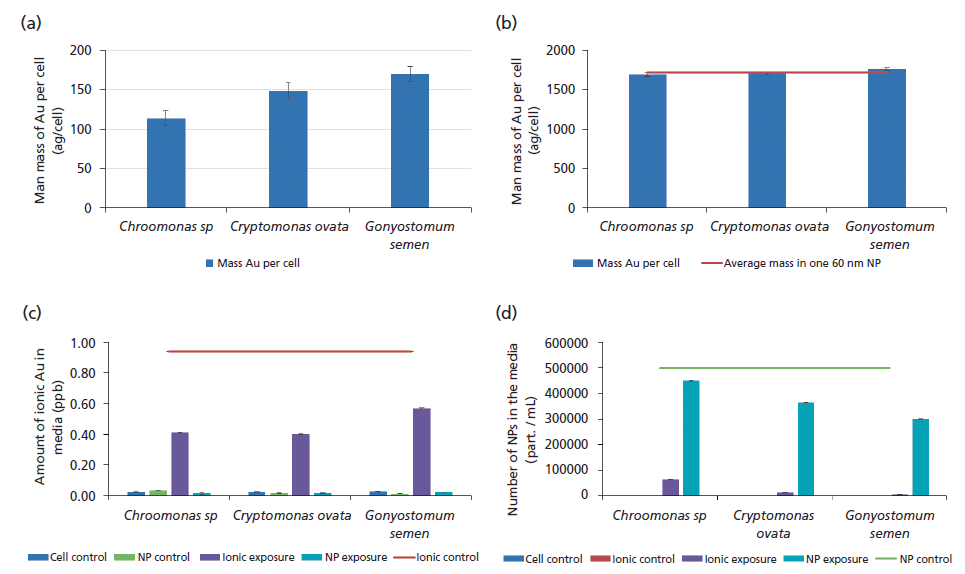
Figure 7: Mass of Au per cell after 3 h of exposure to (a) ionic exposures (blue bars) and (b) NP exposures (blue bars), compared to amount of metal in a single NP (dashed red line). The average amount of Au metal in the media for control cells, ionic control, NP control, ionic exposure, and NP exposure after 3 h: (c) ionic exposures compared to the ionic control (red line) and (d) number of NPs compared to NP controls (green line).
Conclusion
The development of single-cell ICP-MS has, for the first time, offered the ability to accurately quantify the metal concentrations within individual cells, providing new information on the mean metal content and the variation within a cell population. This method was shown to be a vital tool for assessing the specific uptake of metals by ovarian cancer cells and fresh water algae alike.
It was demonstrated that the uptake of cisplatin by the cisplatin-sensitive/resistant paired ovarian cancer cell lines A2780 and A2780/CP70, was heterogeneous within the cell populations. Cisplatin uptake increases over time in both cell lines. However, cisplatin uptake into the resistant A2780/CP70 cell line is comparatively less than the sensitive A2780 cell line. This study has shown that single-cell ICP-MS is a powerful analytical tool that has great potential in the development of new strategies for drug advancement. These strategies include the evaluation of new mechanisms to increase cisplatin uptake in cells, and the identification of novel pathways that influence cellular cisplatin uptake and depuration.
Single-cell ICP-MS has been shown to accurately quantify both the changes in exposure concentration and dose (amount taken-up) of dissolved and NP Au to a variety of fresh water algal species. The uptake was dependent on both the metal phase and algal species. The scope of information gained by single-cell ICP-MS studies will aid in the risk assessment of metals and the development of regulations that govern NP concentrations in the environment, by providing the only current method which allows for the direct quantification of the mass of a metal within individual cells.
Acknowledgments
This research was funded in part by the Intramural Research Program of the National Institute of Health (NIH), National Institute on Minority Health and Health Disparities (NIMHD), and the SmartState Centre for Environmental Nanoscience and Risk (CENR), at the University of South Carolina.
References
(1) D.K. Button, Microbiol. Rev. 49(3), 270–297 (1985).
(2) M.G.V. Heiden, L.C. Cantley, and C.B. Thompson, Science 324(5930), 1029–1033 (2009).
(3) P. Vaupel, F. Kallinowski, and P. Okunieff, Cancer Res. 49(23), 6449–6465 (1989).
(4) M. Honti, V. Istvanovics, and A.S. Kovacs, Sci. Total Environ. 408(20), 4712–4721 (2010).
(5) W.G. Sunda and S.A. Huntsman, Sci. Total Environ. 219(2–3), 165–181 (1998).
(6) E.C. Foulkes, Proc. Soc. Exp. Biol. Med. 223(3), 234–240 (2000).
(7) T.A. Davis, B. Volesky, and A. Mucci, Water Res. 37(18), 4311–4330 (2003).
(8) M.L. Guo, H.Z. Sun, H.J. McArdle, L. Gambling, and P.J. Sadler, Biochemistry 39(33), 10023–10033 (2000).
(9) F. Piccinno, F. Gottschalk, S. Seeger, and B. Nowack, J. Nanopart. Res. 14(9), 1–11 (2012).
(10) T.Y. Sun, F. Gottschalk, K. Hungerbuhler, and B. Nowack, Environ. Pollut. 185, 69–76 (2014).
(11) M. Akrami, S. Balalaie, S. Hosseinkhani, M. Alipour, F. Salehi, A. Bahador, and I. Haririan, Sci. Rep. 6, 12 (2016).
(12) Y. Li, J. Niu, C. Zhang, Z. Wang, M. Zheng, and E. Shang, Progress in Chemistry 26(2–3), 436–449 (2014).
(13) V. Shah, S. Shah, H. Shah, F.J. Rispoli, K.T. McDonnell, S. Workeneh, A. Karakoti, A. Kumar, and S. Seal, Plos One 7(10), e47827 (2012).
(14) W.J. Stark, P.R. Stoessel, W. Wohlleben, and A. Hafner, Chem. Soc. Rev. 44(16), 5793–5805 (2015).
(15) J. Park, N.R. Kadasala, S.A. Abouelmagd, M.A. Castanares, D.S. Collins, A. Wei, and Y. Yeo, Biomaterials 101, 285–295 (2016).
(16) V. Khare, A. Singh, G. Mahajan, N. Alam, S. Kour, M. Gupta, A. Kumar, G. Singh, S.K. Singh, A.K. Saxena, D.M. Mondhe, and P.N. Gupta, Eur. J. Pharm. Sci. 92, 183–193 (2016).
(17) N.D. Eljack, H.Y.M. Ma, J. Drucker, C. Shen, T.W. Hambley, E.J. New, T. Friedrich, and R.J. Clarke, Metallomics 6(11), 2126–2133 (2014).
(18) Y.G. Jiang, Y.L. Zhu, Z.L. Hu, A.P. Lei, and J.X. Wang, Ecotoxicology 25(7), 1417–1425 (2016).
(19) J.F. Cheng, H.C. Qiu, Z.Y. Chang, Z.M. Jiang, and W.K. Yin, Springerplus 5, (2016).
(20) F. Perreault, A. Oukarroum, S.P. Melegari, W.G. Matias, and R. Popovic, Chemosphere 87(11), 1388–1394 (2012).
(21) A.E. Egger, C. Rappel, M.A. Jakupec, C.G. Hartinger, P. Heffeter, and B.K. Keppler, J. Anal. At. Spectrom. 24(1), 51–61 (2009).
(22) N.S. Taylor, R. Merrifield, T.D. Williams, J.K. Chipman, J.R. Lead, and M.R. Viant, Nanotoxicology 10(1), 32–41 (2016).
(23) O.S. Wolfbeis, Chem. Soc. Rev. 44(14), 4743–4768 (2015).
(24) H.Q. Doan, G.M. Chinn, and R.R. Jahan-Tigh, J. Invest. Dermatol. 135(12), 3204–3204 (2015).
(25) N. Leelatian, D.B. Doxie, A.R. Greenplate, B.C. Mobley, J.M. Lehman, J. Sinnaeve, R.M. Kauffmann, J.A. Werkhaven, A.M. Mistry, K.D. Weaver, R.C. Thompson, P.P. Massion, M.A. Hooks, M.C. Kelley, L.B. Chambless, R.A. Ihrie, and J.M. Irish, Cytometry Part B-Clinical Cytometry 92(1), 68–78 (2017).
(26) D.R. Bandura, V.I. Baranov, O.I. Ornatsky, A. Antonov, R. Kinach, X.D. Lou, S. Pavlov, S. Vorobiev, J.E. Dick, and S.D. Tanner, Anal. Chem. 81(16), 6813–6822 (2009).
(27) S.C. Bendall, G.P. Nolan, M. Roederer, and P.K. Chattopadhyay, Trends Immunol. 33(7), 323–332 (2012).
(28) G. Schaldach, L. Berger, I. Razilov, and H. Berndt, J. Anal. At. Spectrom. 17(4), 334–344 (2002).
(29) H. Matusiewicz, M. Slachcinski, B. Almagro, and A. Canals, Chem. Anal. (Warsaw, Pol.) 54(6), 1219–1244 (2009).
(30) L. Amable, Pharmacol. Res. 106, 27–36 (2016).
(31) R.J. Parker, A. Eastman, F. Bostickbruton, and E. Reed, J. Clin. Invest. 87(3), 772–777 (1991).
(32) F. Gottschalk, E. Kost, and B. Nowack, Environ. Toxicol. Chem. 32(6), 1278–1287 (2013).
(33) I. Mahapatra, T.Y. Sun, J.R.A. Clark, P.J. Dobson, K. Hungerbuehler, R. Owen, B. Nowack, and J. Lead, J. Nanobiotechnol. 13(1), 1–14 (2015).
(34) F. Gottschalk, T. Sun, and B. Nowack, Environmental Pollution 181, 287–300 (2013).
(35) R.C. Merrifield, C. Stephan, and J. Lead, Environ. Sci. Technol. 51(6), 3206–3213 (2017).
(36) M.N. Croteau, S.K. Misra, S.N. Luoma, and E. Valsami-Jones, Environ. Sci. Technol. 45(15), 6600–6607 (2011).
(37) R.C. Merrifield , C. Stephan, and J.R. Lead, Environ. Sci. Technol. 52(4), 2271–2277 (2018).
Ruth Merrifield is with the Center for Environmental NanoScience and Risk (CENR), Department of Environmental Health Sciences, Arnold School of Public Health, at the University of South Carolina in Columbia, South Carolina and PerkinElmer, Inc., in Shelton, Connecticut. Lauren Amable is with the Division of Intramural Research, National Institute on Minority Health and Health Disparities, National Institutes of Health in Bethesda, Maryland. Chady Stephan is with PerkinElmer, Inc. Direct correspondence to: Chady.Stephan@perkinelmer.com or Ruth.Merrifield@perkinelmer.com

Geographical Traceability of Millet by Mid-Infrared Spectroscopy and Feature Extraction
February 13th 2025The study developed an effective mid-infrared spectroscopic identification model, combining principal component analysis (PCA) and support vector machine (SVM), to accurately determine the geographical origin of five types of millet with a recognition accuracy of up to 99.2% for the training set and 98.3% for the prediction set.
Authenticity Identification of Panax notoginseng by Terahertz Spectroscopy Combined with LS-SVM
In this article, it is explored whether THz-TDS combined with LS-SVM can be used to effectively identify the authenticity of Panax notoginseng, a traditional Chinese medicine.