Solvent Assisted Ionization Mass Spectrometry for Screening and Quantification of Counterfeit Drugs
Special Issues
Because of the wide variety of ways counter drugs have been entering the pharmaceutical supply chain, there is an imminent need for quick and inexpensive methods to identify drug components and quantify active ingredients. Here, we report results illustrating the screening properties of solvent assisted ionization mass spectrometry (SAI-MS) and the quantitative properties of liquid chromatography (LC)-SAI-MS. These methods offer high sensitivity, versatility, and in combination, rapid turnaround time. Suspect samples of fexofenadine hydrochloride and hydroxychloroquine were rapidly screened and compared to their legal counterparts using SAI-MS.
Because of the wide variety of ways counterfeit drugs have been entering the pharmaceutical supply chain there is an imminent need for quick and inexpensive methods to identify drug components and quantify active ingredients. Here, we report results illustrating the screening properties of solvent assisted ionization mass spectrometry (SAI-MS) and the quantitative properties of liquid chromatography (LC)–SAI-MS. These methods offer high sensitivity, versatility, and in combination, rapid turnaround time. Suspect samples of fexofenadine hydrochloride and hydroxychloroquine were rapidly screened and compared to their legal counterparts using SAI-MS.
In 1987 the United States government passed the Prescription Drug Marketing Act (PDMA), which established legal safeguards for prescription drug distribution (1). With the implementation of this law, the government intended to reduce the public health risk that would occur because of adulterated and mishandled counterfeit drug products entering the marketplace. However, because of the wide availability of on-line pharmacies, counterfeit medications still enter the US supply chain.
Counterfeit drugs, both branded and generic, may include harmful filler ingredients, an insufficient or lack of active ingredients, or both. The extent of the counterfeit drug problem has yet to be determined, however it is significant as a Food and Drug Administration (FDA) drug sting in 2013 shut down 1677 “Canadian pharmacy” websites selling drugs to US patients (2). The World Health Organization (WHO) has stated the need for quick and inexpensive screening methods not to replace the accepted pharmacopeial or legally accepted test methods, but rather to identify products that need further investigation (3).
Mass spectrometry (MS) is being used extensively in the detection of counterfeit drugs (4-6). Gas chromatography (GC)–MS is commonly used for analyzing suspect drug samples. However, for optimum GC–MS analyses, time-consuming sample preparation procedures, including extraction and derivatization, are often required in addition to the GC separation (7,8). Researchers have begun to use liquid chromatography (LC) coupled with tandem mass spectrometry (MS-MS) for faster sample analysis (4,5). Electrospray ionization (ESI) is commonly interfaced with LC–MS and LC–MS-MS; however, ambient ionization techniques such as desorption electrospray ionization (DESI) (9) and atmospheric solids analysis probe (ASAP) (10) are increasing in popularity because of the lack of sample preparation required.
Here we explore the potential of solvent assisted ionization (SAI)-MS for the detection and quantification of counterfeit pharmaceuticals. SAI has similar utility to ESI, but requires no high voltage (12). Rather, as is the case with other inlet ionization methods, ionization occurs in the heated inlet tube linking atmospheric pressure and the first vacuum region of the mass analyzer (12-14). Analytes are dissolved in an appropriate solvent and introduced into a heated inlet tube of a mass spectrometer through a fused-silica capillary. Because the entrance and exit ends of the fused-silica tube are at different pressures, solution is drawn from atmospheric pressure into the low pressure of the inlet tube without the need for a pump. The fused-silica capillary can also be coupled to a LC column. Previous natural and synthetic steroid analyses have shown quantification down to sub-parts-per-billion levels using LC–SAI-MS (15). In this study, the qualitative screening capabilities of SAI and quantitative properties of LC–SAI-MS are determined for several standards as well as drugs purchased from international pharmacies.
ExperimentalMaterials
High performance liquid chromatography (HPLC)-grade methanol and water, reagent grade formic acid, and drug standards clindamycin, cimetidine, hydroxychloroquine, sildenafil, and fexofenadine hydrochloride were purchased from Sigma Aldrich. The suspect drug sample fexofenadine hydrochloride was purchased from a pharmacy in Vietnam. A suspect drug sample of hydroxychloroquine was purchased from an on-line pharmacy (Canada Drugs).
Methods
For the detection of the active ingredients in the drugs, each standard or sample was dissolved in 1:1 water-methanol. Drug standards were diluted serially by factors of 10. The calibration standards covered a range of 59-472 ppb, 18-300 ppb, 39-620 ppb, and 63-500 ppb for fexofenadine hydrochloride, hydroxychloroquine, sildenafil, and clindamycin, respectively. For the detection of the active ingredients in the suspect samples, each tablet was dissolved in 1:1 water-methanol and the solution was sonicated for 10 min. Each solution was filtered using polytetrafluoroethylene (PTFE) membrane filters (Sigma Aldrich), and 100-µL aliquots of each concentrated solution were diluted to a final concentration of 200 ppb for hydroxychloroquine and 100 ppb for fexofenadine hydrochloride. For all LC-MS analyses, 10 µL was injected on-column using a mobile-phase flow rate of 80 µL/min.
LC–MS
A Michrom Bioresources liquid chromatograph (Bruker) was interfaced with an Orbitrap Exactive (Thermo Fisher Scientific) mass spectrometer. A 100 mm × 1.0 mm, 5-µm Viva C18 column (Restek) was used for all analyses. The column was connected to a 15-cm length of fused-silica tubing (110 µm i.d., 360 µm o.d.) with the exit end of the fused silica inserted into the heated mass spectrometer inlet tube (12,15). Solvent A of the mobile phase consisted of 0.1% formic acid in water, and solvent B consisted of 0.1% formic acid in acetonitrile. The gradient conditions for 10-µL injections were as follows: 0-2 min 95% A, 3-7 min 40% A, 8-8.5 min 10% A, and 9-11.5 min 95% A. Previous work has shown that 450 °C on the inlet transfer tube of the mass spectrometer provides the highest ion current for drug compounds (12). However, a high inlet temperature also results in high ion abundance for background compounds (12). Hence, for the work reported here, the inlet temperature was maintained at 375 °C as a compromise between the highest analyte ion abundance for detection of singly charged positive ions and minimal background interference. The instrument parameters were tuned automatically using Thermo Scientific Xcalibur software.
Results and Discussion
SAI-MS Quantification
Standard samples of sildenafil, clindamycin, and fexofenadine hydrochloride were analyzed using LC–SAI-MS to determine the reproducibility and if linear calibration curves are obtained using LC–SAI-MS. Figure 1 shows the LC–SAI-MS results obtained from an 87.5 ppb injection of a sildenafil standard. Figure 1a shows the base peak chromatogram for this injection and Figure 1b shows a single acquisition at the retention time of 8.35 min. The molecular formula of sildenafil, C22H30N6O4S, is within 2 mmu of the measured mass of the [M+H]+.

Figure 1: Results from a 10-µL injection of an 87.5 ppb solution of sildenafil in 1:1 water-methanol with a mobile-phase flow rate of 80 µL/min: (a) base peak chromatogram and (b) a single acquisition mass spectrum acquired at 8.35 min.
The limit of quantitation (LOQ) of the drug standards discussed here using 10-µL injections is low parts per billion. Figure 2 illustrates a five-point linear calibration curve obtained using triplicate injections of sildenafil, with concentrations ranging from 38.5 ppb to 620.0 ppb. This resulted in a coefficient of determination (r2) exceeding 0.993. The error bars provided in Figure 2 are calculated for triplicate injections. The [M+H]+ ion signal was only considered if it fell within a narrow retention time (±0.1 min) and mass (± 0.002 m/z units) window for injections of a known parts-per-million concentration standard.
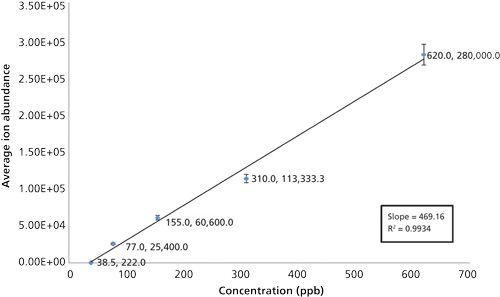
Figure 2: Plot of the average [M+H]+ ion abundance versus the concentration of sample injected for each run. Triplicate injections of 39, 77, 155, 310, and 620 ppb of sildenafil using LC–SAI-MS were analyzed on the mass spectrometer. The linearity constant exceeded 0.993 (r2 = 0.9934). Error bars are provided, calculated from the triplicate injections.
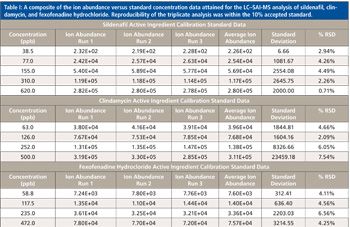
In addition to the sildenafil standards, triplicate injections of clindamycin and fexofenadine hydrochloride standards resulted in calibration curves with linearity that also exceeded r2 of 0.996. Table I provides the composite of the ion abundance versus standard concentration data obtained for the LC–SAI-MS analysis of the three drug standards. Blank runs before each standard analysis provided no [M+H]+ ion for any of the drug standards within the expected retention time and mass windows. To further illustrate the capability of LC–SAI-MS, two analytes, sertraline hydrochloride (660 ppb) and clindamycin (587 ppb), were prepared and multiple injections were acquired with blanks between each run. No sample degradation or signal loss was observed.
Rapid Suspect Sample Analysis Using SAI-MS
To demonstrate the feasibility of using LC–SAI-MS to analyze suspect drugs, a sample of hydroquin, an antimalarial product of Sun Pharma Sikkim manufactured in India, was purchased from an on-line pharmacy. A set of hydroxychloroquine standards were prepared and 10 µL of each standard was injected onto the LC column using a mobile-phase flow rate of 80 µL/min. Figure 3 shows a five-point calibration curve obtained using LC-SAI-MS for triplicate 10 µL injections of the hydroxychloroquine standard, with concentrations ranging from 19 ppb to 620 ppb.
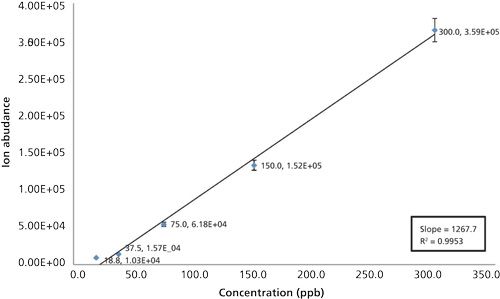
Figure 3: Plot of the average [M+H]+ ion abundance versus the concentration of hydroxychloroquine sample injected for each run. Triplicate injections of 19, 38, 75, 150, and 300 ppb of hydroxychloroquine using LC–SAI-MS were performed. The linearity constant exceeded 0.995 (r2 = 0.9953). The error bars were calculated from the triplicate injections.
Three tablets of the suspect hydroquin were crushed, dissolved in 1:1 water-methanol, and serially diluted to an expected final concentration of 200 ppb each. Each sample was filtered and injected onto the LC column. The calibration standards were run in duplicate and each sample was run in triplicate. The resulting calculated concentration of the three suspect hydroquin samples using the external calibration were 225, 223, and 226 ppb. Therefore, taking into account the calculated standard error, the samples were considered authentic.
A suspect sample of fexofenadine hydrochloride (trademarked as Allegra) was purchased from Vietnam. A set of fexofenadine standards (Sigma Aldrich) ranging in concentration from 50 ppb to 400 ppb were prepared, and 10 µL of each standard was injected onto the LC column using a mobile-phase flow rate of 80 µL/min. A five-point calibration curve was prepared, with linearity exceeding 0.998. Three tablets of the suspect fexofenadine were crushed, dissolved in 1:1 water-methanol, and serially diluted to an expected final concentration of 100 ppb. The calibration standards were run in duplicate and the samples in triplicate. The concentrations of the suspect samples were determined to be 47, 43, and 48 ppb, respectively. The suspect samples were well outside of the calculated standard error and therefore were well below the expected concentration of active ingredient of 200 ppb, which suggests that the suspect samples of fexofenadine are counterfeit.
Comparison of ESI and SAI
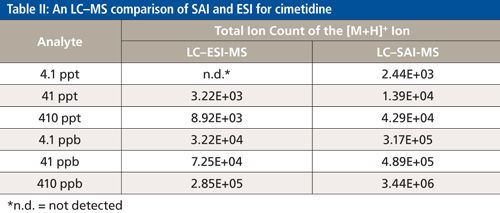
LC–ESI-MS and LC–SAI-MS were compared (using the same mass spectrometer) for standard solutions of cimetidine, C10H16N6S. The LC conditions and the tune parameters of the mass spectrometer were the same except that, for ESI, the mass spectrometer inlet temperature was lowered from the optimum SAI temperature of 375 °C to 325 °C. Next, 10-µL volumes of cimetidine in 1:1 water-methanol containing 4.1, 41, 410, 4100, 41,000, and 410,000 parts per trillion (ppt) were injected onto the column at a mobile-phase flow rate of 80 µL/min. The m/z [M+H]+ ion of 253.1229 was detected at 4.1 ppt with SAI-MS, but not detected with ESI-MS. The lowest concentration detected for ESI-MS was 41 ppt. Again, the [M+H]+ ion signal was considered if it fell within a narrow retention time (±0.1 min) and mass (± 0.002 m/z units) window of a known, high parts per million standard. Table II shows that the ion counts for standards are 10× higher using SAI-MS compared to ESI-MS.
Conclusions
LC-SAI-MS is shown to be suitable for the low-level detection and quantification of the drug standards sildenafil, clindamycin, and fexofenadine hydrochloride. LC-SAI-MS is proven to be suitable for suspect sample analysis, which includes hydroxychloroquine and fexofenadine. The limit of detection (LOD) of the drug standards, using infusion SAI, is determined to be in the low parts per trillion range. Lower limits of quantitation were 100-300 pg. LC-SAI-MS is shown to provide excellent linearity within the calibrated range. Comparative studies between LC-ESI-MS and LC-SAI-MS yielded favorable results for SAI. Using the same instrument parameters, 10-µL injections of cimetidine standards, ranging in concentration from 4.1 ppt to 441 ppb, highlighted the sensitivity of LC-SAI-MS compared to LC-ESI-MS.
Acknowledgments
We are grateful for funding from NSF CHE-1112289 and the Everett Houghton grant at the University of the Sciences.
References
(1) World Health Organization, “Medicines: Spurious/falsely-labelled/falsified/counterfeit (SFFC) medicines, Fact sheet No275,” available at: http://www.who.int/mediacentre/factsheets/fs275/en/(accessed January 7, 2015).
(2) Daily Mail Reporter, “Drug Sting Shuts Down 1,677 ‘Canadian Pharmacy’ Websites for Selling Counterfeit Drugs to U.S. Patients,” http://www.dailymail.co.uk/news/article-2357108/Drug-sting-shuts-1-677-Canadian-pharmacy-websites-selling-counterfeit-drugs.html(accessed November 21, 2014).
(3) World Health Organization, “Essential Medicines and Health Products: General Information on Counterfeit Medicines,” Available at: http://www.who.int/medicines/services/counterfeit/overview/en/(accessed January 7, 2015).
(4) C. Vanhee, G. Moens, E. Deconinck, and J.O. De Beer, Drug Test Analysis 6, 964-968 (2014).
(5) M.J. Culzoni, P. Dwivedi, M.D. Green, P.N. Newton, and F.M. Fernandez, Med. Chem. Commun. 5, 9-19 (2014).
(6) S.E. Hall and C.C. Mulligan, Current Trends in Mass Spectrometry, supplement to LCGC North Am., October 2014, 8-13 (2014).
(7) S. Singh, B. Prasad, A.A. Savaliya, R.P. Shah, V. Gohil, and A. Kaur, TrAC, Trends Anal. Chem.28, 13-28 (2009).
(8) E. Deconinck, M. Canfyn, P.Y. Sacré, S. Baudewyns, P. Courselle, and J.O. De Beer, J. Pharm. Biomed. Anal. 70, 60-70 (2012).
(9) F.M. Fernandez, R.B. Cody, M.D. Green, C.Y. Hampton, R. McGready, S. Sengaloundeth, N.J. White, and P.N. Newton, ChemMedChem 1, 702-705 (2006).
(10) C.N. McEwen, R.G. McKay, and B.S. Larsen, Anal. Chem.77, 7826-7831 (2005).
(11) J.M. Wells, M.J. Roth, A.D. Keil, J.W. Grossenbacher, D.R. Justes, G.E. Patterson, and D.J. Barket, J. Am. Soc. Mass Spectrom.19, 1419-1424 (2008).
(12) V. Pagnotti, N. Chubatyi, and C.N. McEwen, Anal. Chem. 83, 3981-3985 (2011).
(13) S. Trimpin, E.D. Inutan, T.N. Herath, and C.N. McEwen, Mol. Cell. Proteomics 9, 362 (2010).
(14) C.N. McEwen, V.S. Pagnotti, E.D. Inutan, and S. Trimpin, Anal. Chem.82, 9164 (2010).
(15) N. Chubatyi, V. Pagnotti, C.M. Bentzley, and C.N. McEwen, Rapid Commun. Mass Spectrom.26, 887-892 (2012).
Lyla Hassan and Charles N. McEwen are with the University of the Sciences in Philadelphia, Pennsylvania. Direct correspondence to: c.mcewen@usciences.edu
Advanced Raman Spectroscopy Method Boosts Precision in Drug Component Detection
April 7th 2025Researchers in China have developed a rapid, non-destructive Raman spectroscopy method that accurately detects active components in complex drug formulations by combining advanced algorithms to eliminate noise and fluorescence interference.