Article
Special Issues
Spectroscopy Supplements
Targeted Metabolomics Analysis of Type 2 Diabetes Serum Samples Using Mass Spectrometry and a Standardized Quantitative Method
Author(s):
An important advantage of standardized methods is that they enable comparability between laboratories and across studies. In this work, the author used a standardized targeted kit to demonstrate the accuracy, sensitivity, and reproducibility of the approach, analyzing serum samples obtained from type 2 diabetes study subjects and healthy controls.
Targeted metabolomics analysis can be performed with standardized assay setups. One great advantage of standardized methods is that they enable comparability between laboratories and across studies. This advantage is especially crucial when focusing on large, longitudinal cohort studies and when comparing data across different centers. We used a standardized targeted kit to demonstrate the accuracy, sensitivity, and reproducibility of the approach. We employed this method to analyze serum samples from type 2 diabetes (T2D) study subjects and healthy controls. We observed that several metabolites were significantly altered between the T2D study subjects and the healthy controls, with these alterations appearing to agree with previous reports of certain metabolites being associated with an increased likelihood of T2D, obesity, or differential changes in response to oral glucose tolerance test. We deemed the results obtained to be highly reproducible.
Metabolomics is an innovative scientific field for understanding and exploring the body–cell homeostasis. The entire collection of low-weight molecules that enable the maintenance, growth, and normal function of cells and whole organisms is known as the metabolome (1), with metabolites acting as markers of biochemical, physiological, and pathological reactions. By monitoring metabolites, the different pathways that develop within a living cell, tissue, or organism can be divulged (2).
Metabolites have diverse, far-reaching biochemical effects, including the ability to function as co-substrates and regulate post-translational modifications that affect protein activities (3,4). Metabolites also play a role in epigenetic regulations and maintenance of the pluripotency of embryonic stem cells (5–7). Furthermore, hormones and fatty acids can interact with plasma proteins to facilitate their transportation in the bloodstream (8).
State-of-the-art developments in bioinformatics and analytical techniques, as well as the integration of orthogonal biological approaches, allow the analysis of systems-level effects of metabolites. Subtle changes in metabolic pathways can be detected, providing insights into the mechanisms of many physiological conditions and diseases. For example, plasma trimethylamine N-oxide (TMAO) and urinary taurine have recently been identified as markers of cardiovascular disease (9). Using a targeted metabolic approach covering a wide range of metabolites and a large number of study participants, the research identified sugar metabolites, amino acids, and choline-containing phospholipids to be associated with risk of T2D (10). To correlate a specific metabolite to a specific phenotype, the metabolite must be accurately identified and reproducibly quantified, and its propensity as a biomarker must be validated.
Biomarker validation in particular can be challenging, because of the difficulties in measuring subtle differences in metabolite concentration. Major advancements in liquid chromatography–mass spectrometry (LC–MS) automation have occurred with the inception of commercial kits, which can reduce costs, increase throughput, provide greater reliability, and improve reproducibility.
MS is a fitting platform to analyze the metabolome since it is highly sensitive and robust, and provides high reproducibility. The metabolomics sample, containing a mixture of a diverse class of metabolites, can be introduced directly to the mass spectrometer, or undergo a preceding separation step (such as liquid or gas chromatography) before analysis. Thousands of ions can be present in metabolomic samples, so chromatographic separation is often used to minimize signal suppression and allows for greater sensitivity for accurate metabolite identification and quantitation.
Metabolomics contributes to a paradigm shift toward understanding the cellular metabolism, but has also revealed the importance of the microbiome and its effect on human health and disease (11,12). In fact, metabolomics has identified a number of unexpected biochemical causes for complex, chronic diseases such as cancer, atherosclerosis, and diabetes (13,14).
Type 2 diabetes (T2D) is defined as an increase of blood glucose levels caused by a pancreatic β-cell dysfunction and insulin resistance without evidence for specific cause (15). A prediabetic state, such as impaired fasting glucose (IFG) or impaired glucose tolerance (IGT), with marginally elevated blood glucose levels may precede T2D for many years (16).
T2D is among the most prevalent chronic diseases (17), and its rate is expected to continue increasing (18). Complications are more likely to occur with increased duration of the disease, so a means of early detection (even before hyperglycemia) has become a necessity. Technologies are now emerging that allow the assessment of a wide range of metabolites (19–22), presenting opportunities to observe changes in biochemical pathways. Through the monitoring of these pathways, greater insight into the biological mechanisms of early-stage metabolic disorders can be gleaned. By comparing the changes in metabolites between predisposed and healthy individuals, the metabolites involved in disease mechanisms can be discovered (23,24). A change in these metabolite levels can indicate and identify biomarkers, which could enable preventative actions.
There has been significant progress made in metabolomics through the continual improvements in instrument performance, as well as better experimental designs and innovative sample preparations. LC–MS approaches are becoming even more quantitative with the use of kits that provide standardization, automation, and advantages in interlaboratory reproducibility (20,21,25). The modern challenge is to now move beyond the identification of metabolites and their use as biomarkers. Instead, analysts are attempting to establish the direct physiological roles that metabolites have, and how they are involved in metabolic networks by determining how changes in their concentrations are linked to a variety of phenotypic outcomes. The future of metabolomics looks set to combine traditional biochemical methods with cutting-edge innovations to develop workflows that can assign a biological meaning to varying levels of metabolites, which can then be used to discover the mechanisms of diseases.
Experimental
Sample Preparation
Sample preparation for metabolite measurements with the AbsoluteIDQ p400 HR kit (Biocrates Life Sciences AG) was performed according to the manufacturer's protocol. The kit includes a 96-well plate, calibration standards, quality controls samples, internal standards, test-mixes for system suitability test, acquisition and quantitation methods, protocol for sample preparation, and the MetIDQ software package. Briefly, 10 µL of plasma sample was pipetted onto the 96-well plate containing the internal standards. Following derivatization, metabolites and internal standards were extracted and diluted for subsequent analysis. A total of six samples (three serum samples from T2D study subjects and three serum samples from healthy controls) were analyzed.
Metabolite Measurements
Metabolites were measured with a targeted metabolomics approach, using the AbsoluteIDQ p400 HR kit and a Thermo Scientific Vanquish ultrahigh-pressure liquid chromatography (UHPLC) system, coupled to a Thermo Scientific Q Exactive HF Orbitrap mass spectrometer. The method allows for the quantitation of up to 408 endogenous metabolites across 11 different metabolite classes. Amino acids and biogenic amines were analyzed by liquid chromatography–mass spectrometry (LC–MS), whereas acylcarnitines, phosphatidylcholines, lysophosphatidylcholines, diglycerides, triglycerides, sphingomyelins, ceramides, cholesteryl esters, and hexoses were analyzed by flow injection analysis–mass spectrometry (FIA–MS). The automated technical validation of the analyzed kit plate to approve the validity of the run and provide verification of the actual performance of the applied quantitative procedure including instrumental analysis was performed using MetIDQ software provided with the kit. This validation was achieved based on the obtained results; defined acceptance criteria for blank, zero samples, calibration standards, and curves; low-, medium-, and high-level quality control (QC) samples; and measured signal intensity of internal standards over the plate.
Data Processing
Metabolites were quantified according to the manufacturer's protocol, using the MetIDQ software for targeted metabolomic data processing and management. Statistical analysis was performed with the MetIDQ StatPack module.
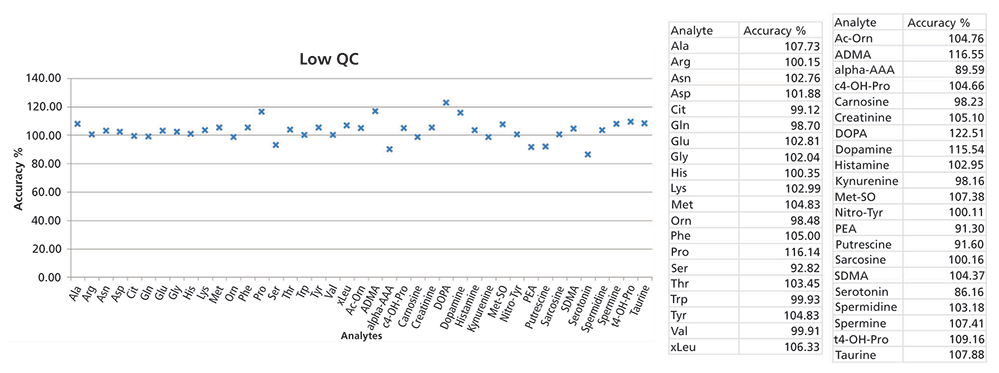
Figure 1: Data from the low-level QC samples in LC–MS showing the obtained accuracy (measured vs. theoretical values). Medium- and high-level QC measurements were also performed and evaluated.
Results and Discussion
Figure 1 shows data from the low-level QC sample of the kit analyzed using LC–MS. The measured values were compared with theoretical values to determine the accuracy of the method. The accuracy range was 86–122% for the low-level QC sample. Similar results were obtained for the medium- and high-level QC samples. The accuracy range was 89–114% for the medium-level QC sample, and 95–118% for the high-level QC sample.
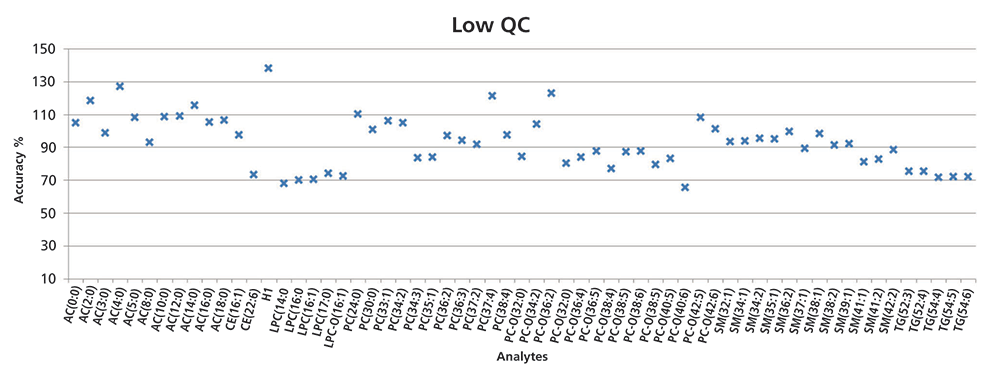
Figure 2: Data from the low-level QC sample in FIA–MS showing the obtained accuracy (measured vs. theoretical values). Medium- and high-level QC measurements were also performed and evaluated.
Figure 2 shows the data from the low QC sample analyzed using FIA–MS. Again, the measured values were compared with the theoretical values, and the accuracy of the method was determined. The accuracy range was 65–138% for the low-level QC sample. Overall, for all spiked QC samples (low-, medium- and high-level samples), the accuracy of the FIA–MS analysis for 84% of the metabolite measurements was well within the 70–130% range (Figure 3).
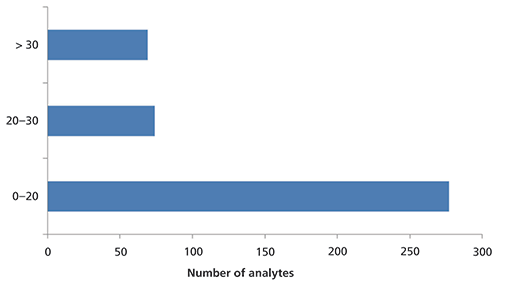
Figure 3: Summary from all QC samples showing the percent difference between the measured and theoretical values for all analytes in the QC samples in FIA–MS. Data are displayed for two low-, two medium-, and three high-level QC samples (a total of seven QC samples).
The low- and high-level QC samples were extracted in triplicate and the medium-level QC samples were extracted four times, then subsequently analyzed to assess the reproducibility of the method. Relative standard deviation (RSD) values were calculated for all metabolites present in the QC samples; the results are displayed in Figure 4. For the LC–MS analysis, the RSD was within 15%, whereas, for the FIA–MS analysis, it was within 20% for all metabolites. In both LC–MS and FIA–MS, excellent reproducibility was observed, and the RSD values for repeated analyses were well within 10% for 90% of the analytes in both the LC–MS and FIA–MS analyses.
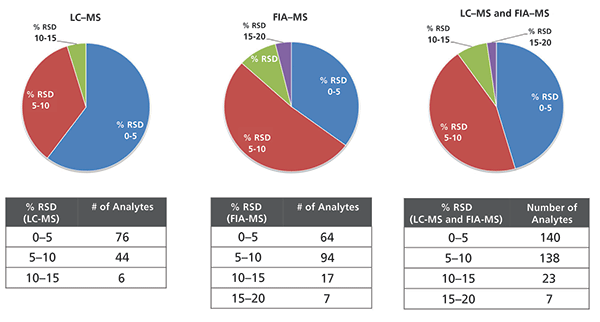
Figure 4: Pie charts showing the calculated RSD values from repeated analyses (well replicates) of the QC samples (low-, medium- and high-level combined) The tables show the details of how the pie charts were constructed.
The method was employed to analyze serum samples from T2D study subjects aiming to identify changes in metabolite concentrations between the two study groups. Each serum sample (a total of six samples; three serum samples from T2D study subjects and three serum samples from healthy controls) was extracted using the kit in triplicate. The reproducibility of the analytical method was evaluated by calculating the RSD values for all metabolites detected in the samples. The data were combined for both LC–MS and FIA–MS. The RSD for the vast majority (90%) of metabolites was <20%, whereas for 81% of all metabolites detected the RSD values were <15%. These results demonstrated the very good reproducibility of the method for both LC–MS and FIA–MS (Figure 5).
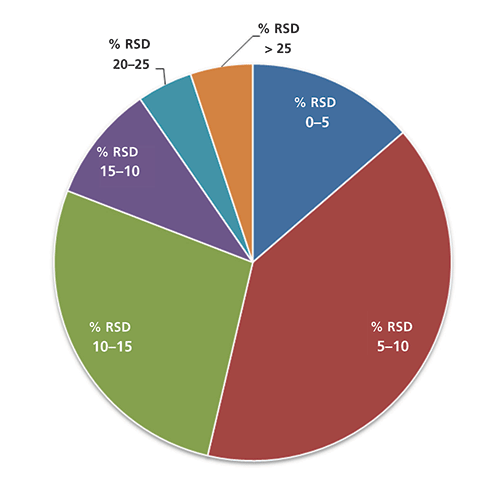
Figure 5: Pie chart showing the observed %RSD values in the serum samples. Each serum sample (a total of six samples; three serum samples from T2D study subjects and three serum samples from healthy controls) was extracted on the kit in triplicate. The data are combined for both LC–MS and FIA–MS.
Figure 6 shows representative examples of metabolites whose concentrations were significantly altered (p < 0.001) between the two groups. For some metabolites, the concentrations were higher in the T2D study subjects, whereas, for other metabolites, the concentration was lower in the T2D subjects when compared to the healthy controls. The p-values based on Student's t-test are also indicated in each graph. For instance, we observed increased concentrations of diglycerides DG (41:1) (p-value [t-test] = 5.09E-09), cholesterol ester CE (22:6) (p-value [t-test] = 2.85E-07), sphingomyelin SM (36:1) (p-value [t-test] = 1.00E-06), triglyceride TG (56:7) (p-value [t-test] = 6.00E-06), acylcarnitine AC (2:0) (p-value [t-test] = 1.60E-05), phosphatidylcholines PC (38:6) (p-value [t-test] = 1.03E-04), and PC (40:6) (p-value [t-test] = 2.28E-04), and isoleucine (p-value [t-test] = 2.91E-04), in the T2D serum samples compared to the control subjects. The concentration of triglyceride TG (52:6) (p-value [t-test] = 2.75E-04), cholesterol ester CE (18:3) (p-value [t-test] = 6.30E-04), and phosphatidylcholines PC (40:4) (p-value [t-test] = 9.97E-04), were lower in the T2D serum samples.
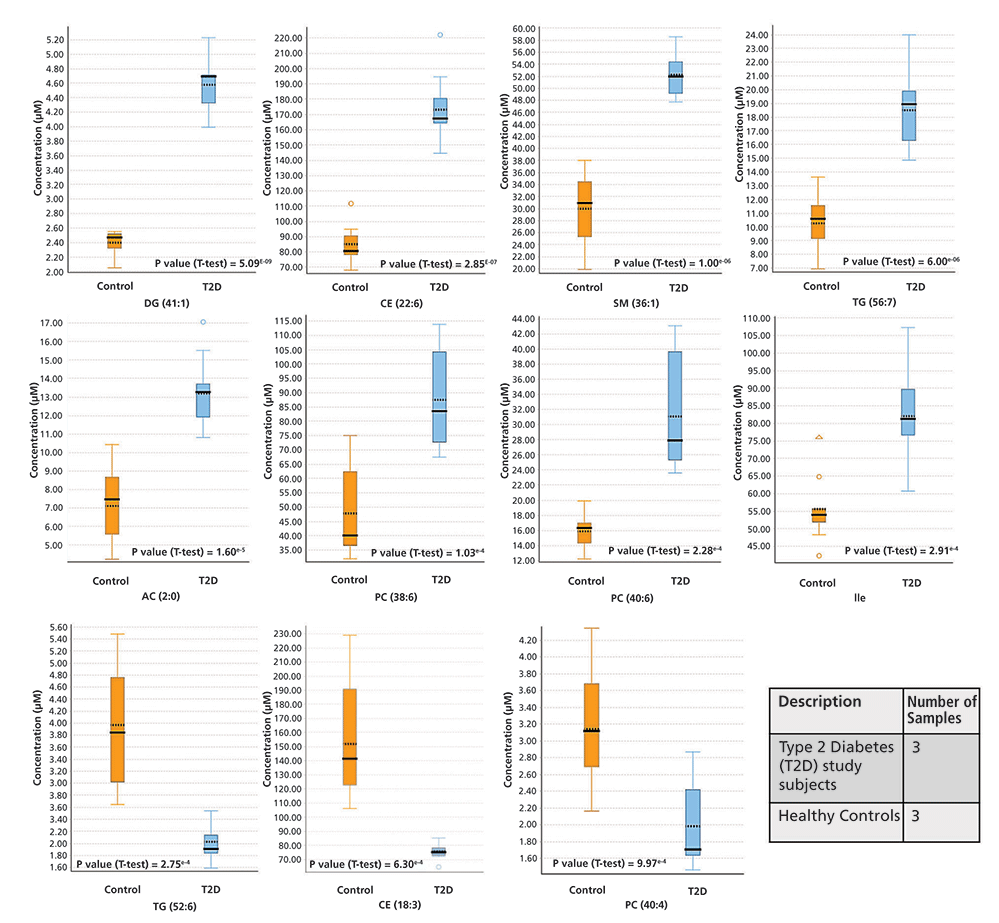
Figure 6: Representative examples of metabolites whose concentrations were significantly altered (p < 0.001) between the two groups (T2D study subjects vs. healthy controls). The p-values based on Student's t-test analysis are indicated in each graph.
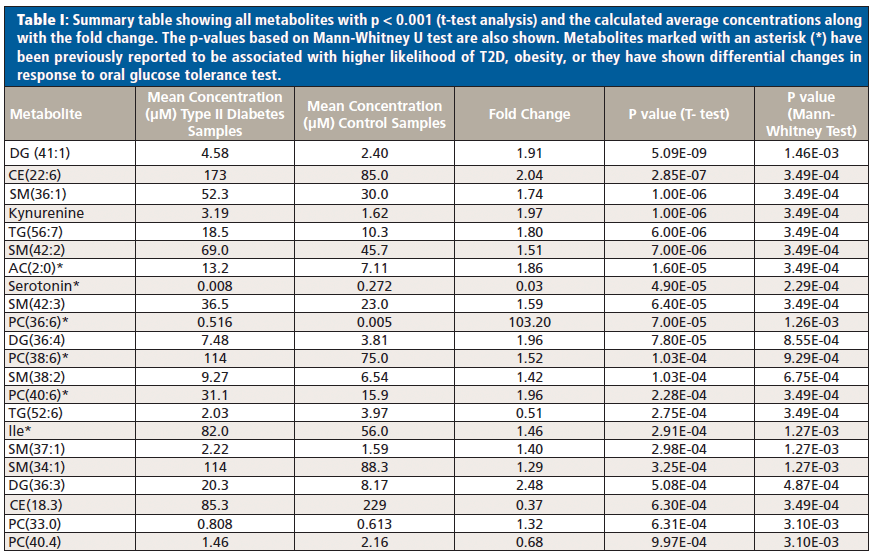
Summary Table I shows all metabolites with p < 0.001 (t-test analysis) and the calculated average concentrations along with the fold change. The fold change was calculated as the concentration in T2D serum samples/concentration in healthy control serum samples. The p-value based on Mann-Whitney U test is also shown in Table I.
Conclusion
The accuracy and reproducibility of the standardized method was assessed by examining the QC samples. The findings indicate that the accuracy in the spiked QC samples for amino acids and biogenic amines, analyzed by LC–MS, was in the range of 86–118% for 41 of 42 metabolites examined, and within 86–122% for all metabolites. In terms of the method reproducibility, the RSD in LC–MS was within 15%, for all metabolites examined. For the spiked QC samples analyzed using FIA–MS, the accuracy for 84% of metabolite measurements was well within 70–130%. The RSD for the spiked QC samples in FIA–MS was below 20%.
Six serum samples obtained from T2D study subjects and healthy controls were analyzed using the metabolite analysis kit and MS for identifying changes in metabolite concentration between different study groups. We evaluated the reproducibility of the analytical method by performing a triplicate analysis of the six serum samples. The results indicated the high reproducibility of the analytical method. For 81% of the analytes in both LC–MS and FIA–MS, the obtained RSD was below 15% and for 90% the RSD was below 20%.
Several metabolites-that is, diglycerides DG (41:1), cholesterol ester CE (22:6), sphingomyelin SM (36:1), triglycerides TG (56:7), TG (52:6), acylcarnitine AC (2:0), phosphatidylcholines PC (38:6), PC (36:6), PC(40:6), serotonin, and isoleucine-were observed to be significantly altered between the two groups.
Acetylcarnitine AC (2:0), serotonin, isoleucine, and phosphatidylcholines PC (38:6), PC (36:6), and PC (40:6) have been previously reported to be associated with higher likelihood of T2D and obesity, or they have shown differential changes in response to oral glucose tolerance test (10, 26–28) in agreement with our findings. Our results demonstrate the effectiveness of the analytical method for reliable, accurate, and reproducible quantitation as well as for monitoring and quantifying changes between different study groups.
References
(1) R. Goodacre, S. Vaidyanathan, W.B. Dunn, G.G. Harrigan, and D.B. Kell, Trends Biotechnol. 22(5), 245–252 (2018).
(2) S.B. Milne, T.P. Mathews, D.S. Myers, P.T. Ivanova, and H.A. Brown, Biochemistry 52(22), 3829–3840 (2013).
(3) K.E. Wellen, G. Hatzivassiliou, U.M. Sachdeva, T.V. Bui, J.R. Cross, and C.B. Thompson, Science 324(5930), 1076–1080 (2009).
(4) Y. Nakahata et al., Cell 134(2), 329–340 (2008).
(5) O. Yanes et al., Nat. Chem. Biol. 6, 411 (2010).
(6) H. Sperber et al., Nat. Cell Biol. 17, 1523 (2015).
(7) H. Karlic et al., Cancer Genet. 208(5), 241–252 (2018).
(8) G.V. Richieri and A.M. Kleinfeld, J. Lipid Res. 36(2), 229–240 (1995).
(9) R.A. Koeth et al., Nat. Med. 19, 576 (2013).
(10) A. Floegel et al., Diabetes 62(2), 639–648 (2013).
(11) W.R. Wikoff et al., Proc. Natl. Acad. Sci. U. S. A. 106(10), 3698–3703 (2009).
(12) R. Joice, K. Yasuda, A. Shafquat, X.C. Morgan, and C. Huttenhower, Cell Metab. 20(5), 731–741 (2018).
(13) C. P. Wild, S. Augustin, and H. Zdenko, Environ. Mol. Mutagen. 54(7), 480–499 (2013).
(14) S.M. Rappaport, D.K. Barupal, D. Wishart, P. Vineis, and A. Scalbert, Environ. Health Perspect. 122(8), 769–774 (2014).
(15) R. Wang-Sattler et al., Mol. Syst. Biol. 8, 615 (2012).
(16) C. Meisinger et al., Diabet. Med. 27(3), 360–362 (2009).
(17) M. Guasch-Ferré et al., Diabetes Care 39(5), 833–846 (2016).
(18) Y. Wu, Y. Ding, Y. Tanaka, and W. Zhang, Int. J. Med. Sci. 11(11), 1185–1200 (2014).
(19) F. Xu, L. Zou, and C.N. Ong, J. Proteome Res. 8(12), 5657–5665 (2009).
(20) R.D. Beger et al., Metabolomics 12(9), 149 (2016).
(21) D.S. Wishart, Nat. Rev. Drug Discov. 15, 473 (2016).
(22) K. Klavins, T. Koal, G. Dallmann, J. Marksteiner, G. Kemmler, and C. Humpel, Alzheimer's Dement. Diagnosis, Assess. Dis. Monit. 1(3), 295–302 (2015).
(23) O. Shaham et al., Mol. Syst. Biol. 4(1), 1–9 (2008).
(24) O.-N. Goek et al., Am. J. Kidney Dis. 60(2), 197–206 (2018).
(25) A.P. Siskos et al., Anal. Chem. 89(1), 656–665 (2017).
(26) S.H. Adams et al., J. Nutr.139(6), 1073–1081 (2009).
(27) Y.-J. Kim et al., PLoS One 11(6), e0156612 (2016).
(28) J. E. Ho et al., Diabetes 62(8), 2689–2698 (2013).
Anastasia Kalli is a Strategic Marketing Specialist with Thermo Fisher Scientific. Direct correspondence to: anastasia.kalli@thermofisher.com

Newsletter
Get essential updates on the latest spectroscopy technologies, regulatory standards, and best practices—subscribe today to Spectroscopy.


