Tunable Diode Lasers for Trace Gas Detection: Methods, Developments, and Future Outlook
Spectroscopy
Tunable diode laser absorption spectroscopy is hitting the mainstream. Here, we look at the history of the technique, the current state of the technology, and future challenges.
Tunable diode laser absorption spectroscopy (TDLAS) has been a popular technique for trace gas detection for more than 20 years in academic and research circles. Commercial applications began to appear more than 10 years ago and have hit the mainstream in many markets. This article provides an overview of the methods and the development history of TDLAS, and discusses some of the future challenges for the technology.
Tunable diode laser absorption spectroscopy (TDLAS) has evolved along with the lasers and detectors used in the technique. Here, we will look a bit at the basics, and then focus on current capabilities and challenges.
A typical tunable distributed feedback (DFB) diode laser module tunes over a range of 2–5 nm through a combination of current and temperature tuning. These lasers have a linewidth on the order of 1–4 MHz, which at 1500 nm translates to about 20–30 femtometers, far narrower than the typical Doppler-broadened linewidth of a molecular transition. Further, the lasers can be tuned at rates up to 20 or more GHz/s, allowing rapid modulation over the absorption line of interest.
The Beer-Lambert law for small concentrations can be written with the absorbance a as a function of the absorption coefficient σ, number density N, and pathlength L:

where the absorption coefficient is measured at the line center. P0 is the source intensity on the detector with no absorber, and P is the measured intensity on the detector in the presence of an absorber.
The perennial problem with this physics is that it is always very difficult for a detector staring at a bright source like a laser to detect a small dip in power resulting from the absorption of a trace species. In many cases in atmospheric monitoring, even when the absorption coefficient is high and the pathlength is long, direct absorption measurements are limited by the noise in the environment and the noise in the detector, and typical detection limits may be on the order of 0.1% or more.
Wavelength Modulation
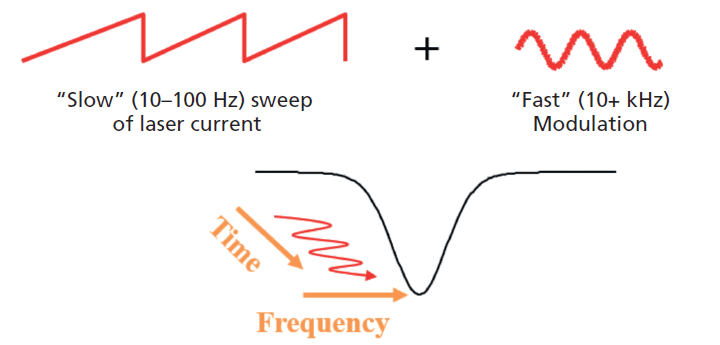
The most practical solution to this problem is to superimpose a modulation on the drive current that tunes the laser in a predictable way. A common way to do this is referred to as wavelength modulation, in which a relatively slow ramp (10-100 Hz) sawtooth wave scans over the entire absorption line of interest, while at the same time a higher frequency (10+ kHz), small-amplitude sine wave modulates the laser wavelength.
These two drive signals are superimposed on the injection current of the laser, as illustrated in Figure 1. Each period of the slower frequency ramp contains a scan over the feature of interest. Frequency-sensitive lock-in detection tunes to the high-frequency modulation. The amplitude of the high-frequency modulation influences the signal strength, with the maximum signal occurring when the amplitude of the modulation is 2.2 times the half-width of the absorption line.

Figure 1: Wavelength modulation includes a slow sweep (left) and a faster modulation (right) of the drive current, sweeping across an absorption feature of interest (bottom).
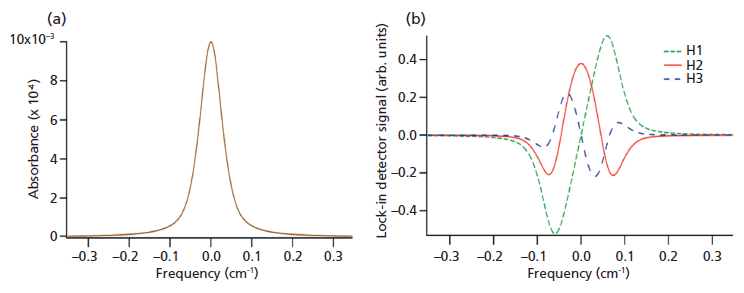
Once the signal is detected by the lock-in amplifier, it has a characteristic shape that looks like the shape of a derivative of the absorption line shape, which gives wavelength modulation its nickname: derivative spectroscopy. The idealized functions are shown in Figure 2, wherein Figure 2a on the left is modeled the absorbance of a line defined by a Voigt profile with an equal Doppler and Lorentzian half-width of 0.02 cm-1, with peak absorbance of 1%. In Figure 2b, on the right, the idealized first through third harmonics of the signal are illustrated, with a modulation amplitude of 0.07 cm-1. Both graphs are referenced such that the line center is 0.0 cm-1.

Figure 2: At left, an absorption line with 1% absorbance modeled with a Voigt profile; at right, the harmonic signals that would be measured with wavelength modulation (as described in the text) at 1, 2, and 3 times the modulation frequency.
Each of the functions depicted in Figure 2b looks like the line shape that would be measured with a lock-in detector at one, two, and three times the modulation frequency as the laser is swept across the absorption line. The green dotted line corresponding to the first harmonic (marked "H1") has the shape of the first derivative, the red "H2" line looks like the second derivative, and so forth.
Determination of Concentration
In practice, the first derivative signal typically has a substantial DC offset as a result of the fact that the laser power is continuously increasing during the sweep of the laser, as current is increased. For this reason, the second harmonic, which is proportional to the partial pressure (concentration) of the absorbing species, is typically used for quantification, as it has a zero DC offset. In fact, at the line center, the intensity measurement of each of the even harmonics is proportional to the absorber concentration. The relations for the first few harmonics are:

In these equations, I1 and I2 are the measured intensity at the first and second harmonic frequency, the former measured at the absorption line center frequency ν0, and the latter also a function of the modulation amplitude Δν. Thus, I1 is the DC offset of the first harmonic mentioned earlier, which is proportional to laser energy. I(withbar)0 is the average laser intensity (which may be different as a result of laser or environmental conditions in the beam path). η is a proportionality constant, and is a function of the particular laser and detector pair which can be measured.
In equation 3, H2 is the harmonic function, L is the pathlength, and s0(T) is the line strength s0 as a function of temperature T, which is typically known (and can be measured in a laboratory if it is not known). The last parameter to be defined is Pabs, the partial pressure of the species to be determined.
One way to find Pabs is to measure I2/I1. With all of the parameters known, this ratio of harmonic signals allows calculation of the partial pressure of the absorbing species. This is one of the most straightforward ways to use a modulated tunable diode laser signal to determine trace gas concentration. The modulation and detection hardware are all readily available.
Other Methods for Concentration
There are other schemes for measurement of concentration as well, including higher-frequency (100 MHz–10 GHz) modulation (so-called FM spectroscopy) which requires a very fast (expensive) detector but pushes the intensity noise of the laser dramatically lower (1). Theoretically, this may have better performance than the wavelength modulation scheme above. A variation on this theme is the use of two FM frequencies separated by a small frequency (2). Detection at the difference (so-called beat) frequency allows use of a lower cost detector. Yet another method uses the ratio of two even harmonics (for example, I4/I2) to simultaneously determine total pressure P, through an understanding of the variation of the harmonic function with the "modulation depth," the ratio of the amplitude of modulation to the line strength (3).
Measurement of Temperature
Measurement of temperature is also straightforward, including at elevated combustion temperatures. If the variation of line strength with temperature s0(T), shown in equation 3, for two lines of the same molecule are known, then the ratio of the measured intensities of the two lines can be solved for temperature. Ideally, the variation would not only be monotonic with temperature, but relatively steeply increasing over the range of maximum interest, for best sensitivity. We did this with two adjacent lines of water that could be measured with a single laser to yield temperature over a wide range (4).
Brief History and Development of TDLAS
One of the first applications of TDLAS to atmospheric gases was published in Science in 1971 (5). Through the 1980s, development was limited by the laser sources, which were primarily lead salt laser diodes that needed to be cooled to cryogenic temperatures. These lasers emitted in the mid-infrared (mid-IR), thus also requiring cooled detectors. Lead selenide and mercury-cadmium-telluride (MCT) detectors were the most popular, the latter particularly so because of the possibility for fast frequency response (and thus modulation). However, even with the development of compact and reliable cryocoolers, the cost and complexity of TDLAS systems kept them mostly employed in laboratories and in very special circumstances. The lengthy chapter in Sigrist's 1994 edited book is an excellent summary of work through the early 1990s in TDLAS systems (6).
The development of near-IR (NIR) laser sources in the mid-to-late 1990s was driven primarily by the telecommunications boom, but it had major implications for TDLAS monitoring. As fast as single-mode fiber-coupled laser sources between 1.3 and 2 µm were developed for telecommunications, they were snapped up by researchers aiming to find just the right laser (remember that TDLs are tunable over only a few nm) to measure their favorite molecule of interest. These sources and detectors could be cooled by on-board TEC coolers, and were thus much more robust and easily fieldable. This more than made up for the fact that NIR bands are combination and overtone bands (rather than fundamental absorptions), which can be several orders of magnitude weaker than the fundamental bands. The modulation techniques developed to reduce laser and detector noise with the mid-IR lasers remained important to increase sensitivity with the new near-IR lasers and detectors, due to the relative weakness of the transitions.
A stiff competition developed between very strong development groups at Unisearch (Ontario, Canada), Physical Sciences, Inc. (Andover, MA), and Southwest Sciences (Santa Fe, NM), as well as with practically oriented academic groups such as those of Prof. Ron Hanson (Stanford University), Prof. Jürgen Wolfrum (Universität Heidelberg, Germany), and (later) Prof. Volker Ebert (Technische Universität Darmstadt, Germany). The telecommunications lasers were available only in particular bands, and manufacturing techniques were under development. Therefore, there were always a few lasers in each batch that were outside of the intended wavelength range. These "rejects" were snapped up by the competing researchers, and were immediately tested for application to molecules of interest, each researcher hoping to be the first to measure, say, hydrogen sulfide or ammonia. Relationships with the TDL manufacturers were key; otherwise lead times for particular wavelength lasers could be 3–4 months or more. Each of these groups made substantial contributions to the development of TDLAS spectroscopy as it is practiced today.
Approximately a decade ago, the basic methodology, hardware, and range of gases that could be measured hit a tipping point for TDLAS technologies. Small business innovation research (SBIR) gave way to commercial application, and companies such as Siemens, Mettler-Toledo, Teledyne, General Electric, Servomex, and SpectraSensors joined Unisearch and other early companies in a now crowded field of manufacturers. A typical list of gases that can be easily measured includes O2, HF, HCl, CO, CO2, H2S, H2O, NO, N2O, CH4, and many others. Typical cross-stack detection limits are in the parts-per-million range (depending on the molecule) for a few meters of pathlength. Sub-parts- per-million detection can be obtained for many gases with longer paths, including with extractive sample cells.
Perhaps the most hopeful of the new entrants to the crowd of manufacturers was Zolo Technologies, which was founded in 1999, and venture-funded to the tune of $51.5 million. They developed TDLAS sensors and tomographic temperature and species mapping strategies using multiple TDLs in boilers. They were purchased by John Zink Hamworthy Combustion in March of this year. The current size of the worldwide market for TDLAS is in the hundreds of millions of dollars annually, and growing quickly.
The Future for TDLAS
There are two basic sets of challenges for TDLAS technology. The first is to continue to adapt to an increasing number of challenging measurement environments. Coal mines, refineries, cement plants, and other harsh environments bring continuing operating challenges. This requires developing fit-for-purpose sensing devices that are easy to install, which retain calibration or are easy to recalibrate under heavy wear and continuous use, and which can measure a suitable set of gases for the application. These are typical challenges for a developing technology, and will result in a spate of new implementations, as well as solutions to interesting technical challenges. Some of the most important challenges to consider for new systems are effective multiplexing, beam steering and control, and compactness.
The second set of challenges is to adapt to new laser sources. The near-IR TDLAS systems have been quite successful, with detection limits in the parts-per-million over short (~1–10m) pathlengths and relatively low costs. To improve on the technology, new room-temperature interband cascade lasers (ICLs) operating in the 3–6 µm region will allow access to more of the fundamental bands. Quantum cascade lasers (QCLs) are further out in wavelength (typically 5–12 µm), and may also be farther out in wide application because of the price associated with power, packaging, and stability requirements, but QCLs are also promising. Figuring out how to use these lasers in industrial environments has the potential to push detection limits lower by orders of magnitude as a result of the strength of transitions accessible in the mid-IR region. However, the chicken-and-egg problem of finding enough demand for the lasers to make them economical enough to implement may stand in the way, at least until the equivalent of the telecom boom of the 1990s comes to the mid-IR to drive ICL and QCL laser development. Stay tuned!
Acknowledgments
The author is grateful to have had the opportunity to learn much about TDLAS while working in partnership with Dr. Mohammadreza Gharavi, who was his graduate student from 1999–2004, and from staff for several years thereafter, at the University of California, San Diego. Later, commercial developments at Photon Machines, Inc. with Kregg Philpott continued the education. We found many of the potholes on the road to eventual success in implementation!
References
(1) W. Lenth, Opt. Lett. 8, 575-577 (1983).
(2) G.R. Janik, C.B. Carlisle, and T.F. Gallagher, J. Opt. Soc. Am. B3, 1070-1074 (1986).
(3) U.S. Patent 7,969,576 B1, Steven G. Buckley, Mohammadreza Gharavi, Marco Borchers, June 28, 2011.
(4) M. Gharavi and S.G. Buckley, Appl. Spectrosc. 58(4), 468-473 (2004).
(5) E.D. Hinkley, and P. L. Kelley, Science, 171(3972), 635–639 (1971).
(6) H.I. Schiff, G.I. Mackay, and J. Bechara, Air Monitoring by Spectroscopic Techniques, Markus W. Sigrist, Ed. (John Wiley & Sons, New York, NY, 1994), pp 239-333.
Steven G. Buckley, PhD,

Steven G. Buckley, PhD, is the CEO of Flash Photonics, an affiliate associate professor at the University of Washington, and has started and advised numerous companies in spectroscopy and in applications of machine learning. He has approximately 40 peer-reviewed publications and 6 patents. His work in practical optical spectroscopy, such as LIBS, Raman, and TDL spectroscopy, dovetails with the coverage in this column, which reviews methods (new and old) in laser-based spectroscopy and optical sensing. Direct correspondence to: SpectroscopyEdit@ubm.com.

Newsletter
Get essential updates on the latest spectroscopy technologies, regulatory standards, and best practices—subscribe today to Spectroscopy.