Using X-Ray Absorption Spectroscopy to Study the Speciation and Coordination of Lead Binding to Humic Materials
In this study X-ray absorption was used to determine the effect of pH on the coordination of lead to humin and sphagnum peat moss. The authors determined the oxidation state and the coordination of lead to both humin and sphagnum peat moss using X-ray near edge structure and extended X-ray absorption fine structure spectroscopy. In addition, inductively coupled plasma optical emission spectroscopy was used to determine the amount of lead bound to the humin and sphagnum peat moss in the pH range 2–6.
Lead is an element of great environmental significance due to the fact that it is both highly toxic and serves no known biological function. There are many different sources of lead contamination in the environment, which include but are not specific to the following: mining, ore processing, coal combustion, automobile battery production and disposal, and acid mine drainage. Thus, an understanding of the coordination of lead to natural materials is needed in order to have a better understanding of the potential risks and remediation of lead in the environment. To understand the behavior and the possible interactions of lead with natural materials including peat moss and humic materials, a number of different spectroscopic techniques have been employed.
In the determination of the total lead content in different materials techniques such as atomic absorption (AA), graphite furnace atomic absorption spectroscopy (GFAAS), inductively coupled plasma optical emission spectroscopy (ICP-OES), and ICP-mass spectrometry (MS) have been used. All of the aforementioned instrumental techniques have been utilized to determine the lead concentration in drinking water, plant materials, soils, and wastes (1–5). However, the total concentration of an element is only part of the story when dealing with environmental pollution. There are two other very important factors, which are for the most part neglected in the analysis of many environmental samples. These two factors are the coordination and the speciation of the elements in question. There are several instrumental techniques that can be employed to investigate the coordination of an element. For example, infrared (IR), nuclear magnetic resonance (NMR), X-ray diffraction (XRD), and extended X-ray absorption fine structure (EXAFS) spectroscopy are all techniques that can provide invaluable information on metal coordination. All of these techniques have been used to study lead coordination in biological materials, synthetic materials, and environmental samples with a high degree of certainty in the results obtained (including humic materials) (6–9). However, the speciation of an element in a sample requires either the use of chemical extraction, followed by high performance liquid chromatography (HPLC)-ICP-MS (or some other hyphenated speciation technique), electrochemical techniques, or the use of X-ray near edge structure (XANES) spectroscopy. XANES spectroscopy provides one major advantage over chemical extraction because in this technique, no sample pretreatment is required (10–13). XANES has been used to perform speciation studies of lead, iron, gold, copper, and manganese, among other elements in many different sample matrices (14–16).
In this study we used a combination of ICP-OES and X-ray absorption (XAS) spectroscopy to study the effect of pH on the coordination of lead to humin and peat moss. Through studying the effects of pH on the binding one can develop a better understanding of the behavior of lead in the environment. In conjunction with studying the binding characteristics with changing pH in this study, we also investigated the effect of pH on the coordination and speciation of lead binding to humic materials.
Experimental
First, we ground the sphagnum peat moss to pass through an 80 mesh sieve. After sieving, the peat moss was washed with dilute acid (0.01 M HCl) to eliminate interference in the studies from acid -soluble materials and debris. Then, we extracted the humin from the sphagnum peat moss by adjusting the pH to 13.5 and constantly stirring the material for 48 h (17). After 48 h the base-adjusted peat moss was centrifuged at 3000 rpm for 5 min, and the supernatant was discarded and the humin fraction was lyophilized. The whole peat moss and the humin fractions then were pH adjusted to pH 2, 3, 4, 5, and 6. We pH adjusted the material by weighing out 500 mg of the humin or sphagnum peat moss and washing as previously mentioned. The materials then were diluted to give a slurry concentration of 5 mg/mL.
The humin and peat moss were pH adjusted initially to pH 2, at which point three triplicate 4-mL aliquots were extracted. The materials were then pH adjusted to pH 3 using dilute base (0.01 M NaOH) and three triplicate 4-mL aliquots of the slurry were again extracted. This pH adjustment and extraction procedure was repeated for the subsequent pHs under investigation. The pH-adjusted slurries then were centrifuged at 3000 rpm for 5 min and the supernatants were discarded. To each of the pH-adjusted materials, we added 4 mL of pH-adjusted 0.20 mM lead solution. Then, the lead–humin and lead–peat moss slurries were reacted for 1 h, along with control solutions containing only the 0.20 mM lead solutions. After one hour of reaction, the samples were centrifuged again and the supernatants were kept for metal analysis using ICP-OES.
In our XAS studies, we first washed 2.0 g of either the humin or peat moss as mentioned earlier and the humin and peat moss were reacted with a 1000 ppm lead solution for 1 h at pHs of 3 and 4. After the reaction with lead, the samples were centrifuged at 3000 rpm and the supernatants were discarded. The solid materials were then lyophilized and packed into 1.0-mm aluminum plates with Kapton tape windows for analysis at SSRL (Stanford Synchrotron Radiation Laboratories, Stanford, CA). The operation parameters of the beam line included a 1.0-mm slit, energy of 3 GeV, a current range of 60–100 mA, and a Si 111 double crystal monochromator (with a Φ 0 orientation). The XAS spectra were recorded using the lead LIII line with an internal lead foil standard (E0 13.035 keV) at room temperature. The data treatment for the XAS was performed using the standard data analysis techniques and the WinXAS software (18).

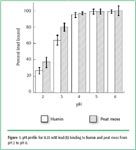
Figure 1. pH profile for 0.20 mM lead(II) binding to humin and peat moss from pH 2 to pH 6.
Briefly, the data reduction consisted of averaging two or three spectra of each of the samples and model compounds. The energy calibration of the spectra was based upon the energy of the internal lead(0) foil using a second-degree derivative of the absorption edge. Then the samples were background corrected using polynomial fittings to the pre-edge and post-edge regions and normalized to one absorption unit. The XANES spectra were then extracted at this point in the data analysis by sectioning the XAS spectra from 12.95 keV to 13.15 keV. The LC-XANES fittings were then performed on these spectra using procedures previously published (16, 18). The spectra then were converted into wave vector space (or k space Å-1) based upon the energy of the photoelectron ejected from the sample using a second-degree derivative of the sample edge. Subsequently, the EXAFS of the samples were extracted from the spectra using a spline of 4 knots and a k weight of 2, and Fourier transformed from 2.0 to 10.0 Å-1. The spectra then were back transformed to include the first and second shells of neighboring atoms. Then, the spectra were fitted using FEFF 8.00 and least-squared fittings of the data obtained from the calculations of the FEFF program (19). The parameters calculated using the least-squared fittings of the back transforms were: the interatomic distances, the coordination numbers, and the Debye-Waller factors. The input files for the FEFF program were created using the ATOMS software from crystallographic data of the model compounds (20).

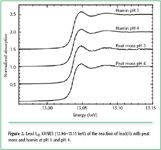
Figure 2. Lead LIII XANES (12.96-13.15 keV) of the reaction of lead(II) with peat moss and humin at pH 3 and pH 4.
Results and Discussion
Figure 1 shows the pH dependency of lead binding to both the humin and the peat moss. As can be seen in this figure, there is a direct relationship between the increase in lead binding and the increase in pH. This behavior has been observed for lead binding to several different biological materials (15, 21–23). This binding trend has been explained in the literature to be related to the pK
a
s of the different carboxylic acid functional groups on the different materials, which for the most part they are protonated at pH values around 2 and become deprotonated at pHs in the 3.0–4.5 range. Thus, the binding increases drastically above pH 2 and then becomes stable at approximately pH 4. From the data presented in the pH profile we are proposing that the binding of the lead to both the humin and peat moss is occurring through different carboxyl groups present on the materials.

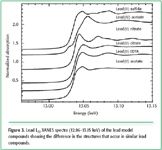
Figure 3. Lead LIII XANES spectra (12.96-13.15 keV) of the lead model compounds showing the difference in the structures that occur in similar lead compounds.
Figures 2 and 3 show the XANES of the lead reacted with the humin and peat moss and the model compounds, respectively. These figures show that lead binds as Pb(II) to both humin and peat moss. To corroborate this we also used LC-XANES fittings, which are shown in Table I. LC-XANES has been used to determine the geometry and the oxidation state of elements in a plethora of different materials. More specifically, the XANES analysis has been used to determine the oxidation state of manganese in soot emitted from engines, the oxidation state of chromium in coal, plants, and minerals, and the oxidation state of gold in different biological materials (16). As can be seen in Table I, the LC-XANES fittings of lead bound to the humin and peat moss most closely resembles the spectra of disodium lead(II) ethylenediaminetetraacetate ((Na2Pb((O2C)4(CH2)6N2)), which has a four coordinate system in the solid state (24). As observed in this table, approximately 80–100% of the lead bound to both the humin and peat moss is found in the same configuration as lead(II) ethylenediaminetetraacetate. This suggests that Pb(II) is coordinating through carboxyl groups. This binding configuration has been suggested in the literature for the binding of lead to similar materials (21–23).

Table I. LC-XANES fittings of lead(II) reacted with humin and peat moss at pH 3 and pH 4.
The Fourier-transformed EXAFS of the samples, with the exception of the lead bound to peat moss at pH 3 (which was too dilute to obtain EXAFS spectra), are presented in Figure 4. Also included in this figure is the Fourier-transformed EXAFS of the model compound disodium lead(II) ethylenediaminetetraacetate. The fittings of the backtransformed EXAFS are presented in Table II. As can be seen in Figure 4, the Fourier-transformed EXAFS of the samples and the model compound are very similar, indicating that the samples have practically the same coordination. The FEFF fittings of the samples in Table II show that the samples have approximately four oxygen atoms coordinated to the lead with interatomic distances ranging from 2.49 Å to 2.53 Å in the first shell, and in the second shell the interaction is with carbon atoms at approximately 2.90 Å. This coordination is very similar to that of the disodium lead(II) ethylenediaminetetraacetate which has four oxygen atoms at approximately 2.53 Å in the first coordination shell and two carbon atoms in the second coordination shell at approximately 3.23 Å The information obtained from our results of the XANES and EXAFS studies compliment each other, indicating that the coordination of the lead to humin and peat moss is four coordinate and occurs through oxygen atoms, most likely carboxyl groups.

Table II. FEFF fitting results of room temperature EXAFS of lead reacted with peat moss at pH 4, humin at pH 3 and pH 4, and the fitting of disodium lead EDTA (Na2Pb((O2C)4(CH2)6N2)).Note: CN denotes the coordination number, R is the interatomic distance, ÃÂ2 is the Debye-Waller factor, and S02 is a goodness of fit parameter.
Conclusion
We determined from our XANES spectroscopy investigations that lead was present as lead(II) in both the humin and the sphagnum peat moss. In addition, the results of the LC-XANES fittings of the samples showed that the sample's atomic geometry most closely resembled that of disodium lead(II) ethylenediaminetetraacetate ((Na
2
Pb((O
2
C)
4
(CH
2
)
6
N
2
)), which has a four coordinate system. The EXAFS studies showed that the lead was coordinated to four oxygen ligands with an interatomic distance of approximately 2.50 Å as was suggested from the XANES studies. Our ICP-OES studies showed a direct pH dependency for lead binding. The increase in lead binding above pH 2 further strengthens our premise that the functional group responsible for lead binding on both materials is the carboxyl group.

Figure 4. Fourier-transformed EXAFS of lead reacted with different humic substances and a lead(II) model compound. (a) Lead(II) reacted with peat moss at pH 4. (b) Lead(II) reacted with humin at pH 4. (c) Lead(II) reacted with humin at pH 3. (d) Fourier-transformed EXAFS of Na2Pb(EDTA). Note that the EXAFS of the lead(II) reacted with peat moss at pH 3 was too dilute to obtain EXAFS spectra.
Acknowledgments
The authors would like to acknowledge the National Institutes of Health (grant S06 GM8012-33) and the University of Texas at El Paso's Center for Environmental Resource Management (CERM) through funding from the Office of Exploratory Research of the U.S. Environmental Protection Agency (cooperative agreement CR-819849-01). They also would like to thank the Southwest Center for Environmental Research and Policy (SCERP) program for financial support, and the HBCU/MI, Environmental Technology Consortium, which is funded by the Department of Energy. Portions of this research were carried out at the Stanford Synchrotron Radiation Laboratory, a national user facility operated by Stanford University on behalf of the U.S. Department of Energy, Office of Basic Energy Sciences. The SSRL Structural Molecular Biology Program is supported by the Department of Energy, Office of Biological and Environmental Research, and by the National Institutes of Health, National Center for Research Resources, Biomedical Technology Program. Dr. Gardea-Torresdey acknowledges the Dudley family for the Endowed Research Professorship in Chemistry and also funding from the NIEHS (grant R01ES11367-01).
G. de la Rosa is in the environmental science and engineering Ph.D. program, and J.R. Peralta-Videa and J.G. Parsons are with the department of chemistry, at the University of Texas at El Paso (El Paso, TX). J.L. Gardea-Torresdey is with both the environmental science and engineering Ph.D. program and the department of chemistry at the university. E-mail: jgardea@utep.edu.
References
1. R.J VanCott, B.J. McDonald, and A.G. Seelos,
Nucl. Instrum. Meth. A.
422
, 801–804 (1999).
2. M.E. Soares, M.L. Bastos, F. Carvalho, and M. Ferreira, Atom. Spectrosc. 16, 149–153 (1995).
3. A. Sattar, M. Wahid, and S.K. Durrani, Plant Food Human Nutr . 39, 279–86 (1989).
4. X. Ma and Z Zhang, J. Anal. Atom. Spectrom . 19, 738–742 (2004).
5. A. Eaton, G. Oelker, and L. Leong, Atom. Spectrosc . 3, 152–156 (1982).
6. M.R. St John Foreman, M.J. Plater, and J.M.S. Skakle, J. Chem. Soc. Dalton . 12, 1897-1903 (2001).
7. E.S. Claudio, M.A. Ter Horst, C.E. Forde, C.L. Stern, M.K. Zart, and H.A. Godwin, Inorg. Chem. 39, 1391–1397 (2000).
8. R. F. Grossman and D. Krausnick, J. Vinyl. Addit. Technol. 3, 7–11 (1997).
9. I.V. Smirnov, F.W. Kotch, I.J. Pickering, J.T. Davis, and R.H. Shafer, Biochem. 41, 12133–12139 (2002).
10. A.L. Nolan, H. Zhang, and M.J. McLaughlin, J. Environ. Qual. 34, 496–507 (2005).
11. L. Ebdon, S.J. Hill, and C. Rivas, Spectrochim. Ac. B: 53B, 289–297 (1998).
12. A. Al-Rashdan, D. Heitkemper, and J.A. Caruso, J. Chromatogr. Sci. 29, 98–102 (1991).
13. J. Lecomte, P. Mericam, and M. Astruc, Heavy Met. Environ. , Int. Conf., 3rd 678–681 (1981).
14. K.J. Rao, B.G. Rao, and J. Wong, J. Chem. Soc. Farad. T. 1. 84, 1779-1794 (1988).
15. K. Xia, W. Bleam, and P.A. Helmke, Geochim. Cosmochim. Ac . 61, 2211–2221 (1997).
16. J.G Parsons, M.V. Aldrich, and J.L. Gardea-Torresdey, Appl. Spectrosc. Rev. 37, 187–222 (2002).
17. J.L. Gardea-Torresdey, L. Tang, and J.M. Salvador, J. Hazard. Mater . 48, 191–206 (1996).
18. T. Ressler, J. Synchrotron Radiat. 5, 118–122 (1998).
19. A.L. Ankudinov, B.J. Ravel, J.J. Rehr, and S.D. Conradson, Phys. Rev. B: Condens. Matter , 7565 (1998).
20. B. Ravel, J. Synchrotron Radiat. 8, 314–316 (2001).
21. K.J. Tiemann, G. Gamez, K. Dokken, J.G. Parsons, and J.L. Gardea-Torresdey, Microchem. J. 71, 287–293 (2002).
22. K.J. Tiemann, A.E. Rascon, G. Gamez, J.G. Parsons, T. Baig, I. Cano-Aguilera, and J.L. Gardea-Torresdey, Microchem. J. 71, 133–141 (2002).
23. J. Gardea-Torresdey M. Hejazi, K. Tiemann, J.G. Parsons, M. Duarte-Gardea, and J. Henning, J. Hazard. Mater. 91, 95–112 (2002).
24. K. Krishnan and R.A. Plane, J. Am. Chem. Soc. 90, 3195–3200 (1968).

AI Shakes Up Spectroscopy as New Tools Reveal the Secret Life of Molecules
April 14th 2025A leading-edge review led by researchers at Oak Ridge National Laboratory and MIT explores how artificial intelligence is revolutionizing the study of molecular vibrations and phonon dynamics. From infrared and Raman spectroscopy to neutron and X-ray scattering, AI is transforming how scientists interpret vibrational spectra and predict material behaviors.
Advancing Corrosion Resistance in Additively Manufactured Titanium Alloys Through Heat Treatment
April 7th 2025Researchers have demonstrated that heat treatment significantly enhances the corrosion resistance of additively manufactured TC4 titanium alloy by transforming its microstructure, offering valuable insights for aerospace applications.