Very Low Frequency Measurements of Linear Alkanes
Low frequency Raman scattering measurements can be used to predict physical properties of polymers and the crystalline polymorphic form of active pharmaceutical ingredients (APIs). These measurements are made by recording the Stokes and anti-Stokes side of the laser line with the laser centered on the detector. Spectra of polyethylene and linear alkanes were recorded down to 4 cm-1.
The study of vibrational spectra of linear alkanes has been used in the past to model the structure of polyethylenes. In particular, from these studies it has become clear that, in polyethylene, the longitudinal acoustic mode (LAM) frequency is inversely related to the length of polymer units between folds (lamellae), which is determined by sample history. This relationship had been developed by studying a series of linear alkanes. Spectra of samples of (C44H90), (C20D42), (C24D50), and (C36D74) are reported here. Although full spectra were recorded, we were more interested in the behavior in the low frequency region. Predictions for the LAM modes were in the range between 50 and 120 cm-1, but we recorded spectra down to 4 cm-1. In addition to the LAM modes, we observed sharp bands, some quite strong. An extensive literature search enabled assignment of these bands to librational modes (hindered rotations in the lattice). The ability to make this type of very low frequency measurement reliably can be used to predict physical properties of polymers and the crystalline polymorph of active pharmaceutical ingredients (API’s), which has implications for bioavailability, shelf-life, stability, and protection of intellectual property (IP) for pharmaceutical manufacturers.
Last year, I was asked by Professor Shaw Lin Hsu, of the University of Massachusetts at Amherst, to show how low in frequency we could measure. He sent me four samples of linear alkanes, three of them fully deuterated. He was looking to observe the longitudinal acoustic modes (LAM) mode between 50 and 120 cm-1, depending on the length of the alkane chain (1). I recorded spectra simultaneously on the Stokes and anti-Stokes side of the laser line, with the laser centered on the detector. In addition to the LAM lines between 50 and 120 cm-1, I saw a set of strong sharp lines that appeared down to a ±4 cm-1 shift. The LAM modes represent accordion motion of polyethylene and the linear alkanes. The question was, “What else could be appearing so close to the laser line?” There were two possibilities: one was for these lines to represent molecular phonons (2), which represent motion of the molecules beating against each other in the unit cell, but this required there be more than one molecule in the unit cell. Another possibility was librations, or molecular twisting (3–7).
Vibrational study of polyethylene and its short-to-medium chain analogs goes back to the 1960s (1,3,4,6–12). It was already known at the time that the crystallographic phase of polyethylene is orthorhombic, but the alkanes can crystallize in orthorhombic, monoclinic, triclinic, or hexagonal phases. Because there are two molecular units in the unit cells of the orthorhombic and monoclinic phases, crystal field splittings are predicted, but there are no splittings in the triclinic or hexagonal phases that contain one molecule in the unit cell (7–13)
Vibrational analysis is first based on the molecular functional group, composed of two methylene units in the chain. The symmetry species describing the line group of this molecular unit is isomorphous to the point group D2h. The Raman vibrations of the molecular unit are described in terms of the four symmetric irreducible representations of D2h. In the orthorhombic unit cell of the crystal phase (also D2h) these can be split, as shown in Table I.
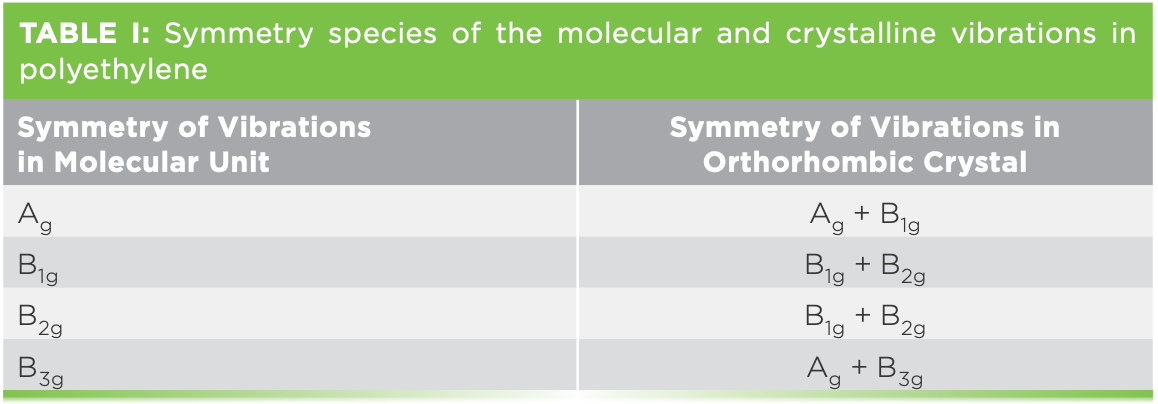
In the crystal, the splittings of the molecular vibrational modes can be observed using polarization analysis, because differences in symmetry mean that the polarization behavior will be different. This splitting is illustrated quite clearly in references (10) and (12), but is already seen by taking polyethylene to the temperature of liquid nitrogen where the lines sharpen, enabling the observation of the splitting (9). In addition, Snyder showed that splitting of the infrared (IR)-active modes in the orthorhombic and monoclinic phases of the n-alkanes is different, reflecting differences in intermolecular interactions in the two phases (11).
Experimental
All spectra were measured on the Evolution Raman microscope equipped with the ultra low frequency (ULF) filter, the 532 nm laser, 25% power, 30 x 5 sec, and the 100x visible objective.
Results
Measurements of n-tetratetracontane (C44H90)
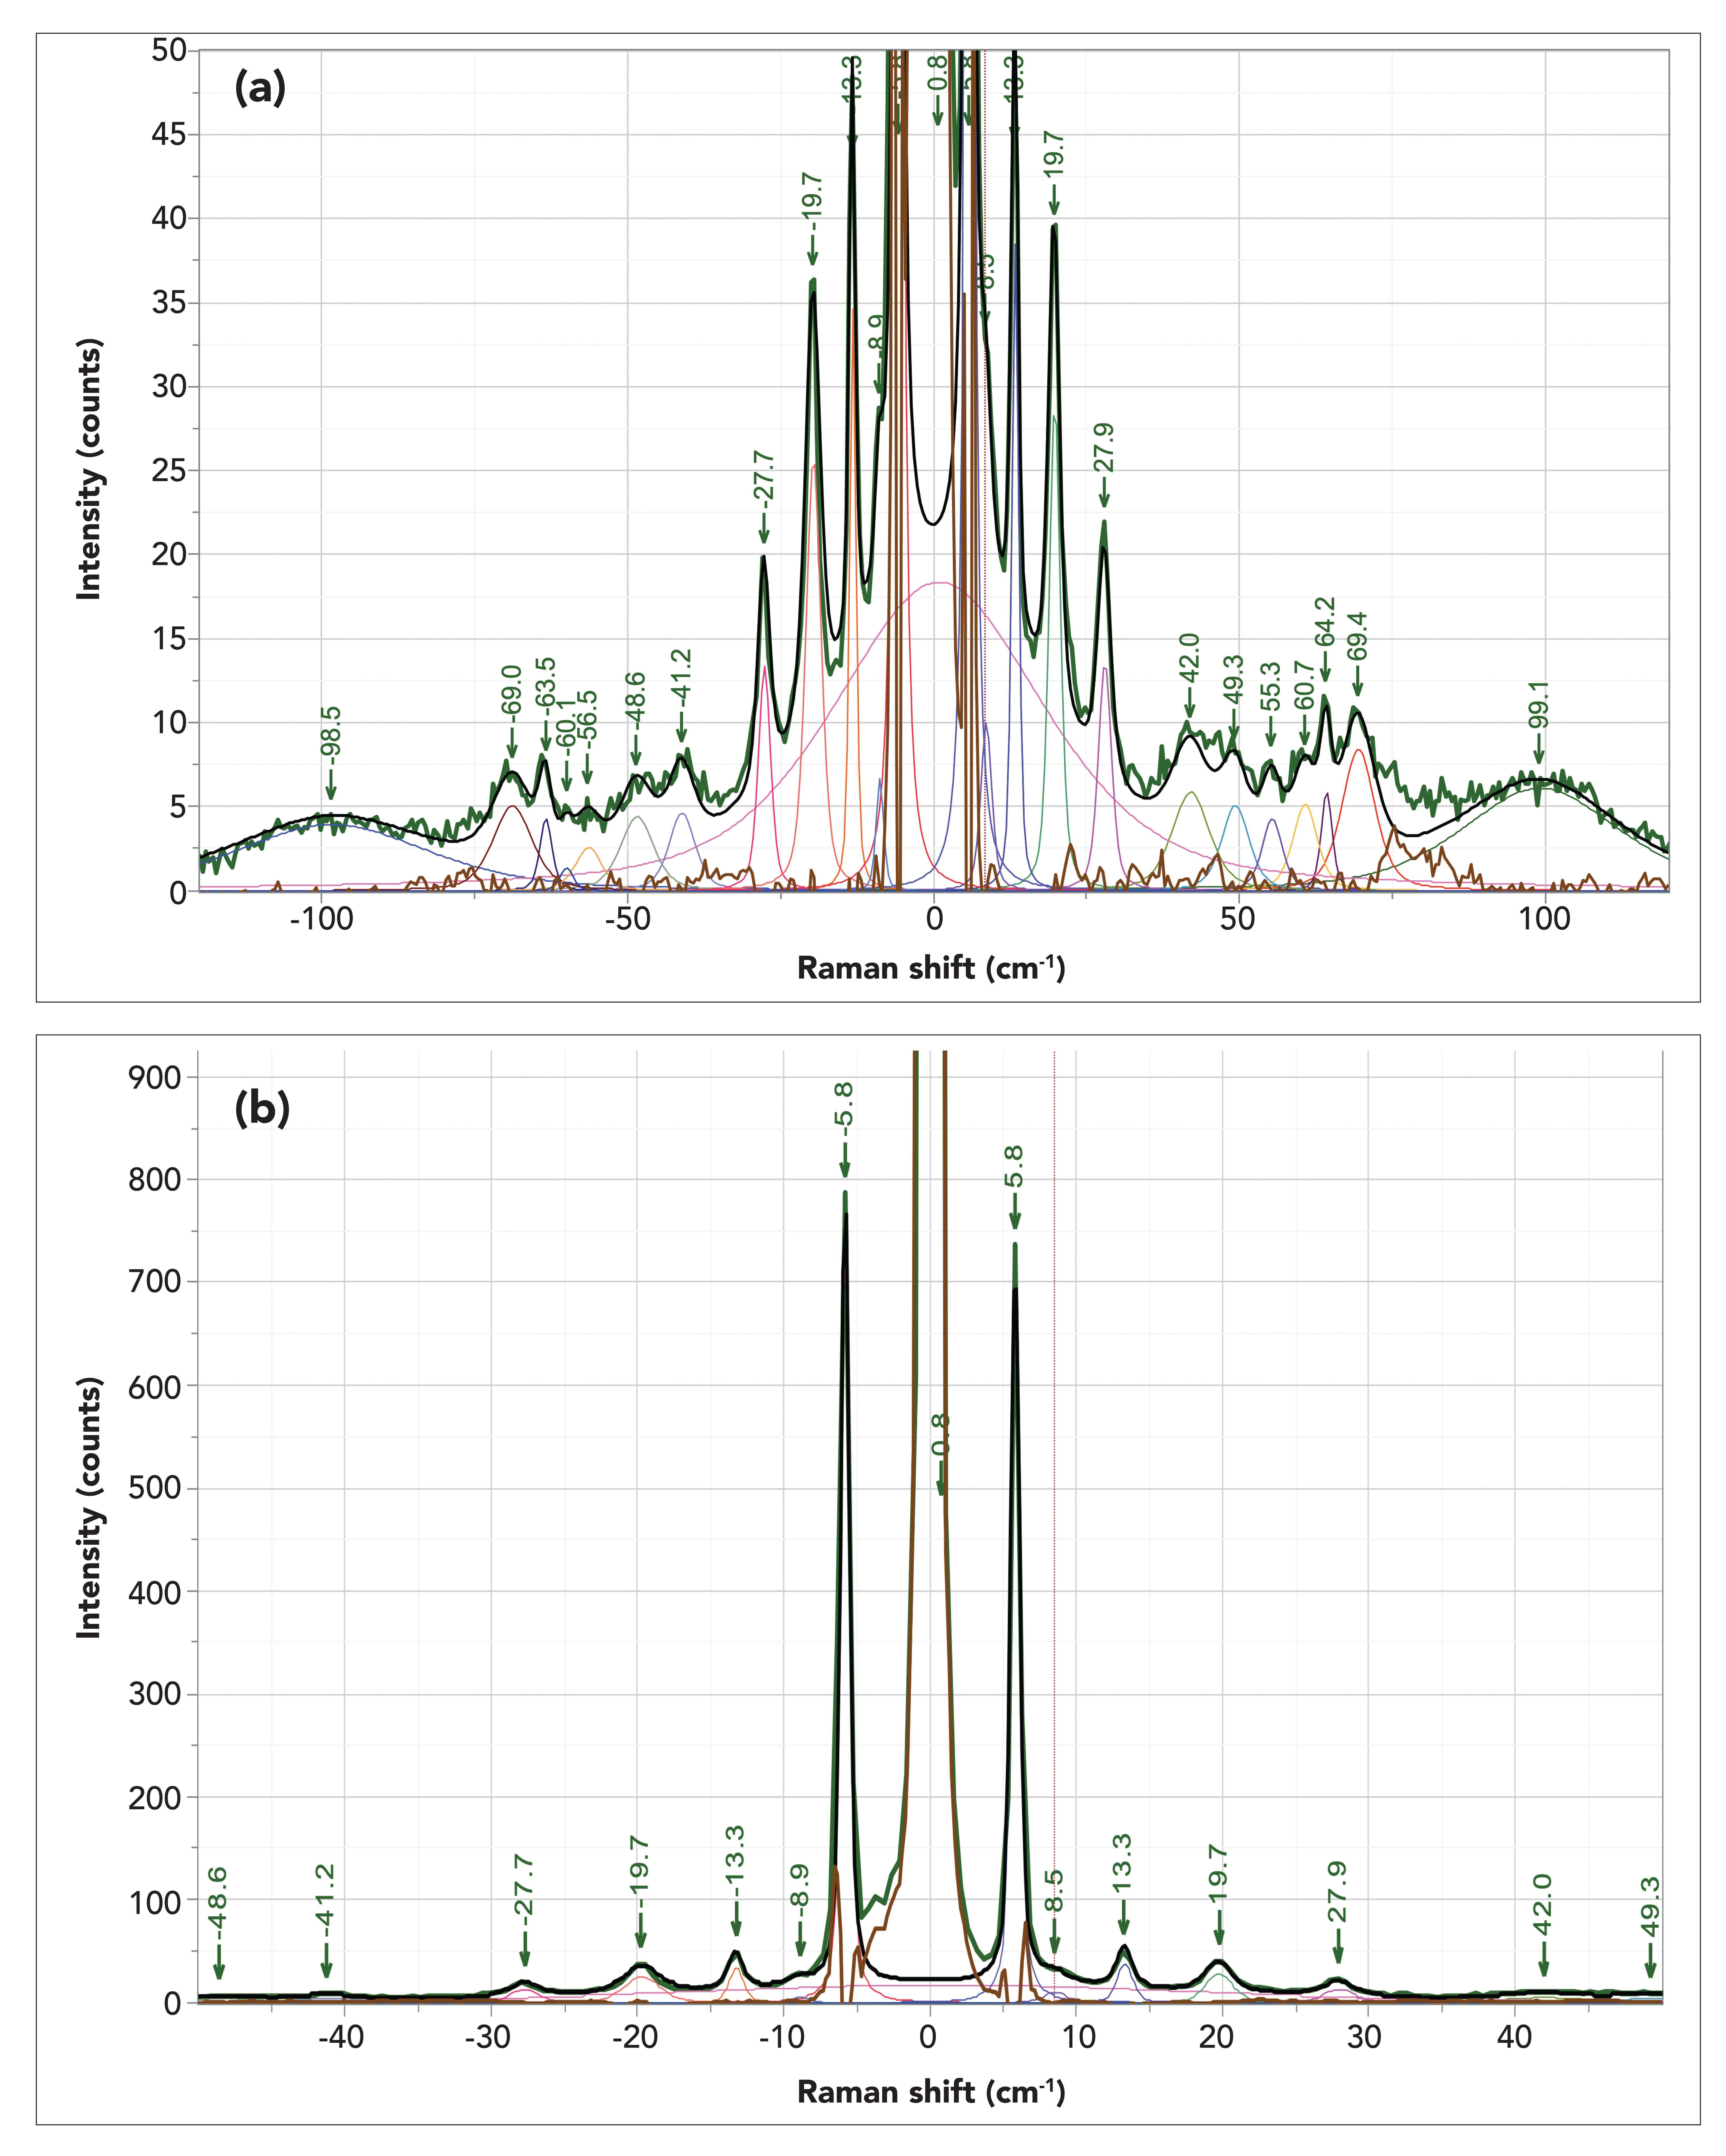
Viewing the spectrum between -100 and +100 cm-1 is a bit confusing, because the ultralow frequency bands are up to 30 times stronger than the bands in the expected LAM region. So Figure 1a shows the Stokes–anti-Stokes (SAS) spectrum between ±120 cm-1 with enough vertical expansion to see the LAM modes, and then Figure 1b shows the SAS spectrum between ±50 cm-1, displayed to see the details in the bands below 30 cm-1. The spectra were band-fitted for several reasons. The signal-to- noise introduces some uncertainty in the peak positions, so fitting on both sides of the laser enables confirmation of the legitimacy of most of the spectral features. The LAM modes of the hydrogenated alkanes have been calculated and measured by Schaufele and Shimanouchi (1), and for C44H90 it is expected to be near 60 cm-1. In fact, the spectrum between 40 and 120 cm-1 is quite complicated. The micro measurements that are shown here were done on individual platelets, so for sure there is orientation dependence, unlike the published spectra that were done in macro geometry, where an ensemble of crystals was measured.
Figure 1: (a) Low frequency SAS spectrum of C44H90. Laser excitation was 532 nm, 25% power, 100x objective, 30 µm hole, 30 x 5 s accumulation, ULF filter unit. (b) SAS spectrum of C44H90 displayed for clarity of the very low frequency bands.
Measurements of the Deuterated Alkanes
Figure 2 shows the full spectra and the SAS spectra of the deuterated species. The behavior in the fingerprint and carbon-deuterium (CD) regions are consistent with reference (10). We do not have information on expected band frequencies for the deuterated linear alkanes in the low frequency region, but, in general, one expects that as molecular weight increases, the band frequencies should decrease, and that is what we see in Figure 2b.
Figure 2: (a) Full spectra of the deuterated alkanes, from top to bottom: n-tetratetracontane, n-tetracosane, and n-eicosane. Note the small amount of residual hydrogen in the CH band near 2850 cm-1. (b) Ultralow frequency spectra of the deuterated alkanes, from top to bottom, C36D74, C24D50, and C20D42.
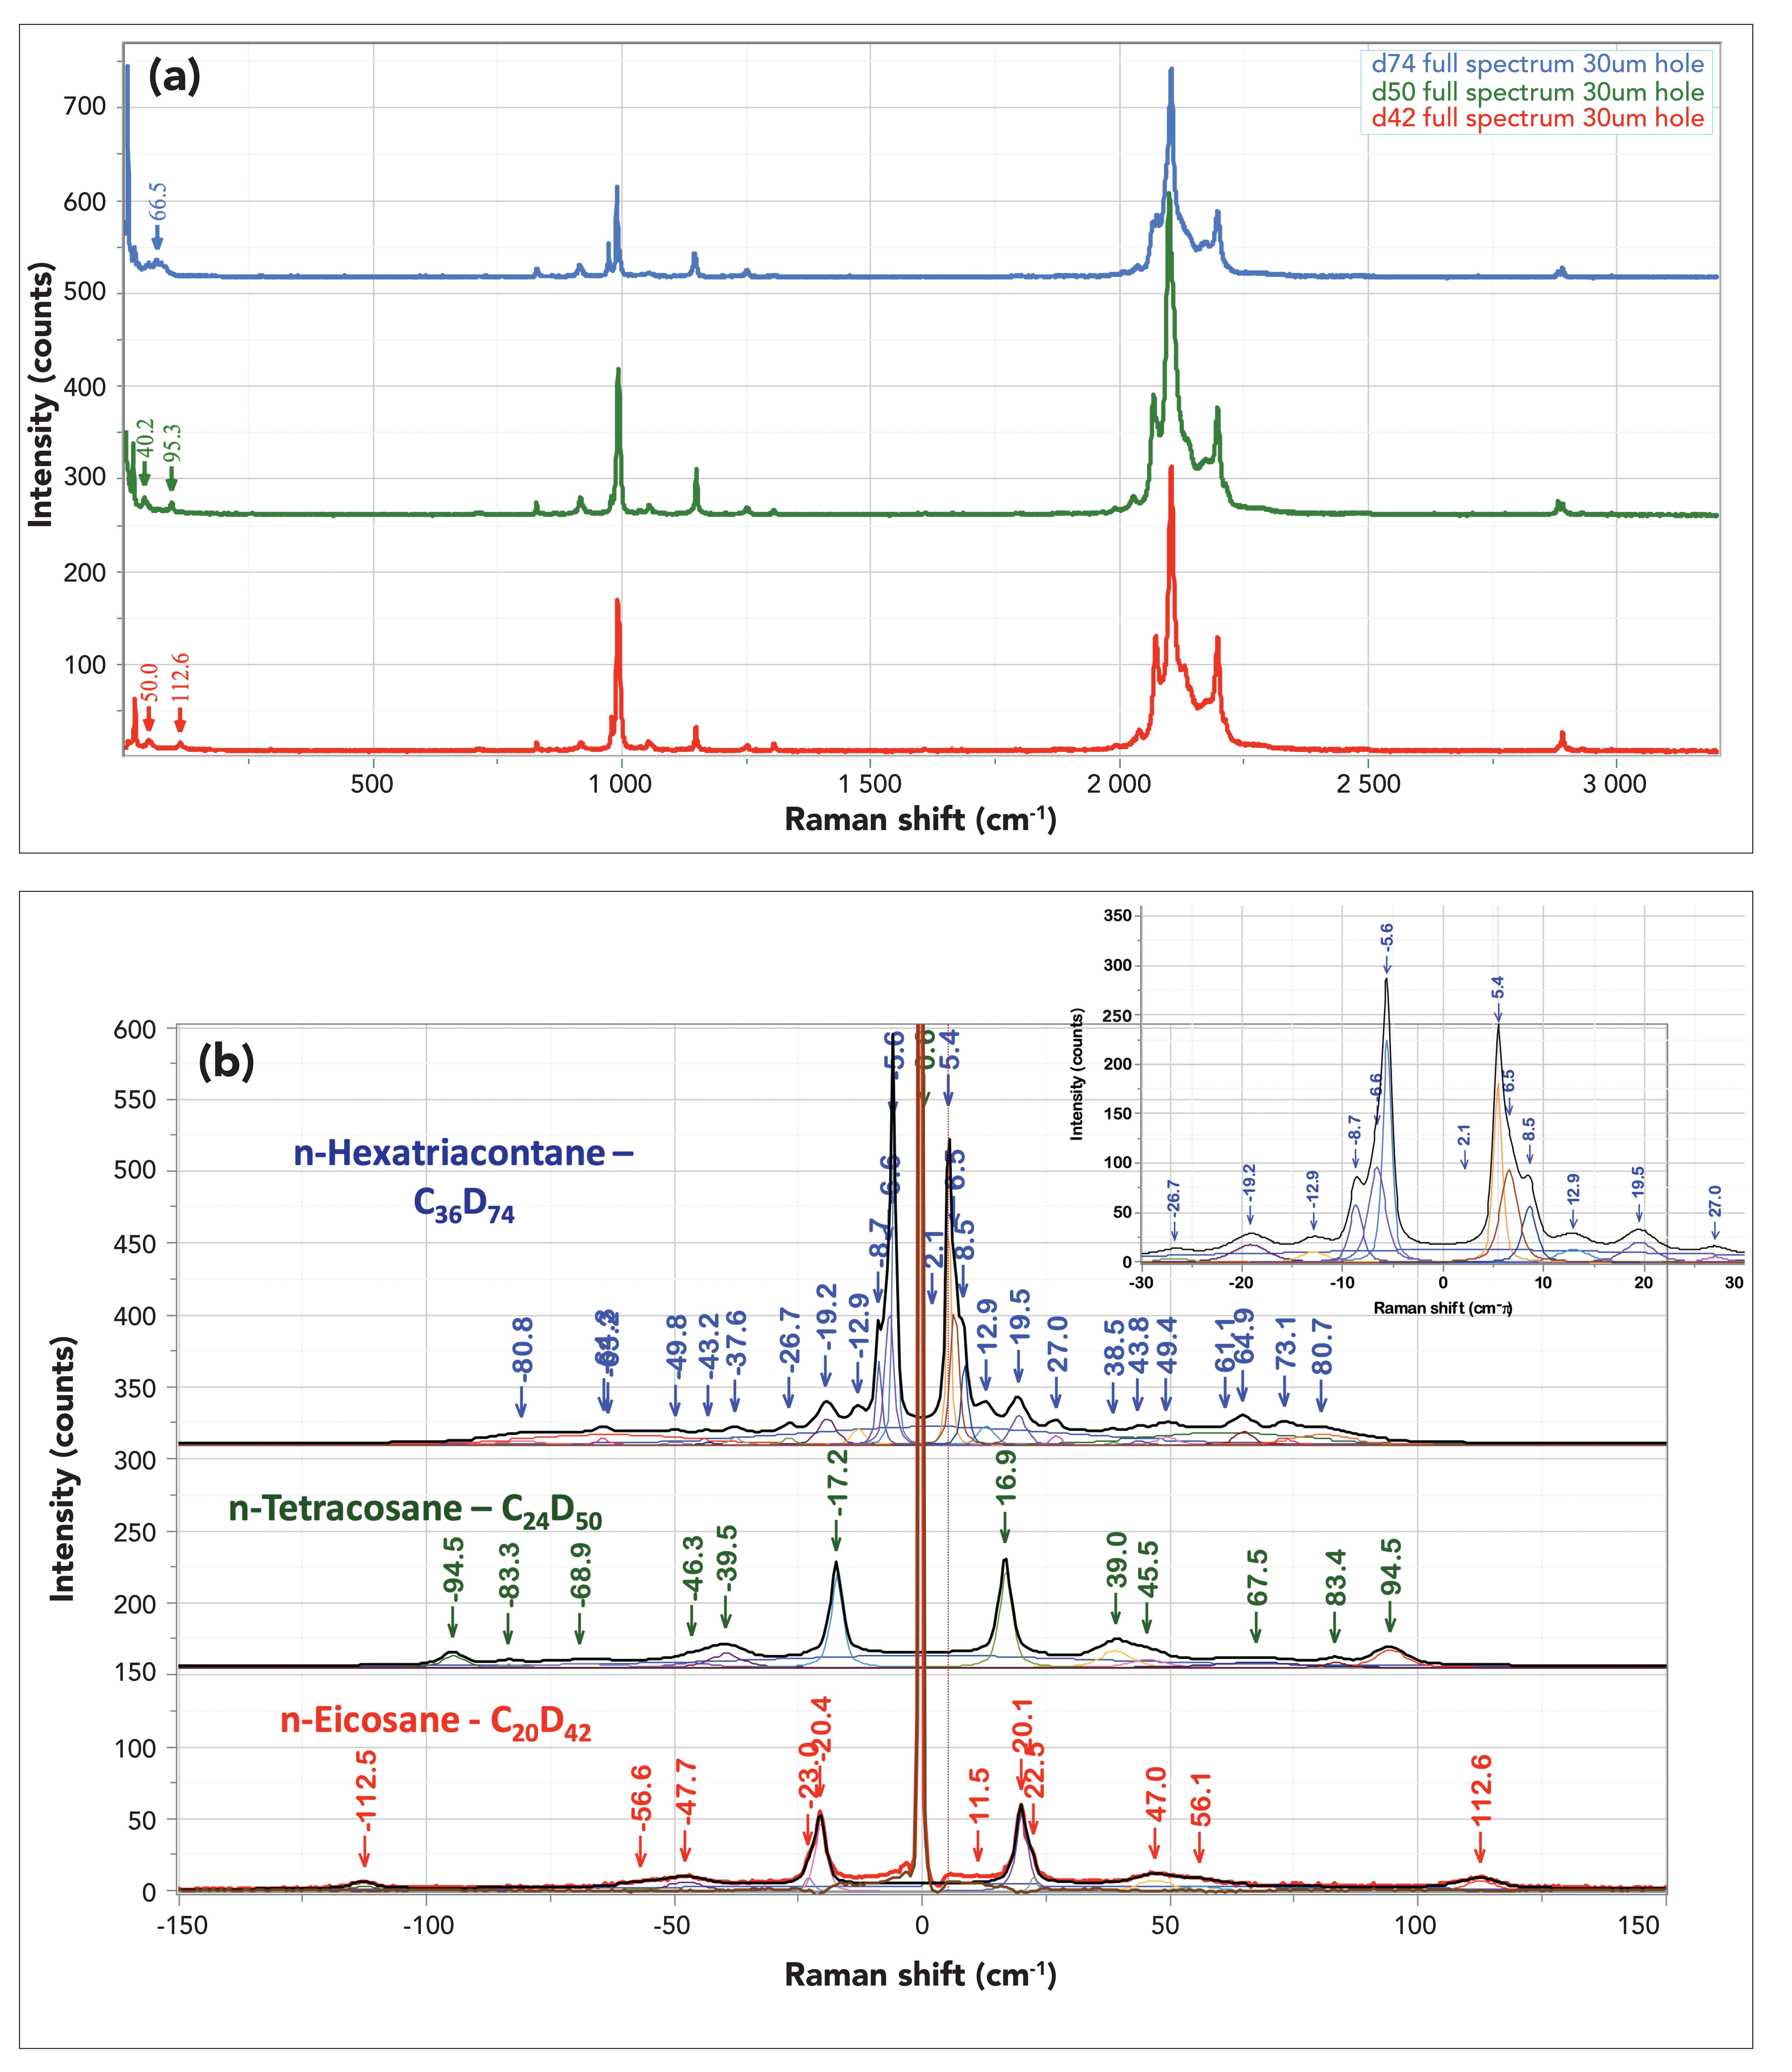
Examining Figure 2b, we see that, from top to bottom, the molecular weight decreases and the LAM mode increases from ~65 to ~95 to ~113 cm-1. Table II in reference (1) reports the LAM modes in these compounds (when hydrogenated) at 67, 98, and 114 cm-1. Note that the observed frequencies for the deuterated compounds are about 1–3 cm-1 lower in value, lower because a deuteron is heavier than a hydrogen atom, but not much lower because most of the molecular mass comes from the carbon atoms. In addition, each spectrum has another LAM mode (not shown) at a frequency slightly less than three times the first LAM mode, also in agreement with the predictions of reference (1). The remaining question is how to assign the ultralow frequency lines. Given that tetracosane and eicosane crystallize with only one molecular chain in the unit cell, these lines cannot be interpreted as molecular phonons, as originally expected, thus leaving the assignment to molecular librations, which are expected to drop in frequency as molecular weight (chain length) increases, as observed. In fact, after hunting around in the literature, I found numerous publications (3–8) that describe the entire set of low frequency modes as “transverse acoustic phonon branches.” These branches were described as mixtures of motion, including intramolecular skeletal vibrations, longitudinal acoustic modes, in-plane bending, out-of-plane bending, Rx and Ry (described as ν9 and ν5) which mix for large n, and out-of-plane bending, Rz. Note that, in our spectra, the LAM modes are definitely not the strongest as it was in published literature, probably because the low frequency performance of contemporary instruments is so much better than it was 40 to 50 years ago, when Herculean efforts were required to observe very low frequency bands, and because of orientation–polarization dependence of single crystals.
Comparison of C44H90 to C36H74 and to C36D74
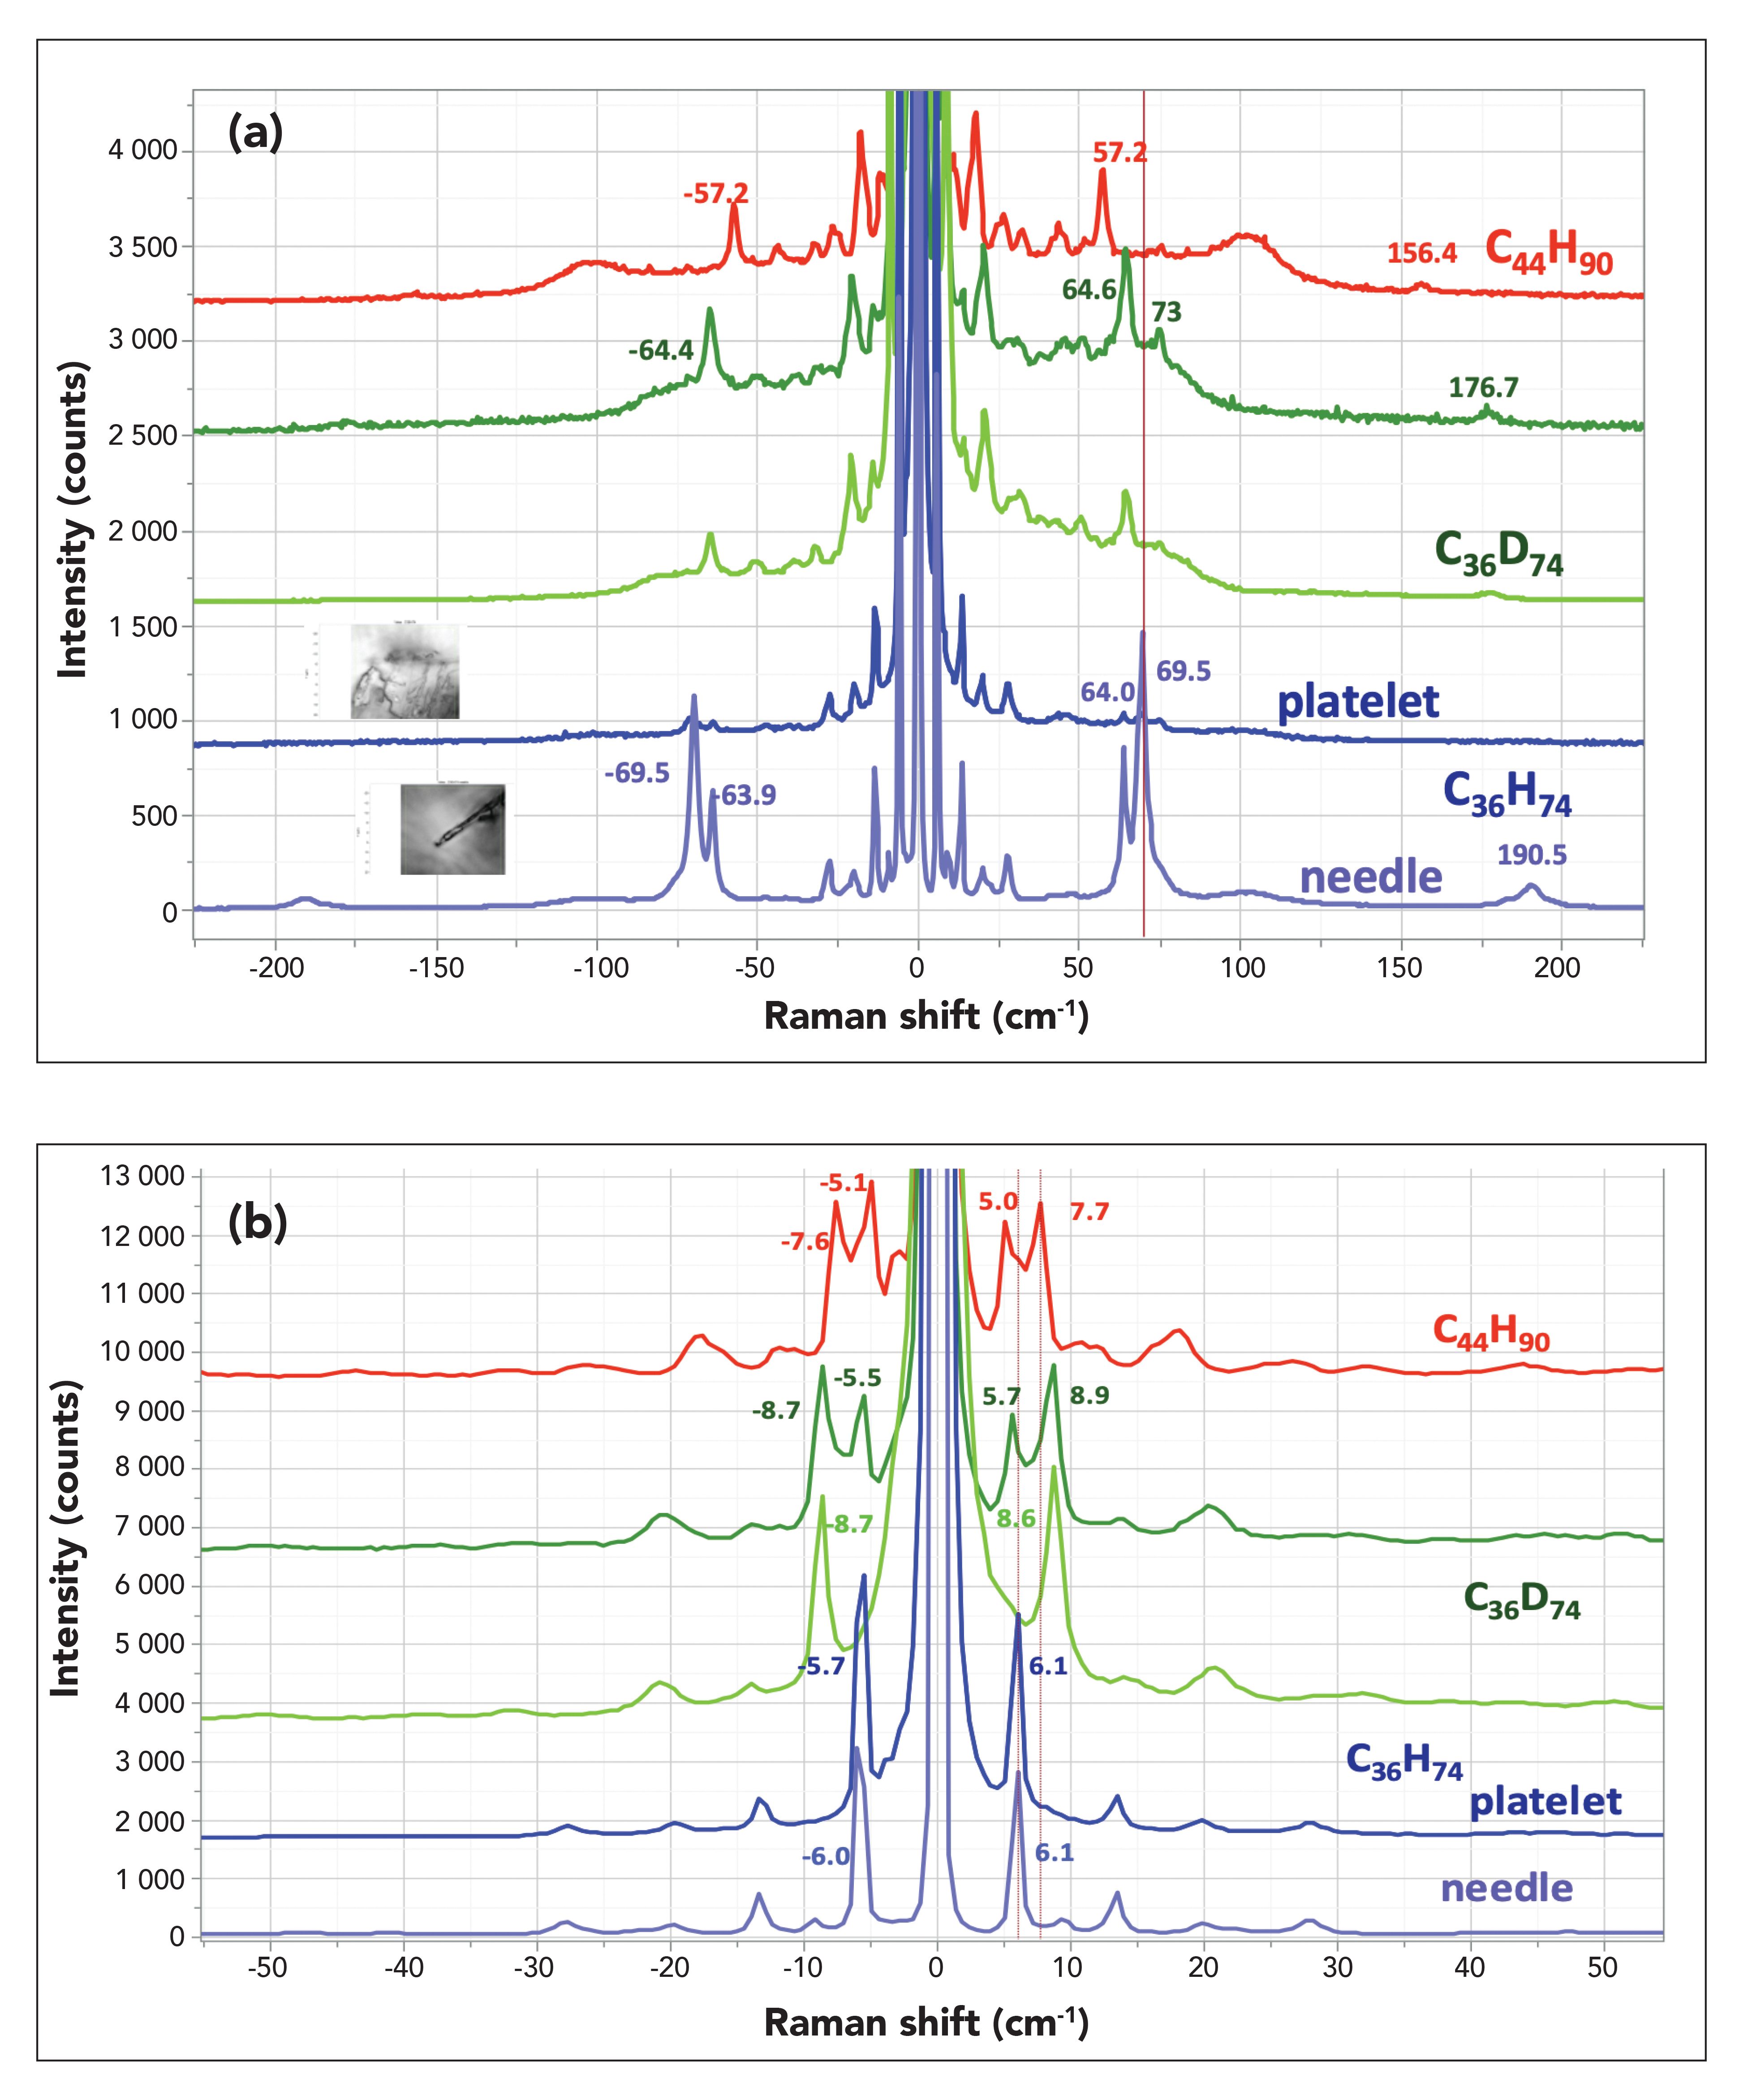
Another interesting comparison is between C36H74 (which was available in our stash), C36D74, and C44H90. In this case all samples are orthorombic, with the additional possibility of some monoclinic phase in either of the C36 samples, but both phases have two molecules in the unit cell. As we did previously, we display the spectra, first emphasizing the LAM modes, and then the ULF modes. Surprisingly, as we were hunting around for a more intense LAM mode in C36D74, we found a crystal with a needle habit that yielded a very strong doublet near the frequency of the expected LAM mode. Although not labeled, there are small peaks at the same frequency shifts in the platelet sample of C36D74, so it is not clear if the high intensity of the LAM peaks is due to the presence of a second crystallographic phase or to an orientation that provides higher intensity. From C36D74, we saw a LAM peak at slightly lower frequency, which is consistent with slightly heavier weight. The LAM peak in C44H90 has an even lower peak (57 cm-1 which is also to be expected for the increased molecular weight. In Figure 3b, we display the very low frequency spectra. The top two spectra exhibit a doublet in the lowest frequency region, but careful examination shows that the frequencies are not equivalent. This behavior was inconsistent across the samples, but when we observed it in C36D74 in one spectrum but not in another, we thought it would be interesting to document this. At this point, we do not have a self-consistent explanation for this behavior.
Figure 3: (a) From top to bottom spectra of a particle of C44H90, spectra of two particles of C36H74, and then spectra of a platelet and needle of C36H74. This display emphasizes the LAM mode near 60 cm-1. (b) From top to bottom spectra of a particle of C44H90, spectra of two particles of C36H74, and then spectra of a platelet and needle of C36H74. This display emphasizes the ULF bands below 20 cm-1.
Discussion
The quality of the low frequency part of the spectra of these alkanes is higher than that obtained when the LAM modes in PE and linear alkanes were first being investigated. We have seen that the first-order LAM modes fit the predictions based on chain length for their frequency shifts. What is also observed in the low frequency Raman spectrum is the third-order LAM, and those bands have also been labeled in Figure 3a. The prediction is that the ratio of the frequency shift is less than 3.013. For the three spectra shown in Figure 3a, we have values respectively (from top to bottom) of 156.2/57.2 = 2.73, 176.7/64.6 = 2.74 and 190.5/69.5 = 2.74; not only are these values less than 3.0, but they are remarkably close. However, reference (13) does not mention the possibility of the first-order LAM mode splitting, as is seen in the bottom of Figure 3a in the spectrum generated from the needle. On the other hand, Pietralla and associates (14) do discuss the effects on the frequencies of intermolecular coupling along the z-axis, which could possibly account for the splitting, either because of orientation or polymorphic difference, or both.
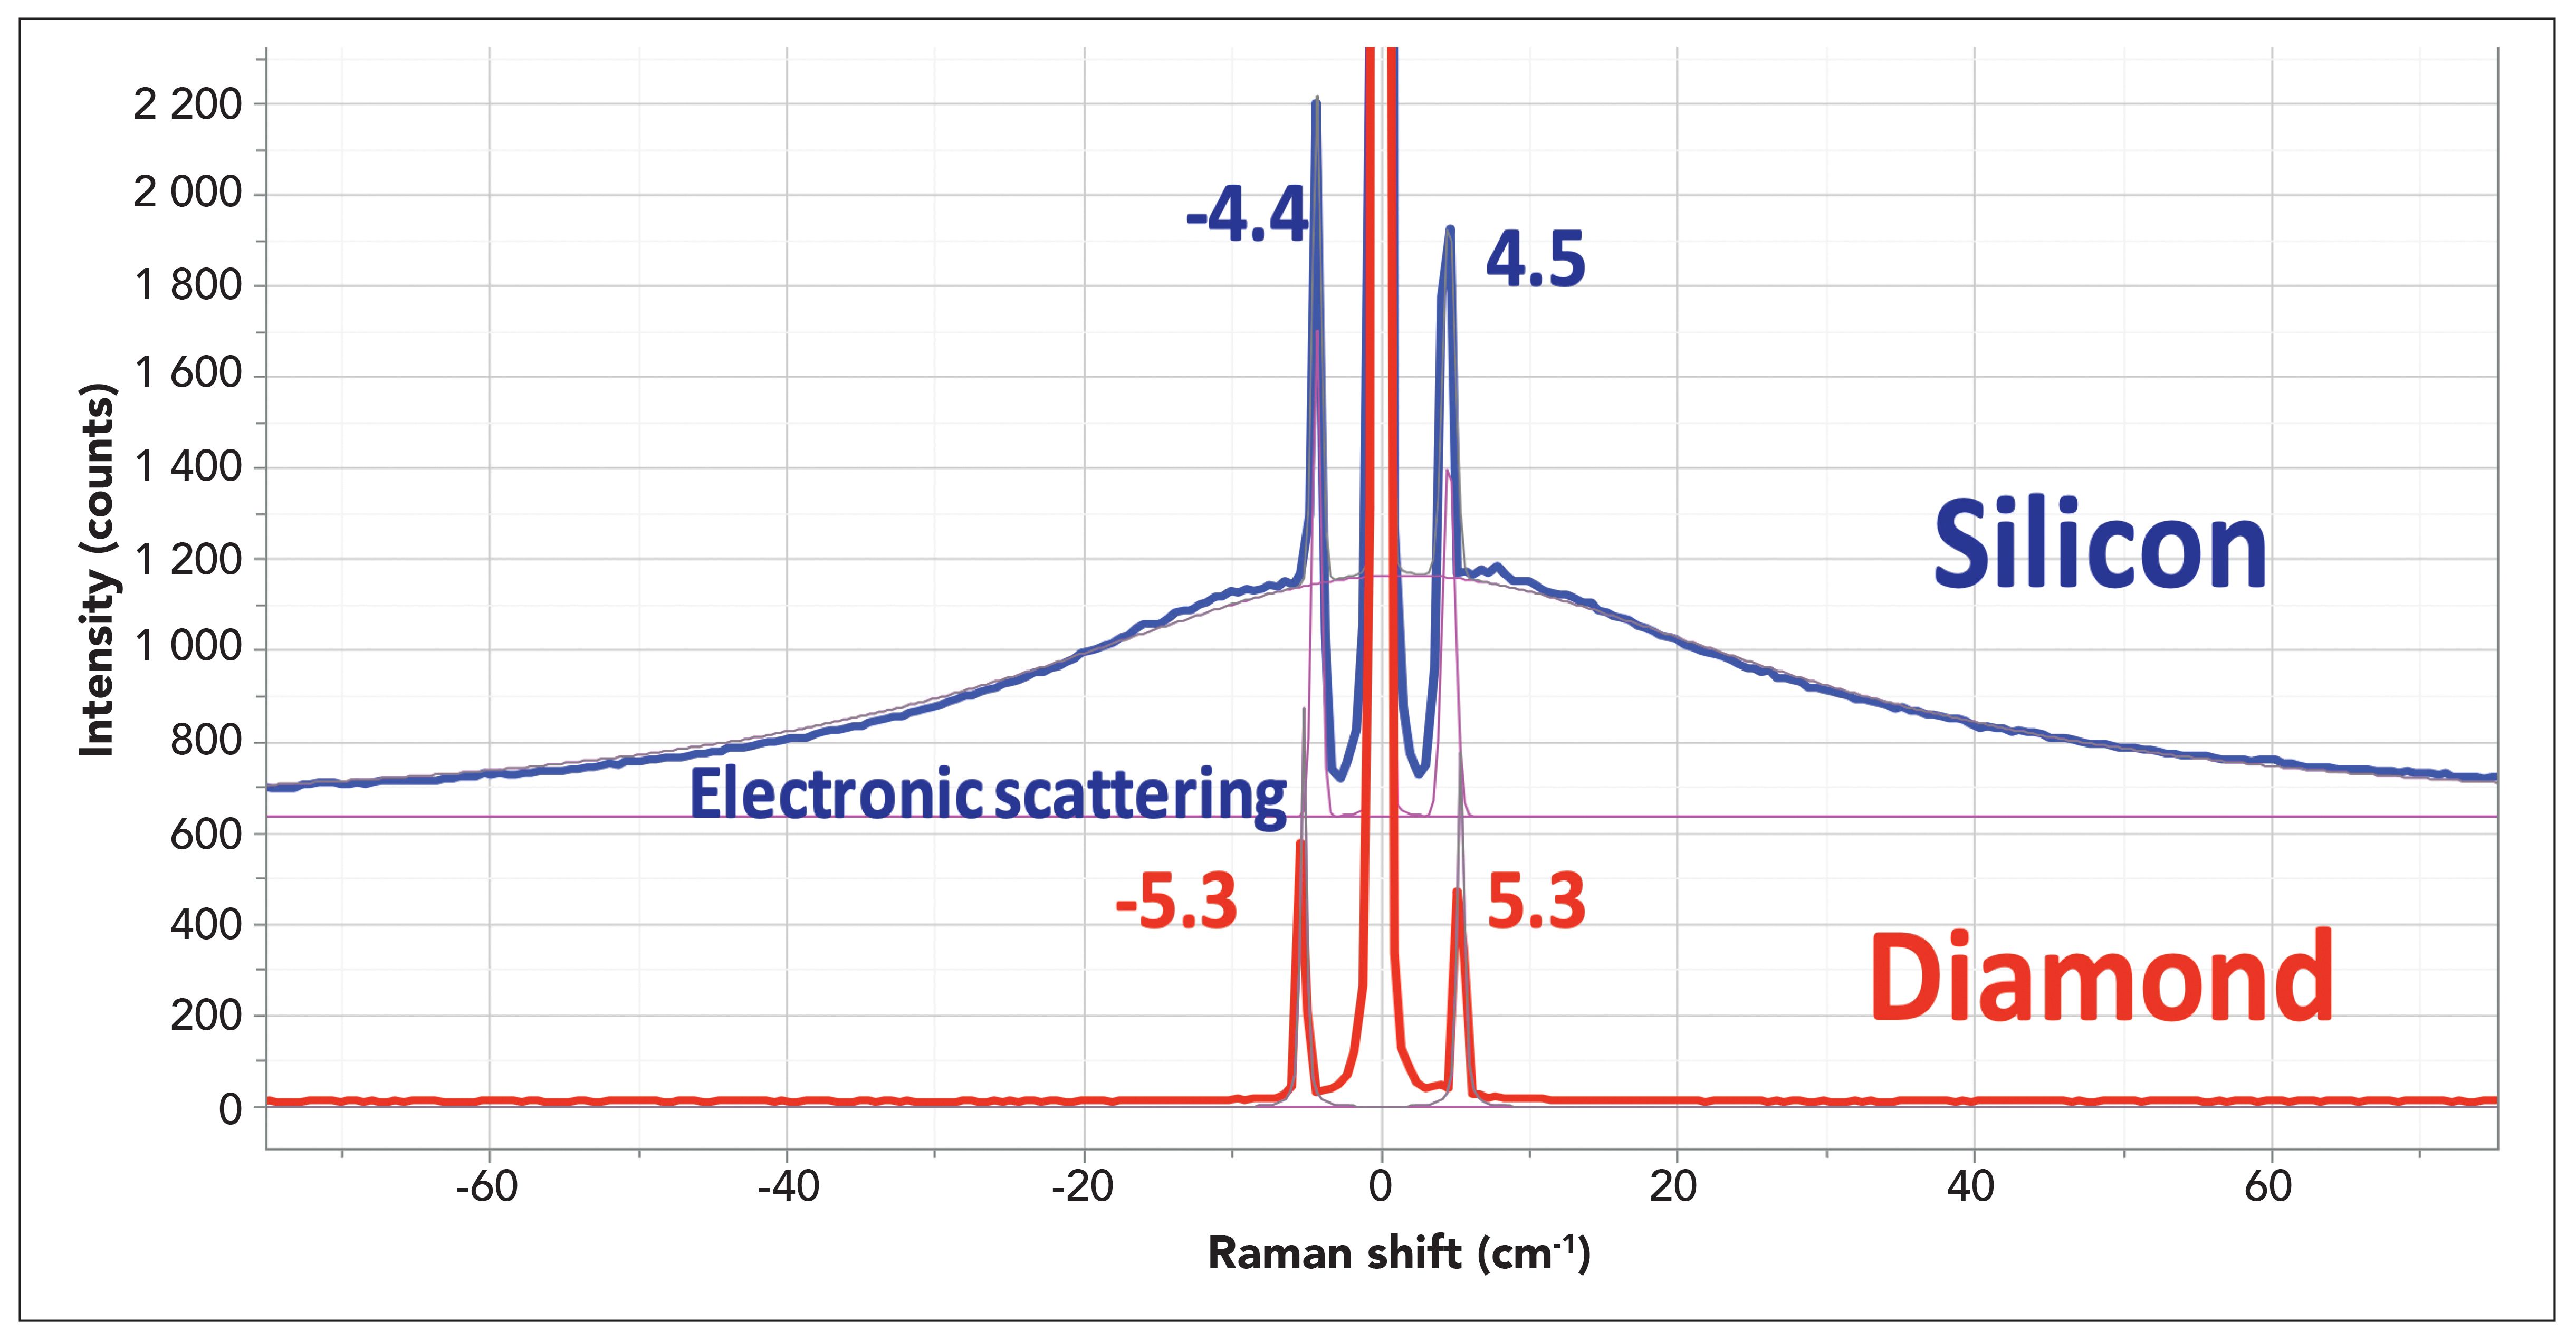
The possibility of experimental artifacts in these spectra had been considered. If, in fact, these bands could be coming from multiple reflections in the ULF filters, they would be the same in the spectra of all samples, which they are not. In addition, our SAS spectra of silicon and diamond are clearly different as well (Figure 4). So, we have to conclude that the results should be taken seriously.
Figure 4: SAS spectra of silicon and diamond illustrating the ability to observe acoustic phonons in crystals below even 5 cm-1. The broad background in the spectrum of silicon is assigned to scattering by free electrons in the semiconductor which means that this sample was doped. The apparent higher intensity on the anti-Stokes side appears because of the manner in which the light is distributed on the pixels of the CCD. The ratios of integrated areas in the Stokes–anti-Stokes bands is quite close to 1, which is what it should be at these low frequencies.
Conclusions
The spectra shown here document enhanced capabilities for making very low frequency shifted measurements on a conventional Raman microscope when it is equipped with volume Bragg gratings. The spectra are certainly not artifacts because bands on the Stokes and anti-Stokes Raman side are equivalent and because the spectrum is different for every sample. While we were expecting to observe LAM modes, we observed much more, with band peaks extending down below 5 cm-1 from the laser line. These spectra are consistent with the early literature describing the transverse acoustic phonon branches in addition to the longitudinal acoustic phonon, but because of the quality of the spectra in this frequency shifted range, the results are essentially new, and available for interpretation by the polymer physicists. We close by pointing out the potential relevance of these measurements to those of pharmaceutical small molecule active pharmaceutical ingredients (APIs) that are known to crystallize in multiple forms. Because the crystalline form affects the solubility, bioavailability, shelf life, and so on, the ability to make these measurements has relevance to the pharmaceutical industry as well as the polymer physicist. In addition, there are efforts to encapsulate APIs in lipids so very low frequency Raman measurements, providing information on the ordering of the lipid phase, could be of interest.
References
- R.F. Schaufele and T Shimanouchi, J. Chem. Phys. 47, 3605–3610 (1967).
- S. Califano, V. Schettino, and N. Neto, in Lecture Notes in Chemistry, Volume 26 (Springer, Berlin, Germany, 1981).
- M. Tasumi and S. Krimm, J. Chem. Phys. 46(2), 755–766 (1967).
- H.G. Olf and B. Fanconi, J. Chem. Phys. 59(1), 534–544 (1973).
- G. Vergoten, G. Fleury, M. Tasumi, and T. Shimanouchi, Chem. Phys. Lett. 19(2), 191–194 (1973).
- T. Takeuchi, T. Shimanouchi, M. Tasumi, G. Vergoten and G. Fleury, Chem. Phys. Lett. 28(3), 449–453 (1974).
- M. Kobayashi, T. Kobayashi, T. Uesaka, and H. Tadakoro, Spectrochim. Acta 35(A), 1277–1283 (1979).
- M. Tasumi and T Shimanouchi, J. Chem. Phys. 43, 1245–1258 (1965).
- F.J. Boerio and J.L. Koenig, J Chem. Phys. 52(7), 3425–3431 (1970).
- S. Abbate, M. Gussoni and G. Zerbi, J. Chem. Phys. 70, 3577–3585 (1979).
- R.G. Snyder, J. Chem. Phys. 71, 3229–3235 (1979).
- M. Kobayashi, H. Tadokoro, and R.S. Porter, J. Chem. Phys. 73(8), 3635–3642 (1980).
- R.G. Snyder, H.L. Strauss, R. Alamo, and L. Mandelkern, J. Chem. Phys. 100, 5422–5431 (1994).
- M. Pietralla, R. Hotz, T. Engst, and R. Siems, J. Polym. Sci. B Polym. Phys. 35(1) 47–57 (1997).

Fran Adar is the Principal Raman Applications Scientist for Horiba Scientific in Edison, New Jersey. Direct correspondence to: SpectroscopyEdit@mmhgroup.com.

New Study Reveals Insights into Phenol’s Behavior in Ice
April 16th 2025A new study published in Spectrochimica Acta Part A by Dominik Heger and colleagues at Masaryk University reveals that phenol's photophysical properties change significantly when frozen, potentially enabling its breakdown by sunlight in icy environments.
Advanced Raman Spectroscopy Method Boosts Precision in Drug Component Detection
April 7th 2025Researchers in China have developed a rapid, non-destructive Raman spectroscopy method that accurately detects active components in complex drug formulations by combining advanced algorithms to eliminate noise and fluorescence interference.