Why and How to Avoid Ionic Contamination in Water Used for LC–MS Analyses
Special Issues
Ionic contaminants in the water used in UHPLC analyses with MS detection method lead to adduct formation and reduced analytical signals because of ion suppression. In MS, the preferred ion type is the protonated molecular ion, especially in peptide analysis, since the partially mobile proton charge enables more meaningful fragmentation analysis, as compared to a sodiated peptide ion.
Ionic contaminants in the water used in ultrahigh-pressure liquid chromatography (UHPLC) analyses with mass spectrometry (MS) detection lead to adduct formation and reduced analytical signals because of ion suppression. In MS, the preferred ion type is the protonated molecular ion, especially in peptide analysis, since the partially mobile proton charge enables more meaningful fragmentation analysis, as compared to a sodiated peptide ion. Moreover, the occurrence of protonated analyte signals demonstrates that solvents and reagents, as well as the MS instrument used in analyses, were clean and did not contribute any contaminating cationic components to the analytical process. In the experiments presented here, it was observed that the signal intensities of the protonated species decreased as the sodium ion concentration in the water increased. This was accompanied by an increase in the intensity of sodiated adducts.
Water plays an essential role in liquid chromatography-mass spectrometry (LC-MS), where it is used extensively in the workflow. Contaminants in the water can affect the quality of data and instrument performance; therefore, it is recommended and prudent to use only the highest purity solvents. Organic contamination of the water used in high performance liquid chromatography (HPLC) is an important issue and has been addressed accordingly (1), but the ionic purity of the water should also be considered, especially when MS is used as a detection technique (2). Ionic contaminants lead to adduct formation and reduced analytical signals because of ion suppression.
Electrospray ionization (ESI) remains the most popular MS technique. In positive-ion analyses, it is ideal to have only protonated peaks of the parent ion or its fragments in the mass spectrum. The presence of metal adduct peaks, such as sodium adducts (M+Na), makes data analysis more challenging and complicated. Metal ions may come from several possible sources (3) such as solvent reservoirs, gloves, the analyst, and the solvents used in preparing the mobile phase. Therefore, using ultrapure water free of metal ions will contribute to the success of any LC-MS analysis.
ExperimentalExperiments to Evaluate the Effect of Ionic Contamination in Water on MS Data
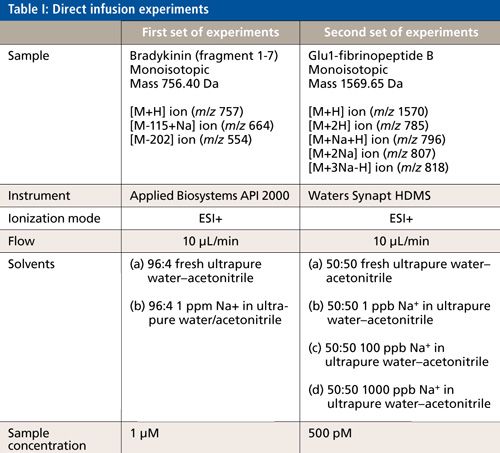
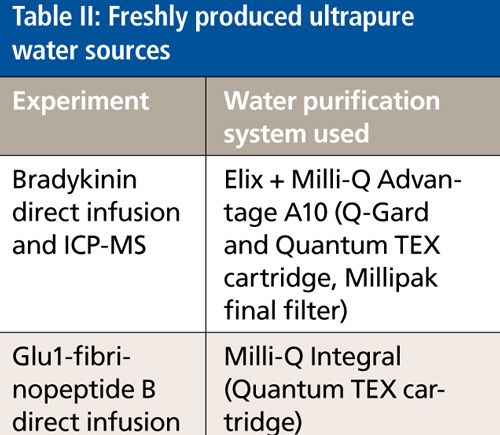
Two compounds, bradykinin fragment 1-7 and Glu1-fibrinopeptide B, were used to investigate the effect of ionic contamination on LC-MS analyses. Different samples of peptides were prepared and infused directly to a mass spectrometer. The experimental details for peptide analyses are described in Table I.
Experiments to Identify the Levels of Ions in Ultrapure Water
To evaluate the level of sodium in ultrapure water, water samples from an EMD Millipore Milli-Q Advantage A10 water purification system were analyzed using an Agilent 7700s inductively coupled plasma-mass spectrometry (ICP-MS) instrument (4). The calibration standards used in experiments were a mixture of Agilent and Spex CertiPrep, and containers were all perfluoralkoxy (PFA) polymer precleaned with ultrapure water.
Water Purification Systems
All ultrapure water samples (resistivity of 18.2 MΩ·cm and total oxidizable carbon [TOC] below 5 ppb) from EMD Millipore water purification systems were analyzed immediately after water collection.
Results and Discussion
Effect of Ionic Contamination in Water on MS Data
The quality of LC-MS data is influenced by many factors, such as instrumentation, experimental parameters, sample preparation, the quality of reagents used, and the quality of solvents (5). Water is used extensively in reversed-phase LC-MS workflows; therefore, its purity plays a critical role in instrument performance and the quality of data generated.
The purity of water for LC-MS work is mainly assessed through organic contamination, which can be expressed by the level of TOC (6), or by certificates of analysis reporting results of suitability tests.
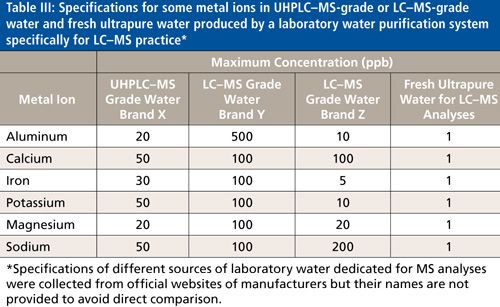
The second approach to evaluate water quality for LC-MS analyses is to assess its level of ionic purity. Thus, for bottled water, certificates of analysis usually detail maximum concentrations for certain ions because when stored in a glass bottle, the water will leach out contaminants from the container even though the water may have been of very high purity immediately after production. For example, standard glass bottles leach out alkali, contaminating ultrapure water and leading to a higher count of adducts. Since the quality of bottles can vary strongly from one to another, the nature of ions selected to report in the certificate of analysis depends on the quality of the bottle used to store the water. Table III compares the specifications for some metal ions in ultrahigh-pressure liquid chromatography (UHPLC)-MS-grade, LC-MS-grade bottled waters from three vendors, and in fresh ultrapure water.
Because ionic impurities present in water increase its conductivity, the conductivity parameter, or alternatively its inverse, resistivity, can be used to characterize the ionic purity of water.
Thus, at 25 °C, conductivity of 0.055 µS/cm, or resistivity of 18.2 MΩ·cm, implies that the water is ultrapure, whereas at 1 ppb of Na+ in ultrapure water, resistivity decreases to 17.6 MΩ·cm, and at 5 ppm, dramatically drops down to 0.093 MΩ·cm; these values can be calculated based on the concentration of sodium, its charge, and mobility (7). Therefore, when fresh ultrapure water of 18.2 MΩ·cm resistivity measured via an in-line monitor was used to dissolve a peptide sample (bradykinin fragment 1-7), and infused directly to a mass spectrometer, the resulting spectrum was clean (Figure 1a). The parent and fragment peaks represented only protonated species. However, when the water used was contaminated with sodium ions, the spectrum was more complex with the presence of sodium adduct peaks (Figure 1b).
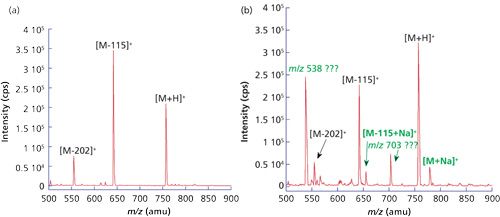
Figure 1: Mass spectra of bradykinin (fragments 1-7). Direct infusion, ESI+, using (a) 96% fresh ultrapure water, 4% acetonitrile and (b) 96% 1 ppm Na+, 4% acetonitrile.
The presence of metal ions can suppress the signal of the protonated ion peak of interest. The effect of the sodium ion on the signal intensity of Glu1-fibrinopeptide B was analyzed by varying the ion concentration in the water-acetonitrile mixture that was used to dissolve the peptide. It was observed that signal intensity of the [M+2H] molecular ion decreased with the increase of sodium ion concentration in the water. In parallel, it was observed that signal intensities of the sodium adducts increased with the increase in Na+ concentration (Figures 2a, 2b, and 2c).
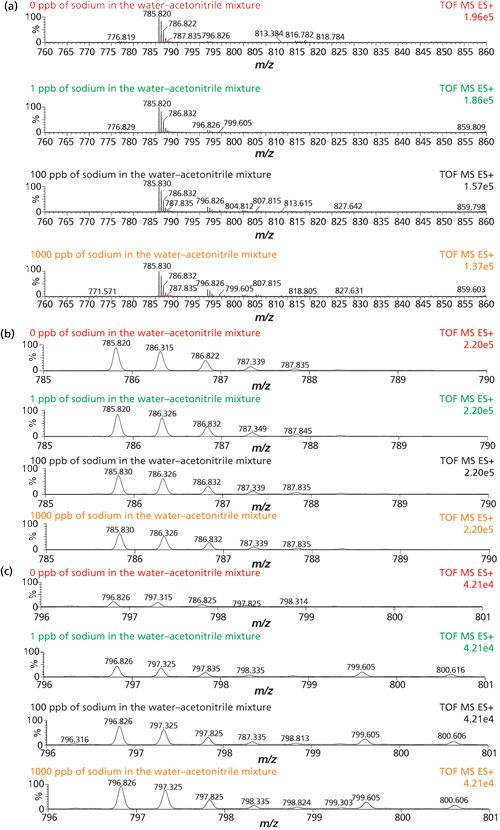
Figure 2: (a) Mass spectra of protonated molecular ion [M+2H] of Glu1-fibrinopeptide B sample, (b) and (c) extracted ion chromatograms of [M+Na+H] ion as examples of the effect of ionic concentration on MS detection.
Further signal intensities of Glu1-fibrinopeptide B such as the [M+2H], [M+Na+H], [M+2Na], and [M+3Na-H] ions were recorded for each analyzed sample and presented as a function of Na+ concentration in water (Figure 3).
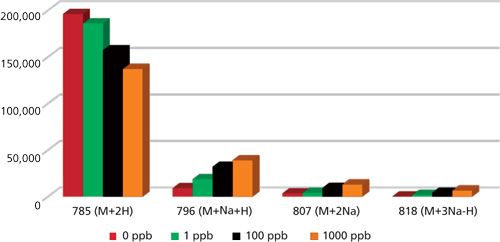
Figure 3: Signal intensities of 500 pmol Glu1-fibrinopeptide B in 50:50 (v/v) acetonitrile-water. The mixture was spiked with different amounts of sodium ions and injected directly into the mass spectrometer.
Specifically, the presence of 1 ppb of Na+ decreased the [M+2H] signal intensity by 5%. But the decrease in signal was 20% with 100 ppb Na+, and 30% when it was 1000 ppb. Altogether the presence of sodium results in more complex spectra, leading to difficulties in data characterization, analyte quantification, and subsequently more time spent on data analysis. Therefore, using water in LC-MS analyses that is free of ions is of high importance. In addition, there are a few key considerations to keep in mind when choosing the source of ultrapure water, and also when handling it to minimize contamination.
Five Tips to Avoid Ionic Contamination in LC-MS Practice 1. Choose the Best Source of Ultrapure Water
Common choices are freshly produced ultrapure water from a laboratory water purification system, and bottled water, such as UHPLC-MS grade or LC-MS grade. Fresh ultrapure water produced using an optimal combination of purification technologies is usually of very high purity, with ionic levels below 1 ppb at 18.2 MΩ·cm of resistivity, which can be monitored online at the moment of water collection. In the case of bottled water, specifications of ionic purity for laboratory water are usually provided and can be easily consulted to assess the potential risk of ionic contamination on LC-MS analyses.
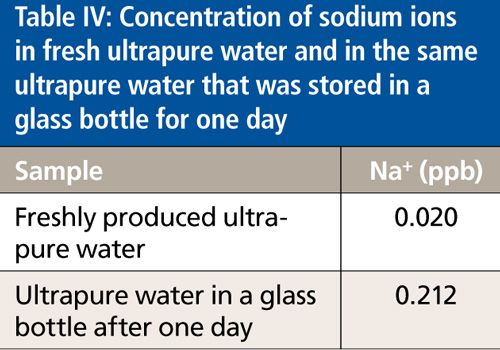
Because ultrapure water is a very aggressive solvent, it tends to absorb ions and organic compounds from the container. Thus, maximum concentrations of ions in final ultrapure product water depend significantly on the level of extractables released by the containers used to collect freshly produced ultrapure water, or to store it, in the case of bottled water. Table IV shows the concentration of Na+ in freshly produced ultrapure water and ultrapure water after storage in a glass bottle for one day.
As shown in Table IV, the Na+ concentration in freshly produced ultrapure water was 0.020 ppb. After storage in a glass bottle, the concentration increased to 0.212 ppb.
2. Choose Glassware of the Highest Quality That Leaches the Minimum Amount of Contamination
It is also recommendable to have dedicated glassware for LC-MS practice, and glassware should be cleaned thoroughly before use.
3. Keep Your Work Area Clean
Moreover, since laboratory air is characterized by a lot of contamination and as ultrapure water absorbs contamination from the air including volatile molecules (8), the working area should be kept clean (9). Appropriate covers and caps for mobile-phase reservoirs and glassware can help to avoid contact between ultrapure water and the laboratory air, as well. It is also a good idea to wear gloves, and choose ones that are powder-free and have the fewest metal or ion extractables (for example, polyethylene) because simply touching glassware with a bare hand can transfer enough salt to cause a significant appearance of metal adduct ions.
4. Select Reagents and Organic Solvents of the Highest Purity
Here, to evaluate the purity level necessary for sensitive MS applications, a certificate of analysis is a good source of information. Also, it is recommended to obtain details from the supplier beforehand concerning the level of leachables and extractables from solvent and reagent packaging.
5. Routine Maintenance
When using a laboratory water purification system, make sure that it undergoes routine maintenance to ensure the highest water quality.
Ion Removal in Laboratory Water Purification Systems
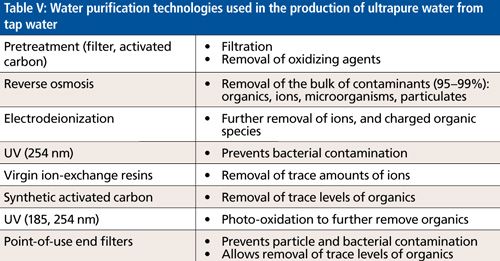
The laboratory water purification systems used in this study combine the technologies shown in Table V to efficiently remove different types of contaminants from tap water feed. The removal of ions is carried out by using reverse osmosis, electrodeionization, and ion exchange resins.
To ensure the efficiency of the purification process and make sure that the ultrapure water contains the lowest possible ionic content, resistivity monitoring can be used. Ultrapure water of 18.2 MΩ·cm resistivity refers to ultrapure water free of a significant level of ions for LC-MS analyses.
Conclusion
The presence of ions in the water used for LC–MS analyses influences the quality of data by forming metal adducts and suppressing analyte signals. To avoid ionic contamination, it is recommended to use fresh ultrapure water when preparing mobile phases. It is also important to apply best laboratory practices.
Acknowledgment
The authors would like to acknowledge Jens Baumgaertner of Merck KGaA in Darmstadt, Germany, and Maricar Tarun-Dube of EMD Millipore Corporation in Danvers, Massachusetts, for their help with this article.
References
(1) M. Tarun, C. Monferran, C. Devaux, and S. Mabic, LCGC The Peak, 7-14 (2009).
(2) B.O. Keller, J. Sui, A.B. Young, and R.M. Whittal, Anal. Chim. Acta6(27), 71-81 (2008).
(3) M. Oehme, U. Berger, S. Brombacher, F. Kuhn, and S. Kolliker, TrAC, Trend Anal. Chem.21, 322-331 (2002).
(4) A. Khvataeva-Domanov, G. Woods, and S. Mabic, “Choosing Optimal High Purity Water Source in Accordance to ICP-MS Application Needs and Laboratory Environment,” presented at the Winter Conference on Plasma Spectrochemistry, Amelia Island, Florida, 2014.
(5) M.J. Capdeville and H. Budzinsk, TrAC, Trend Anal. Chem.30, 586-606 (2011).
(6) C. Regnault, I. Kano, D. Darbouret, and S. Mabic, J. Chromatogr. A.1030, 289-295 (2004).
(7) E. Riché, A. Carrié, N. Andin, and S. Mabic, High-Purity Water and pH Am. Lab. (Boston) 16, 22-23 (2006)
(8) N. Nioradze, R. Chen, N. Kurapati, A. Khvataeva-Domanov, S. Mabic, and S. Amemiya, Anal. Chem.89, 4836-4843 (2015).
(9) I. Rodushkin, E. Engstrom, and D.C. Baxter, Anal. Bioanal. Chem.396, 365-377 (2010).
Anastasia Khvataeva-Domanov and Stéphane Mabic are with Millipore S.A.S. in Saint-Quentin-en-Yvelines, France.
Direct correspondence to: anastasia.khvataeva@emdmillipore.com

Rapid, Portable Mid-Infrared Spectroscopy Identifies Aflatoxins in Peanuts
March 10th 2025Researchers have developed a portable mid-infrared (IR) spectroscopic method combined with chemometric analysis to rapidly and non-destructively detect aflatoxin contamination in Aspergillus-infected peanuts. This approach offers a field-deployable alternative to traditional wet chemistry methods, with high sensitivity and specificity in identifying toxic metabolites such as aflatoxins.
More Than Just Acronyms at EAS 2023
November 14th 2023Award recipient John McLean of Vanderbilt University said hybrid techniques do not exist purely as combinations of letters, slashes, and hyphens—they have been built on the shoulders of decades’ worth of analysis intended to refine and simplify workflow.
A Look at Rapid Quantification of PFAS in Non-Potable Waters
March 1st 2020The presence of per- and polyfluoralkyl substances (PFAS) in water is an important health and environmental concern. Liquid chromatography–mass spectrometry (LC–MS) has been established as the most suitable technology for monitoring these substances. A method is described, using EPA 8327, for PFAS analysis in groundwater, surface water, and wastewater.
Determination of Very Low Abundance Diagnostic Proteins in Serum Using Immunocapture LC–MS/MS
July 1st 2017There is growing interest in the determination of endogenous proteins in biological samples for diagnostic purposes, because a concentration increase or decrease of such proteins can allows us to monitor the state of a pathological condition such as cancer. Immunocapture LC–MS/MS analysis combines the workflow of conventional immunological assays with LC–MS analysis. This article describes typical challenges, such as cross reactivity and the mass spectrometer’s dynamic range, as well as the advantages of isoform differentiation and multiplexing.
Ion Mobility Spectrometers as Chromatographic Detectors
July 1st 2017Interest in connecting ion mobility spectrometry (IMS) to GC and especially to LC is now growing. One favorable property of IMS is that it can work with ambient pressure and can be easily connected to a gas or liquid chromatograph. Analytical applications of GC–MS and LC–MS are very different and encompass investigations into food, medical science, environment, drugs of abuse, chemical warfare agents, and explosives.