VT-DRIFTS Investigations of Interactions Between Benzoic Acid and Montmorillonite Clay
Spectroscopy
High stability Fourier transform-infrared (FT-IR) interferometers make it possible to conduct experiments designed to identify subtle sample structure changes resulting from external perturbations. In particular, IR spectrum measurements obtained while heating samples can be used to associate specific structure changes with incremental additions of thermal energy. This paper describes the application of variable temperature diffuse reflection infrared Fourier transform spectroscopy (VT-DRIFTS) for analysis of benzoic acid adsorbed on montmorillonite clay. The technique described here is generally applicable for soil adsorbate characterization studies, and therefore should be useful for elucidating soil transport mechanisms for selected contaminants.
High-stability Fourier transform infrared (FT-IR) interferometers make it possible to conduct experiments designed to identify subtle sample structure changes resulting from external perturbations. In particular, IR spectrum measurements obtained while heating samples can be used to associate specific structure changes with incremental additions of thermal energy. This article describes the application of variable-temperature diffuse reflection infrared Fourier transform spectroscopy (VT-DRIFTS) for the analysis of benzoic acid adsorbed on montmorillonite clay. The technique described here is generally applicable for soil adsorbate characterization studies and, therefore, should be useful for elucidating soil transport mechanisms for selected contaminants.
Infrared (IR) spectroscopy has historically been an important analytical tool for the characterization of both organic and inorganic materials. IR spectra contain absorbance bands that uniquely represent molecular vibrations. Diffuse reflection infrared Fourier transform spectroscopy (DRIFTS) is particularly well suited for solid-state sample characterizations. Compared to film, pellet, and mull techniques, DRIFTS is easier to implement and requires less sample preparation. Whereas conventional transmission IR spectroscopy intensities are dependent on pathlength, which is difficult to reproduce for solid samples, DRIFTS band intensities depend on scattering coefficient, which is predominantly determined by particle size. The apparatus and procedures used for making DRIFTS measurements have continually improved during the past 30 years. The properties of the optical systems used to measure diffuse reflection IR spectra have been characterized (1–3) and the effects of sample properties on DRIFTS spectra have been reported (4–6). DRIFTS is well suited for characterizing surface interactions between adsorbates and minerals. Consequently, it is often used for soil contaminant studies (7–10).
The United States Environmental Protection Agency (US EPA) has identified organic acids as a primary source of contamination (11,12). Benzoic acid, which consists of an acid functionality attached to an aromatic ring, is the simplest aromatic acid. It can inhibit bacterial and plant growth and is extensively used as a food preservative (13). In soils, it is typically adsorbed by the clay component (14). As a result, benzoic acid interactions with clays have been extensively studied (11,14–21). These studies have primarily focused on montmorillonites because this type of clay is ubiquitous in soils. Montmorillonite clays have a unique structure, consisting of two negatively charged oxide layers separated by an interlayer space containing exchangeable cations and water (22).
Interactions between benzoic acid and montmorillonite clays were previously studied by thermo-IR (15) and thermogravimetry( 17). By using thermo-IR, Yariv and colleagues (15) reported that the C=O stretching vibration frequency of benzoic acid adsorbed on montmorillonite clays depended on the cation present in the interlayer space and on the extent of clay dehydration. In a thermogravimetry study of benzoic acid-clay interactions, Lu and colleagues (17) reported that the maximum rate of benzoic acid desorption from sodium montmorillonite occurred at 140 °C, which was significantly lower than from calcium montmorillonite
(179 °C). They attributed the higher desorption temperature for the clay containing calcium to stronger interactions between calcium ions and benzoic acid molecules.
To characterize benzoic acid-clay interactions in greater detail, in situ analysis by using variable-temperature diffuse reflection infrared Fourier transform spectroscopy (VT-DRIFTS) can be performed (23,24). VT-DRIFTS provides a sensitive means for discerning subtle temperature-dependent structural changes in solid materials. To obtain high-quality VT-DRIFTS measurements, it is necessary to account for instrumental changes caused by heating the sample in addition to factors that must be considered when making isothermal DRIFTS measurements (25–27). The methodology used for VT-DRIFTS is outlined here, along with examples of results obtained from the analysis of a sample consisting of 2% (w/w) benzoic acid adsorbed on montmorillonite clay.
Experimental
Montmorillonite (K10) and benzoic acid were purchased from Sigma-Aldrich. Calcium chloride was purchased from Fisher Scientific. Silver powder (100 mesh, 99.95%) was purchased from Alfa Aesar. Carbon tetrachloride was purchased from JT Baker Chemical Company. All chemicals were used as received without additional purification. Montmorillonite clay with predominantly Ca2+ interlayer ions (CaMMT) was prepared by cation exchange with the metal chloride solution by following previously described procedures (28,29).
The cation-exchanged clay was loaded with 2% (w/w) benzoic acid by incipient wetness. Benzoic acid was dissolved in carbon tetrachloride, and the solution was mixed with the montmorillonite clay. The mixture was stirred for 30 min at room temperature, then the solvent was removed by roto-evaporation for 90 min at room temperature. Samples were prepared for VT-DRIFTS analysis by diluting with silver powder in a 5:95 ratio by weight (that is, 5% [w/w]). Silver powder diluent, which is highly scattering and inert for this application, was used to eliminate spectral artifacts that appear in IR spectra when neat samples are analyzed by DRIFTS (vide infra). Approximately 15-mg samples were used for VT-DRIFTS analysis.
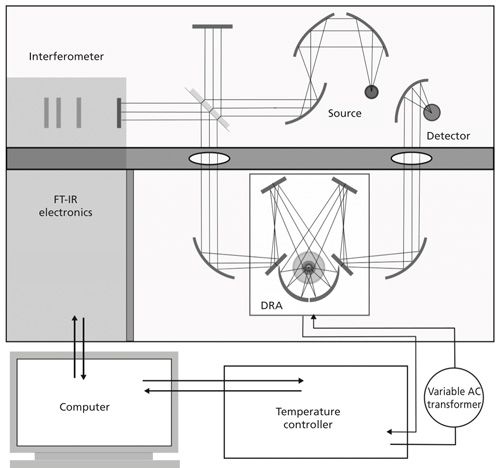
IR spectra were collected by using a Mattson Instruments Inc., Nova Cygni 120 FTIR system. The apparatus is described in detail elsewhere (30), and a schematic is provided in Figure 1. The sample compartment of this instrument is large enough to hold the diffuse reflection optics and the sample holder environmental chamber. Potassium bromide windows were placed over apertures connecting the front and rear compartments to limit heat transfer from the diffuse reflection accessory (DRA) to the interferometer, which is particularly sensitive to temperature changes. A software macro program was used to measure sample temperatures that were later correlated with acquired spectra. A linear sample heating ramp and 10-mL/min helium purge were used for analysis. The sample was heated at 5 °C/min beginning from ambient temperature. IR spectra were measured at 1 min (5 °C) intervals. Reflectance spectra were computed by dividing successively acquired IR single-beam spectra by diluent (that is, silver powder) reference single-beam spectra measured over the same temperature range. VT-DRIFTS reflectance spectra were converted to the Kubelka-Munk format for display and subtractions (30). Reflectance spectra were baseline corrected before conversion to the Kubelka-Munk format by following previously described procedures (27).
Results and Discussion
When using DRIFTS for soil constituent analyses, spectral subtractions are commonly used to isolate selected IR spectral features from large bulk sample absorbances. This is typically accomplished by subtracting mineral reference spectra from spectra obtained for the same material, but also containing substances of interest. Often, pretreatment processes (such as extractions) are used to remove these substances from the reference samples. As pointed out by Thomas and Kelley (18), careful reference and adsorbate spectrum measurements are critical for obtaining accurate difference spectra. For this reason, they reportedly avoided studies with montmorillonites. Unlike many other minerals, montmorillonite structures consist of a sandwich of two inorganic sheets around a variable thickness water layer. To measure an appropriate reference spectrum, it is necessary to precisely control the water content, which is difficult to accomplish. Thus, depending on environmental conditions, samples may contain different amounts of water and IR spectra would therefore contain varying water absorbance contributions, which would be difficult to remove by using spectral subtractions.
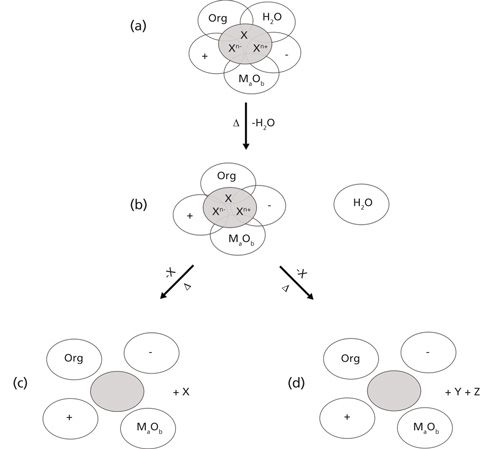
To avoid difference spectrum artifacts not associated with substances of interest, a sample perturbation analysis method can be used. This approach can be explained with the aid of the diagram shown in Figure 2. At the top of the diagram (Figure 2a), the species of interest is represented by X, which may also exist in charge carrying forms (Xn+ and Xn-), depending on its acid-base properties and local pH. Each form may interact differently with its surroundings, contributing different absorbance features to measured IR spectra. The overlapping ellipses in Figure 2 represent X interactions with other organic substances (Org), water (H2O), cations (+), anions (-), and inorganic oxides (MaOb) that may be present in the sample. The solid-state IR spectrum measured for the system denoted in Figure 2a will contain information regarding the vibrational modes of all constituents. After heating the sample represented by Figure 2a to remove water (that is, the perturbation), the resulting spectrum will represent a slightly different solid-state configuration (Figure 2b). A difference spectrum computed by subtracting the infrared spectrum obtained for Figure 2a from the spectrum measured for Figure 2b will contain spectral features representing the changes that occurred as a result of heating. Specifically, the difference spectrum will contain positive features representing vibrations formed after water removal (that is, related to new interactions) and negative features corresponding to vibrational modes that were lost because of the configuration change. The size of the spectral features in difference spectra will depend on the number of perturbed species and the absorptivities of the affected absorbance bands. Negative spectral features provide insight into the interactions between X and water in the initial configuration (Figure 2a). By continuing to heat the sample while measuring IR spectra, the difference spectrum representing Figure 2c - Figure 2b sample configuration changes would contain negative features corresponding to vibrational modes associated with the dehydrated X molecule and its environment that were lost when it desorbed from the sample and the Figure 2d - Figure 2b difference spectrum would provide similar vibrational mode information, but for instances when X decomposed rather than desorbed. Additional information regarding decomposition mechanisms may be obtained by determining the amounts and identities of decomposition products (Y and Z). Figure 2a potentially represents a very complicated system of simultaneous interactions. Soils typically contain numerous organic molecules, cations, anions, and inorganic oxides in differing amounts. Fortunately, the appropriate sample composition simplifications can be made to design experiments that target specific molecular interactions. For example, the VT-DRIFTS study described here is focused on characterizing specific interactions between benzoic acid adsorbates and montmorillonite clay.
DRIFTS measurements of neat calcium montmorillonite (CaMMT) exhibit artifacts caused by the Reststrahlen effect (31), resulting in a loss of spectral features over the affected wavelength range. Increased sample reflectance occurs near the intense 1050 cm-1 inorganic oxide absorption band because of a high sample refractive index, which results in an apparent loss of absorbance (that is, an increase in reflectance). As shown in Figure 3, this phenomenon results in a distorted reflectance spectrum when the neat clay is analyzed by DRIFTS. Fortunately, as illustrated by the dashed line spectrum in Figure 3, sample dilution can reduce the sample refractive index and eliminate this artifact. Thus, to avoid complications caused by Reststrahlen effects, the benzoic acid-CaMMT sample used for VT-DRIFTS studies was diluted in silver powder.
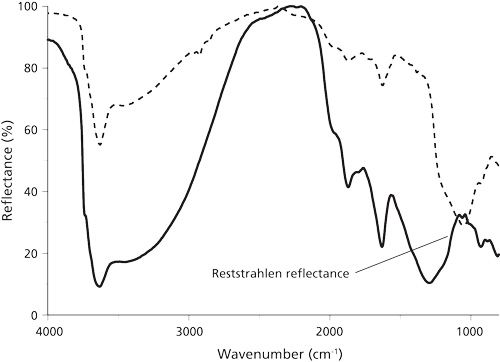
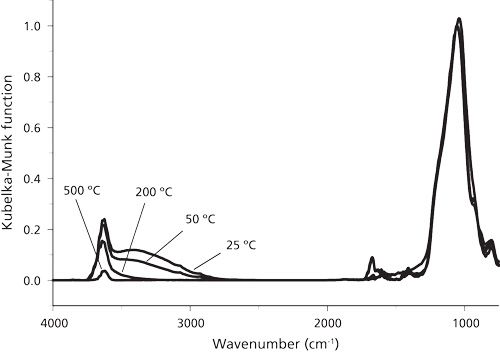
Figure 4 shows overlaid benzoic acid-CaMMT VT-DRIFTS spectra measured between 25 °C and 500 °C. The inorganic oxide absorbance at 1050 cm-1 is relatively constant as a function of temperature, but does exhibit an observable red shift in the spectrum measured at 500 °C. Smaller absorbances in the 1800-1400 cm-1 region are associated with benzoic acid adsorbate and interlayer water (that is, H-O-H bending). Above 2500 cm-1, spectral features represent -O-H stretching vibrations associated primarily with clay interlayer water molecules, but also benzoic acid and inorganic oxide hydroxyl groups. Thus, the VT-DRIFTS results depicted in Figure 4 contain temperature-dependent functional group vibrational mode information regarding the inorganic oxide, interlayer water, and benzoic acid adsorbate sample components.
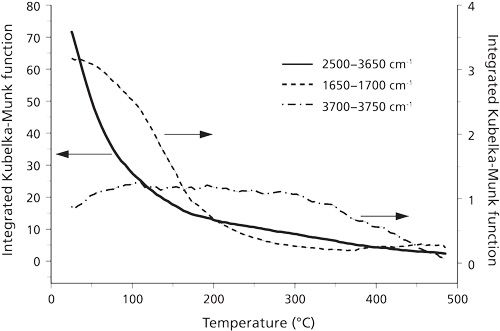
Heating the benzoic acid-CaMMT sample resulted in characteristic temperature-dependent functional group changes. These changes were profiled by plotting selected VT-DRIFTS spectral region integrated areas as a function of temperature. Three of these plots are shown in Figure 5. The 2500–3650 cm-1 integrated area plot represents the loss of hydrogen bonded hydroxyl groups as a function of sample temperature. The spectral intensity in this range is mainly representative of clay interlayer water content and the abrupt decrease upon heating denotes sample dehydration. The 1650–1700 cm-1 integrated area plot represents the loss of -C=O stretching vibration band intensity with increasing temperature. This plot primarily depicts benzoic acid desorption. The 3700–3750 cm-1 spectral region represents weakly hydrogen bonded inorganic oxide hydroxyl groups. Unlike the other profiles in Figure 5, the 3700–3750 cm-1 integrated area increases between 25 °C and 100 °C and then remains relatively constant until about 350 °C, at which point a gradual decline in integrated area is observed.
Although the temperature profiles in Figure 5 show general trends in sample composition variations that occur with heating, they do not provide detailed information regarding molecular environment changes. However, the information provided by these temperature profiles can be used to select VT-DRIFTS spectra for difference calculations, from which information regarding molecular environment changes can be obtained. For example, Figure 6 shows the difference spectrum obtained by subtracting the ambient temperature (25 °C) spectrum from the VT-DRIFTS spectrum obtained at 50 °C. A DRIFTS spectrum for a 5% (w/w) calcium montmorillonite-silver powder sample (CaMMT) is provided at the bottom of Figure 6 for reference. As expected, the difference spectrum contains negative features between 2800-3700 cm-1 and at 1630 cm-1 associated with loss of hydrogen bonded -O-H stretching vibrations and H-O-H bending vibrations respectively, which at these low temperatures are indicative of clay interlayer water loss. The positive band near 3750 cm-1 is associated with an increase in inorganic oxide hydroxyl group vibration frequency (that is, a blue shift) because of loss of hydrogen bonding with water molecules. Spectral features in the 1200–800 cm-1 range reflect changes in inorganic oxide vibrations caused by water loss. The negative band at 1690 cm-1 in the difference spectrum can be assigned to the benzoic acid -C=O stretching vibration. The presence of this band is surprising because it cannot be attributed to benzoic acid desorption, because that occurs at temperatures above 50 °C (32). Instead, this intensity decrease reflects a loss in -C=O stretching vibration band absorptivity caused by the loss of hydrogen bonding interactions between benzoic acid and clay interlayer water molecules.
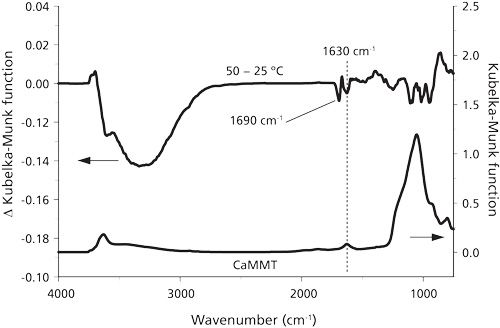
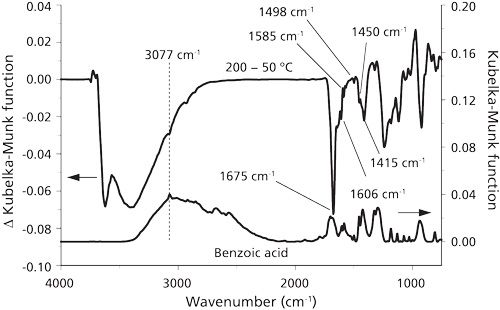
Figure 5 shows that loss of -C=O stretching vibration intensity occurs mainly over the 50–200 °C sample temperature range. Figure 7 contains the 200–50 °C VT-DRIFTS difference spectrum and an ambient temperature DRIFTS spectrum measured for a sample containing 5% (w/w) benzoic acid mixed with silver powder. The difference spectrum in Figure 7 contains features primarily associated with the loss of benzoic acid. Spectral features attributed to loss of hydrogen bonded hydroxyl groups and inorganic oxide vibration changes are also present in this difference spectrum. In addition to the clearly visible negative band associated with loss of the benzoic acid -C=O stretching vibration band, smaller negative peaks can be assigned to the benzoic acid aromatic ring (3077, 1606, and 1585 cm-1) and to the -C-O-H functional group (1498, 1450, and 1415 cm-1).
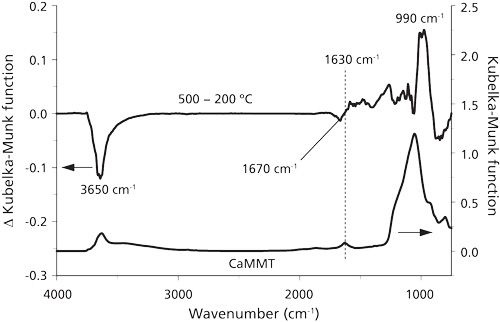
VT-DRIFTS spectral variations confirm that sample changes continued to occur above 200 °C (Figure 8). The dominant 500–200 °C difference spectrum features are associated with the loss of weakly hydrogen bonded -O-H stretching vibrations and inorganic oxide vibration band changes. The significant increase in intensity near 990 cm-1 likely results from the formation of metal-oxygen-metal inorganic oxide bridges resulting from high temperature dehydroxylation reactions.
Conclusions
The VT-DRIFTS sample perturbation method described here constitutes a sensitive thermal analysis technique capable of providing detailed functional group specific information regarding temperature-dependent sample composition changes. Modern FT-IR instruments provide sufficiently high scan-to-scan reproducibility to make sensitive VT-DRIFTS measurements possible, provided that temperature-dependent artifacts associated with the interferometer and detector are minimized. Interferometer temperature increase during sample heating can be minimized by physically isolating it from the instrument compartment that contains heated components. Temperature-dependent detector artifacts caused by unmodulated IR radiation emissions from hot samples can be reduced by computing reflectance spectra as the ratio between sample and reference single beam spectra measured at similar temperatures. Although this approach typically results in incomplete compensations, baseline correction techniques can be used to further reduce artifacts.
Taking into account dilution, the ~15 mg benzoic acid-CaMMT sample quantity used for the spectral measurements described here contained about 735 µg of clay and 15 µg of benzoic acid. Consequently, the relatively high signal-to-noise ratio for the 1650–1700 cm-1 integrated Kubelka-Munk function profile shown in Figure 5 suggests that VT-DRIFTS analysis can facilitate detection of adsorbate losses in the high nanogram range that occur between successive IR measurements (that is, 5 °C sample temperature intervals). This sensitivity may be improved by using slower heating ramp rates and increasing the number of signal averaged interferograms used to compute spectra.
The study of the temperature-dependent interactions between benzoic acid and montmorillonite clay described here illustrates the power of using VT-DRIFTS measurements for characterizing molecular environments. VT-DRIFTS spectra contained information regarding clay components (for example, water and inorganic oxides) and specific benzoic acid functional groups (such as
-C=O, -C-O-H, and C6H5 ring). However, interpretation of VT-DRIFTS analysis results can be difficult, because changes to all sample constituents are simultaneously detected. Overlapping positive and negative spectral features can occur, and intensity variations may be associated with changes in the number of absorbers, to changes in vibration band absorptivities, or both.
Comparing the negative -C=O stretching vibration bands in difference spectra shown in Figures 6–8 reveals that the frequency for this vibration band loss decreases with increasing temperature from 1690 cm-1 in the lowest temperature difference spectrum to 1670 cm-1 in the highest temperature difference spectrum. This 20 cm-1 red shift is indicative of increasing strengths of interactions between the benzoic acid -C=O functionality and its surroundings. This trend is reasonable because increasingly strong interactions require greater energies (that is, temperatures) to disrupt them.
By studying samples containing larger amounts of benzoic acid adsorbed on montmorillonite clays containing different interlayer cations, a more comprehensive VT-DRIFTS study in which multiple benzoic acid adsorption sites were characterized has been reported (24). Future VT-DRIFTS studies may include even more complicated solid state systems, such as soils containing multiple adsorbates. In fact, VT-DRIFTS may become a particularly important tool for studying the transport and fate of soil contaminants, because few other analysis methods provide comparable sensitivity and specificity.
References
(1) P.J. Brimmer and P.R. Griffiths, Appl. Spectrosc.42, 242–247 (1988).
(2) P.J. Brimmer and P.R. Griffiths, Appl. Spectrosc.41, 791–797 (1987).
(3) P.J. Brimmer, P.R. Griffiths, and N.J. Harrick, Appl. Spectrosc. 40, 258–265 (1986).
(4) D.J.J. Fraser and P.R. Griffiths, Appl. Spectrosc.44, 193–199 (1990).
(5) S.A. Yeboah, S.H. Wang, and P.R. Griffiths, Appl. Spectrosc. 259–264 (1984).
(6) D.J.J. Fraser, K.L. Norton, and P.R. Griffiths, Anal. Chem. 62, 308–310 (1990).
(7) L.J. Janik, S.T. Forrester, J.M. Soriano-Disla, J.K. Kirby, M.J. McLaughlin, and C. Reimann, Environ. Toxicol. Chem. 34, 224–234 (2015).
(8) L.M. Fultz, J. Moore-Kucera, F. Calderon, and V. Acosta-Martinez, Soil Sci. Soc. Am. J.78, 1940–1948 (2014).
(9) X.M. Yang, Geoderma 226, 415–417 (2014).
(10) J.B. Reeves, Geoderma189–190, 508–513 (2012).
(11) L. Lu, J. Cai, and R.L. Frost, Spectrosc. Lett. 43, 266–274 (2010).
(12) C.T. Jafvert, Assessing the Environmental Partitioning of Organic Acid Compounds (U.S. Environmental Protection Agency, Env. Res. Lab, Athens, Georgia, 1990).
(13) K.H. Inderjit and P.C. Bhowmik, Biol. Fertil. Soils 40, 345–348 (2004).
(14) B. Chefetz, S. Eldad, and T. Polubesova, Geoderma160, 608–613 (2011).
(15) S. Yariv, IR Spectroscopy and Thermo-IR Spectroscopy in the Study of the Fine Structure of Organo-Clay Complexes (Marcel Dekker, Inc., New York, 2002).
(16) S. Yariv, J.D. Russell and V.C. Farmer, Israel J. Chem. 4, 201–213 (1966).
(17) L. Lu, R.L. Frost, J. Cai, Y. Liu, and L. Zhang, J. Therm. Anal. Calorim.99, 377–384 (2010).
(18) J.E. Thomas and M.J. Kelley, J. Colloid Interf. Sci. 322, 516–526 (2008).
(19) L.G. Yan, J. Wang, H.Q. Yu, Q. Wei, B. Du, and X.Q. Shan, Appl. Clay Sci.37, 226–230 (2007).
(20) S. Yariv, J.D. Russell, and V.C. Farmer, Israel J. Chem. 4, 201–213 (1966).
(21) L. Lu, R.L. Frost, and J. Cai, J. Therm. Anal. Calorim. 99, 377–384 (2010).
(22) K.G. Bhattacharya and S.S. Gupta, Adv. Colloid Interfac. Sci.276, 181–210 (2008).
(23) T.M. Nickels, A.L. Ingram, D.K. Maraoulaite, and R.L. White, Appl. Spectrosc. 69, 850–856 (2015).
(24) T.M. Nickels, A.L. Ingram, D.K. Maraoulaite, and R.L. White, Appl. Spectrosc., in press (2015).
(25) R.L. White, Appl. Spectrosc. 46, 1508–1513 (1992).
(26) R.L. White, Anal. Chem.64, 2010-2013 (1992).
(27) R. Lin and R.L. White, Anal. Chem.66, 2976-2980 (1994).
(28) D.A. Stanley and B.J. Scheiner, Flocculation and Dewatering of Montmorillonite Modified by Ion Exchange - RI 9021 (U.S. Dept of Interior, Bureau of Mines, Avondale, Maryland, 1986).
(29) D.A. Stanley, S.W. Webb, and B.J. Scheiner, Rheology of Ion-Exchanged Montmorillonite Clays - RI 8895 (U.S. Dept. of Interior, Bureau of Mines, Avondale, Maryland, 1984).
(30) D.R. White and R.L. White, Appl. Spectrosc.62, 116–120 (2008).
(31) B. Hapke, Theory of Reflectance and Emittance Spectroscopy,2nd ed. (Cambridge University Press, 2012).
(32) T.M. Nickels, A.L. Ingram, D.K. Maraoulaite, and R.L. White, Thermochim. Acta614, 157–162 (2015).
Geographical Traceability of Millet by Mid-Infrared Spectroscopy and Feature Extraction
February 13th 2025The study developed an effective mid-infrared spectroscopic identification model, combining principal component analysis (PCA) and support vector machine (SVM), to accurately determine the geographical origin of five types of millet with a recognition accuracy of up to 99.2% for the training set and 98.3% for the prediction set.
Authenticity Identification of Panax notoginseng by Terahertz Spectroscopy Combined with LS-SVM
In this article, it is explored whether THz-TDS combined with LS-SVM can be used to effectively identify the authenticity of Panax notoginseng, a traditional Chinese medicine.