What Is in Your Water?
Special Issues
Specific purity requirements are set for water sources, whether we deal with waste, ground, surface, or drinking water. Water quality is key, and it is becoming a focal point for an increasing number of communities worldwide. Water quality determines the use of a body of water such as for manufacturing, farming, fishing, and human consumption. The reason to strive to maintain or improve a given body of water is to preserve or upgrade its quality, because once this quality degrades, so does its value.
Historically, the way we determine the use of a body of water is by measuring certain factors, such as physical, bacterial, and chemical parameters, radioactive content, as well as aesthetics. These days, researchers and regulating entities are turning their attention to the presence of organic compounds in water. Governmental regulatory agencies are starting to provide guidance as to the measurement of pesticides, herbicides, pharmaceuticals, and personal care compounds in water using modern techniques such as liquid chromatography–mass spectrometry (LC–MS). For example, the United States Environmental Protection Agency recently issued Method 1694, a procedure to determine pharmaceuticals and personal care products in water, soil, sediments, and biosolids (1). In addition, a widely published Associated Press report on detected levels of emerging contaminants such as hormones and antidepressants in metropolitan drinking water has heightened the public's interest in the topic of water contamination (2). In particular, the quality and ready supply of drinking water is of key interest not only in the United States, as shown in the report, but also in Asia, Europe, and Latin America, where measures are being taken to improve drinking water availability (3,4).
Due to the focused interest in the actual quality of water and the concern about the physiological effects of chronic chemical exposure, we are poised for a greater degree of water monitoring. With the number of samples that laboratories receive on the rise and a push for quick results, laboratories risk facing a significant burden on resource allocation and utilization.
For laboratories receiving thousands of water samples per year, turnaround times as well as the potential for operator error present a challenge for scientists and their managers. Consequently, laboratories are looking for ways to minimize the impact of increased workloads on manpower and budgets. As a result, laboratory personnel are scrutinizing and simplifying every step of the process. Depending on protocols, the process of collecting sample volumes of between 500 mL and 20 L in the field and shipping them to centralized laboratories where further reformatting takes place in combination with sample preparation is tedious and time inefficient. Analysts in water testing laboratories readily acknowledge that a significant portion of their day is devoted to sample preparation preceding the proper analysis of the water sample.
Given the current situation and an ever-expanding list of compounds for which to analyze, scientists are seeking higher levels of automation. The work discussed here illustrates the impact that an automated, parallel on-line sample preparation approach combined with LC–MS-MS can have on increased laboratory efficiency, faster turnaround times, and operator error reduction. We show examples in which herbicides, pesticides, and emerging contaminants have been detected at parts-per-trillion (ppt) levels with only 15 mL of water sample volumes. The work performed has been carried out on drinking water and river water sources.
Experimental
Chemicals and Reagents
All pesticides and over-the-counter drug standards were purchased from Sigma Aldrich (St. Louis, Missouri). Acetonitrile and methanol (both HPLC grade) were procured from J.T. Baker (Phillipsburg, New Jersey). Deionized water purified with a Milli-Q ultrapure water system from Millipore Corporation (Bedford, Massachusetts) was used. Acidic additive (formic acid 98.9%), basic additive (ammonium hydroxide 29.7%), and salt additive (ammonium formate) were purchased from Sigma. The Oasis HLB extraction column and XBridge C18 and phenyl columns were from Waters Corporation (Milford, Massachusetts).
Instrument and Equipment
The results presented here were obtained on an AquaAnalysis System from Waters Corporation. This MS-based system features a Quattro Micro triple-quadrupole mass spectrometer. This mass spectrometer was equipped with an electrospray ionization (ESI) interface and controlled by MassLynx version 4.1 MS software.
Online Solid Phase Enrichment and Chromatography
The conditions for the solid-phase extraction (SPE) and LC are listed in Table I. Briefly, the SPE protocol starts with loading 15 mL of sample onto the extraction column followed by a mild wash (5% methanol in water). The extraction column is then pulsed into the eluting circuit. The analytes are eluted toward the focusing column using a backflush gradient.
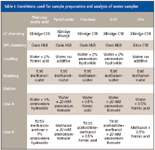
Table I: Conditions used for sample preparation and analysis of water samples
Results and Discussion
With an online SPE system, many steps can be automated. Some steps can be reduced or even totally eliminated from the extraction protocol. Tables II and III show the online SPE protocol used and times required for the analysis of painkiller and illicit drugs in drinking water.
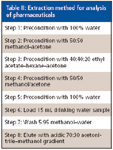
Table II: Extraction method for analysis of pharmaceuticals
The online SPE protocol shows equal robustness in comparison with the offline SPE protocols with the same selection of organic solvent (5,6). The added benefits are as follows: pre-SPE cleaning is automated; cleaning is performed in parallel for time saving; custom cleaning blends by software control increase efficiency; and solvent consumption is optimized. Because smaller sample volumes (<20 mL) are required, the loading times can be reduced drastically. Once the analytes of interests are trapped on the extraction column, they are eluted and refocused on the analytical column where the separation occurs. As seen in Table II, the drying, evaporation, and reconstitution steps were not needed in the online SPE protocol, reducing losses and minimizing operator error due to manual operation. As presented elsewhere, there is no need for large sample volumes as used traditionally because the mass transfer is comparable (7).

Table III: Time chart for the extraction method of pharmaceuticals
Herbicides, Pesticides, Pyrethroids, and Organophosphates in Drinking Water
We screened for herbicides, pesticides, pyrethroids, and organophosphates in a water source to determine the quality of the water.
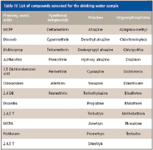
Table IV: List of compounds screened for the drinking water sample
As part of the work carried out for this investigation, we screened for phenoxyacetic acids, also known for their herbicidal properties and used in agricultural industry for strategic yield management of crops. The compounds screened in this water sample are listed in Table IV. Total ion chromatogram data are presented in Figure 1. As seen in this figure, of the 12 compounds screened in a single 15-min experiment that included sample preparation and analysis steps, dinoseb and perchloran were detected and determined to be at the 10-ppt level.
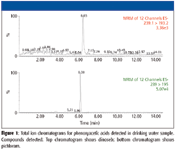
Figure 1
A total of 12 triazines, a class of pesticides used for insect management in agriculture, were screened for in this drinking water source also. The total ion chromatogram of the two pesticides that gave positive signals are shown in Figure 2. Both compounds, prometryn and terbytryn, were detected at the 10-ppt range.
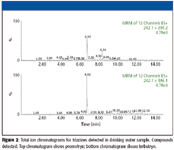
Figure 2
This drinking water sample was screened for seven pyrethroids, compounds also used as insecticides in agriculture. Three out of the seven compounds screened were detected in the sample analyzed, and their results are shown in Figure 3. As seen in this figure, resmethrin, tetramethrin, and allethrin were present, and the mass spectra showed that these chemicals were present at the 10–50 ppt level.
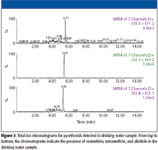
Figure 3
All 11 organophosphate compounds screened had negative results, indicating that this water source was free of these chemicals or at levels that were below the parts-per-trillion range.
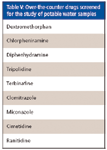
Table V: Over-the-counter drugs screened for the study of potable water samples
Over-the-Counter Drugs in Potable Water Samples
A total of 10 sources including town, private well, and bottled water were screened for over-the-counter drugs. We screened for compounds including clotrimazole (an antifungal product prescribed for athlete's foot) and chlorpheniramine (an antihistamine drug). The complete list of compounds examined is shown in Table V. The clotrimazole screening showed positive in one of the town water sources at the 20-ppt level, the results shown elsewhere (8). Chlorpheniramine results are shown in Figure 4. As seen in the figure, this antihistamine was present in two of the 10 water sources tested at the 2-ppt level. These results are relevant because the presence of pharmaceuticals and personal care products in water sources is becoming a concern for governmental entities, among researchers, and the public at large as the potential impact to humans, animals, and plants is still unclear. Further, this automated, online SPE–LC–MS-MS platform illustrated the fast turnaround times that provide meaningful data in less than 21 min.
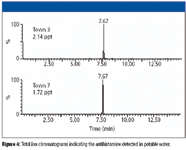
Figure 4
Screening River Water for Herbicides, Pesticides, Pyrethroids, and Organophosphates
Samples of river water were screened for the same compound classes as for the drinking water sample discussed earlier in this article. Of the 12 phenoxyacetic acids tested, four were present in this river source. The total ion chromatogram data for the detected herbicides are shown in Figure 5. As seen in the figure, 2,4,5 TP, dinoseb, MCPP, and MCPA were present in the river water. They were detected at the 10–50 ppt range. These results illustrate the utility of the water analysis system for the analysis of organics in water sources that present a more challenging matrix than drinking water. Any samples containing solids must be filtered before their injection in the system because, as expected, the presence of solids in the injected sample can clog the sample preparation cartridge over time.
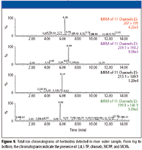
Figure 5
The work presented here demonstrates the impact that automation can offer laboratories screening for various organic traces in water sources, including herbicides, pesticides, and emerging contaminants. Both SPE columns and the focusing column can be reused significantly, as reported elsewhere (7). We have performed experiments that show the system performance is maintained allowing 500 runs per SPE column and 1000 runs per focusing column, reducing the cost of consumables against procedures carried out manually. For those concerned with carryover issues, the SPE columns are thoroughly cleaned between injections, such that carryover levels do not compromise analytical integrity.
Conclusions
The work presented here shows the utility of an automated, online SPE–LC–MS-MS method for the determination of various classes of compounds in several water sources, including drinking water and river sources. This approach can detect compounds such as herbicides, pesticides, insecticides, and over-the counter drugs at the ppt level. In fact, online sample preparation and LC–MS-MS reduces manual workload and reduces potential operator error because the steps are now performed automatically. Furthermore, this work shows that the savings begin at the point of collection, where the operator fills sample bottles that can be placed with minimal handling into the autosampler for sample preparation and analysis. Within 20 min or less, it is possible to screen classes of compounds at various pH and mobile phase conditions, permitting the detection of acidic, neutral, and basic compounds within the same system setup.
Claude Mallet is a Senior Chemical Analysis Applications Scientist, and Cecilia Mazza is Senior Market Development Manager with Waters Corporation, Milford, Massachusetts.
References
(1) www.epa.gov/waterscience/methods/method/files/1694.pdf
(2) www.usatoday.com/news/nation/2008-03-10-drugs-tap-water_N.htm
(4) www.who.int/water_sanitation_health/monitoring/jmp04_3.pdf
(5) D. Hummel, D. Loffler, G. Fink, and T.A. Ternes, Environ. Sci. Technol. 40, 7321–7328 (2006).
(6) B.J. Vanderford and S.A. Snyder, Environ. Sci. Technol. 40, 7312–7320 (2006).
(7) C.R. Mallet, ON-line SPE LC/MS/MS Part III: Waters AquaAnalysis System Performance, 720002451, Waters Corporation, 2008.

Trending on Spectroscopy: The Top Content of 2024
December 30th 2024In 2024, we launched multiple content series, covered major conferences, presented two awards, and continued our monthly Analytically Speaking episodes. Below, you'll find a selection of the most popular content from Spectroscopy over the past year.
Best of the Week: Hyperspectral Imaging, ICP-MS Analysis of Geological Samples, Product Roundup
October 18th 2024Top articles published this week include an article about hyperspectral imaging in human skin research, a peer-reviewed article about analyzing geological samples using atomic spectroscopy techniques, and an equipment roundup piece about the latest products in the industry.