Article
Spectroscopy
Spectroscopy
2005 Salary Survey: Careers, Compensation, and Contentment in Today's Spectroscopy Community
Spectroscopy's annual look at practiitioners' incomes and attitudes about their jobs finds that both have improved modestly in the face of challenging economic and employment conditions.
During a year that has been saturated with talk of the national economy, a fledgling job market, and an unpredictable unemployment rate, spectroscopists can take solace in the fact that according to the 2005 Spectroscopy Salary and Employment Survey, while their industry did not experience superlative growth during the previous 12 months, it did undergo a steady, albeit moderate, period of progress.
A total of 405 spectroscopists responded to this year's survey. As in past years, a majority of these were male — 298, or 73.6% — while females totaled 107, or 26.4%. A little more than a third of all respondents were between the ages of 40 and 55 — the largest age group.
While the most recent national unemployment rate (as of December 2004), according to the U.S. Labor Department, dipped to 5.2%, only 2.4% of those responding spectroscopists said they currently are not employed, compared with last year's 3.7%. Of those working, 90.7% are full-time employees, a slight increase from last year.
Salaries Hold Steady for Most
The average annual salary for all respondents is $72,920, a slight increase over last year's $72,140. This marked the lowest salary increase in the last five years, however, at just $780, and is far below the average increase of $1646 between 2001 and 2005 (see Table 1).

Table I. 2001-2005 average salaries
To coincide with the marginal across-the-board increase, the largest group of responders (8.7%) earn between $60,000 and $65,000. The largest single group in last year's survey, also 8.7% of the total respondents, earned between $75,000 and $80,000.
This year, 4.5% of respondents report they earn less than $25,000 per year — more than double the 2.1% in this category from 2004. On the other hand, 3% are earning more than $150,000 per year, a marginal increase from last year's 2.1%.
Industrial sector continues to strive, academia falters. Industrial spectroscopists continue to be the highest paid group at an average salary of $78,170, up slightly from last year's mark of $77,420. While the one-year increase of $750 is modest, at best, industrial spectroscopists have seen their yearly average salaries climb $6400 in just two years ($71,770 in 2003).
While their industrial counterparts have enjoyed escalating pay, academic spectroscopists continue to see their yearly salaries dwindle at a rapid pace. This year academic scientists, on average, will earn $54,640, a significant decrease from 2004's $59,850 average, and a far cry from the $62,130 they averaged just two years ago.
"Academia typically pays less than industry, and that's always been the case. However, many academic salaries are 9- or 10-month salaries, based on the idea that many academics get the summer off," says David Ball, a professor of Chemistry at Cleveland State University, and a member of Spectroscopy's Editorial Advisory Board. "Many academics have the opportunity to supplement their salaries with external grants or summer school teaching. When that additional salary is taken into account, in many cases, a full-year salary can be commensurate with an industrial salary. Academics also can consult, while industry frowns upon or forbids moonlighting, or can serve as expert witnesses or write textbooks for royalties. An academic scientist has other opportunities to earn income than many industrial workers do."
Government spectroscopists rebound after a modest decline in their 2003-2004 average salaries, $68,430 and $66,610, respectively, and will earn an average of $68,700 in 2005 (see Figure 1).
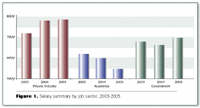
Figure 1. Salary summary by job sector, 2003-2005.
Coastal salaries climb. As it has been in the past, spectroscopists on the country's bookends continue to enjoy the highest financial satisfaction.
The Pacific/Pacific Northwest is once again the highest paying region. On average, those working on the West Coast earn $81,590 a year. This marks a $2920 increase from last year's data, and more importantly, a $9140 increase in just two years.
The Northeast/Middle Atlantic region also continues to be a prosperous area to work. At an average of $76,830, scientists in this region have enjoyed a $5450 increase in two years. The Midwest/Great Lakes region is once again the third-highest paying region with an average yearly salary of $72,540 — up from last year's $71,480.
After experiencing a sudden spike in its average salary from 2003 to 2004 ($65,000 to $69,790) the Southern/South Atlantic region of the country declined to $68,940. On the other hand, the Western-Central region's freefall continued with an average 2005 salary of $64,590. Last year, the region's spectroscopists averaged $66,760, and in 2003, they averaged $68,240 — a $3650 decline in two years (see Figure 2).

Figure 2. Salary summary by geographic location, 2003-2005.
"Cost of living is a major factor," Ball says. "[My family and I] moved to Cleveland from the San Francisco Bay Area. I had a 12-month job offer from Henckel in Sonoma County and an academic position here in Cleveland. My annualized salary from the academic position was about the same as the industrial position, and given the cost of living in the Midwest, the money went much farther. It was a no-brainer what decision to make."
Higher education equals higher pay. As can be expected, those with Ph.D.s (42.2% of all respondents) earn the most at an average of $85,400 per year, up from last year's $83,690 average and 2003's $81,900. M.S. holders (19.9%) also experienced a two-year increase. This year those with a Master's will earn an average of $71,450, a $1770 increase from last year and a $4170 jump from 2003. While B.S. holders enjoyed an unexpected hike in 2004 ($62,130 from 2003's $58,410 average), they saw a disappointing return to an average of $59,030 for this year's survey — a $3100 decrease.
Males hold top spot, but women make greater strides. No matter which way you examine the numbers, males are consistently ahead of females when it concerns salary.
According to the survey, a male spectroscopist will earn an average of $75,640 in 2005. This total represents more than $10,000 of what a female spectroscopist will earn, $65,450. While troubling, a closer look at the numbers shows that females closed a significant part of that gap that has separated the genders in the past.
From 2003 to 2004, the pay for a male spectroscopist increased by $2660, from $72,690 to $75,350. From 2004 to this year, however, the increase was a miniscule $290.
On the other hand, a female spectroscopist saw a decrease in her 2003-2004 salary by $220 — $58,900 to $58,680. 2005's figure ($65,450) represents a $6770 increase (see Figure 3).
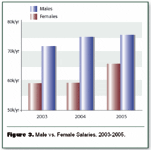
Figure 3. Male vs. Female Salaries, 2003-2005.
"I think employers have been made very aware of the need to avoid discrimination based upon gender, and that may account for the higher annual increase," says Eileen Skelly Frame, of Full Spectrum Analytical Consultants, and a member of Spectroscopy's Editorial Advisory Board. "Employers are either readjusting salaries to be 'equitable' or are promoting more women to higher paying management positions to avoid lawsuits."
Two factors that always have favored males are time on the job and degree held. And while males still hold a significant edge in these departments, this year's female respondents have made substantial gains, hence the reason for their sudden salary surge.
A little more than 46% of males hold a Ph.D. — the same as last year's numbers. In 2004, male respondents had an average of 21.75 years of experience. This year, however, that number dipped to 18.66 years.

Methodology
This year, 30.8% of female spectroscopists hold a Ph.D. Whether it's the random selection process of the survey, or a trend of females returning to school, this represents a 10% jump over last year's numbers. Also increasing was years of experience for the female respondents — 14.43 in 2003 to this year's average of 15.46.
"There are still fewer high paid female managers than male managers in industry. There are also many more female B.S. level, or lower, scientists/technicians in spectroscopy labs than male B.S. scientists, in my experience, " Frame says. "I have had labs with all females reporting to me, labs with from 2:1 to 4:1 female/male ratios, and in most of these cases, the males had M.S. or Ph.D. degrees, while the females had high school diplomas or B.S. degrees. There is no question that M.S. and Ph.D. degrees equate to higher salaries in industry.
"The increase in female Ph.D.s is going to increase the competition for jobs. It will certainly increase the pressure on older, more experienced job-seekers to keep updating their skills as employers try to hold down costs by hiring recent graduates," Frame continues. "For the industry, it means that employers must address the issues of family leave, on-site daycare, flexible working hours, etc. Some employers are ahead of the curve with respect to these issues."
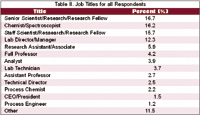
Table II. Job Titles for all Respondents
Satisfaction Levels
Money might make the world go around, but can it make you happy? According to our survey, yes, there is a direct correlation between money and job satisfaction.
On whole, 24% of all respondents are "very satisfied" with their professional choices; 46% are "satisfied;" 23.5% are "somewhat satisfied;" and 6.4% (5.4% of males, 8.6% of females) are "dissatisfied."
Not surprisingly, those in the Pacific/Pacific Northwest, who make the most on average, reported the lowest dissatisfaction level, just 2.3%. A little more than 11% of government spectroscopists are dissatisfied, followed by an 8.2% rate from those in academia.
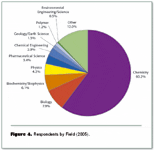
Figure 4. Respondents by Field (2005).
To give a more direct link between satisfaction and salary, those who are either very satisfied or satisfied earn an average of $75,740 a year, or $2820 more than the average salary respondent. Those somewhat satisfied are making an average of $65,450 — $7470 less than an average respondent — and just $750 more than the dissatisfied portion of respondents.
"Does money equal happiness? No, but it's a contributing factor, just as in any other job," Ball says. "I have had local working environments that have severely eroded my professional morale despite the fact that my salary was untouched by the circumstances. On the other hand, many times I feel like I have the best job in the world despite the fact that I'm underpaid relative to other scientists."
Supplemental income plays a part. Less than half (45%) of this year's respondents are eligible for supplemental income. As expected, those in the Pacific/Pacific Northwest region were the most eligible group at 54.5%, and nearly half of those who were most satisfied with their jobs were collecting bonus income as well. The dissatisfied population is the least eligible.
The average yearly amount of supplemental income was $6,790, with the highest percent of respondents (15.6%) reporting they earn up to or more than $15,000 a year in supplemental income. The highest percentage of eligible male respondents (17.5%) fall into that category, while the highest percentage of female respondents (15%) fall into one of two categories: less than $1000 per year or $1000-$1999 per year.
On average, males earn $7230 in supplemental income per year, and females earn $5350. Ph.D. holders, while the lowest percent of eligible respondents, earn the most at an average of $8880 per year. B.S. holders earn almost half of that at $4640. Academia earned the highest average of supplemental income at $7210, slightly ahead of private industry's $7,030 average. Government respondents' average is nearly three times lower, at $2360.
Career Assessment and Change
A little less than one-third of all respondents (31.6%) are considering a job change within the next year. The highest percent among degree holders was Ph.D.s at 34.7%. Females are slightly more likely to make a job change than males (34.3% compared to 30.5% of males). Those in academia responded "yes" the most at 37.7%. Government workers had the highest "no" percentage at 71.7%. Those dissatisfied and with less than 10 years experience also are the most likely to look for changes in the next year.
For those looking for a change, the biggest factors are income (53.1%) and professional advancement (50%). While already enjoying the highest average salary, those in the Pacific/Pacific Northwest are, by percentage, now looking for advancement above all other factors (66.7%). 61.1% of the Northeast/Middle Atlantic congregation is seeking income above all else, 8% above the average.
Ph.D. and B.S. holders are seeking a change of income, while 81% M.S. holders will seek advancement. Males and females equally cite income as a factor, but females are seeking advancement by a little more than 8%. Males, on the other hand, see company downsizing as a reason for change by a 2-to-1 ratio (16.7% to 8.3%).
Nearly 74% of academic spectroscopists cite income as a factor in seeking change, while 53.8% of those in government report that their job environment is the cause. Spectroscopists with less than 10 years and 10-20 years of experience are seeking income and advancement above all other factors, while those with 21-30 years seek advancement (44.4%) over income and job environment (40.7%). More than 30 years in the industry puts a desire for more money and intellectual challenge on the same level (54.5%).
On average those with less than 10 years experience earn $55,490 (up from $49,000 in 2004); those with from 10 to 20 years on the job pull in $80,040, or more than $10,000 from last year's average; from 20 to 30 years equals $83,700 a year ($79,710 a year ago); and finally, those with more than three decades under their belt, who made the most on average last year ($82,910), suddenly fell to an average of $75,640. Just three years ago, this group averaged $86,290 a year.
So where is everyone headed? A large majority (76.4%) of all respondents who intend to seek a job change would prefer to work in private industry. Nearly 83% of those in the private sector intend to stand pat, while 70% of government employees are seeking entrance into private industry. Academics, on the other hand, are split between preferring to stay in their current field and switching into private industry.
Comparison with other disciplines. So what do all these numbers mean? To better understand where spectroscopists stand with regard to the broader scientific community one can refer to the August 2004 salary survey of members of the American Chemical Society (ACS), which appeared in Chemical and Engineering News.
The ACS survey was based on 11,600 responses. Close to 10,700 of those respondents were chemists; 427 were chemical engineers; and 400 held nonchemical degrees. 500 respondents were disqualified as they were retired or not seeking employment, for a total of 10,200 qualified respondents. Job fields of the ACS respondents included analytical chemistry, biotechnology, pharmaceutical chemistry, and materials science.
While full-time employment rates are nearly identical, the median salary for ACS respondents was $82,000, compared to the $72,920 average for 2005 Spectroscopy respondents. The salary gap between genders was more exaggerated in the ACS data. The median salary for males was $86,000, and for females it was $67,000 — a $19,000 a year difference, or $9000 more than the gap between Spectroscopy respondents' average salaries.
One reason for the large disparity can be found in education. As it was in the Spectroscopy survey, more than 79% of Ph.D. holders in the ACS survey were male.
ACS members with bachelor's degrees have a median salary of $62,000, $3000 more than the average salary of the B.S. spectroscopists. Master's degree holders from both surveys earn a very similar amount; however, the median salary for ACS members with Ph.D.s was $91,600 while the average salary for Spectroscopy respondents was $85,400.
A private industry chemist earns the most, a median of $88,000 a year — almost $10,000 a year more than the private industry spectroscopist. ACS members working in academia earn the least with a median of $62,000, still more than $7000 than those spectroscopists in academia. The largest disparity between similar groups concerns those working in government. A government employee who responded to the ACS survey has a median yearly salary of $85,000 — $16,300 more than the $68,700 average salary of those government spectroscopists who responded.
Sixty-seven percent of industrial chemists were eligible for a bonus at a median of $6500, compared to 58% of private industry spectroscopists with a mean of $7030. Government chemists were 43% eligible at a median of $1500. On the other hand, just 15.2% of government spectroscopists were eligible at a mean of $2360. Only 5% of academic chemists were eligible at a median of $2000, and 11.1% of academic spectroscopists at a mean of $7210 were eligible. Overall, 50% of chemists are eligible and have a median pay of $6000, while 45% of spectroscopists are eligible with a $6790 a year average.
Life scientists. Another marker of where spectroscopists stand is the 2004 American Association for the Advancement of Science (AAAS) salary survey of U.S.-based life scientists, which is covered in a June 2004 issue of Science magazine. Comprised of 6124 valid surveys from AAAS members, it shows some similarities and differences from this year's Spectroscopy survey.
The median salary for AAAS academic life scientists is $76,000, $14,000 more than the median academia salary found in the ACS survey, and some $22,000 above the average academic's salary among Spectroscopy respondents. For nonacademics, the median salary is close to $88,000 — with industrial salaries at $90,000.
The difference between genders is once again on display in the AAAS data. The median yearly salary for a male AAAS member in academia is $83,000, and for females the number pales at just $67,000 — a $16,000 differential. In nonacademic settings, the difference grew even more with males earning a median of $98,000 and women $78,000.
"While money is certainly necessary, of course it doesn't equal happiness in one's career," says Frame. "The work environment — location, the attitudes of management and peers/coworkers, having the appropriate facilities to do one's job well, and not least, an intellectually stimulating job — are much more critical to happiness in one's career than money."
The data presented in this article is, of course, just a small sampling of the spectroscopy community as a whole. If you would like to share your thoughts on this article and its data, and how it relates to your career, please e-mail us at: spectroscopyedit@advanstar.com.
Newsletter
Get essential updates on the latest spectroscopy technologies, regulatory standards, and best practices—subscribe today to Spectroscopy.


