Advantages of High-Brightness Lasers in Confocal Raman Spectroscopy
The theoretical and experimental differences between high-brightness and low-brightness lasers used in a dispersive confocal Raman microscope system are compared.

Confocal Raman microscopy makes it possible to sample a precisely defined area at the focus of an instrument while excluding signals from the surrounding area. This is achieved by placing an aperture at a secondary focus in the optical path between the sample and the detector. One can think of this as projecting the confocal aperture onto the sample plane. Only Raman signals originating within this projected aperture can pass through the confocal aperture; all out-of-focus Raman signals are rejected.
Ideally, the Raman excitation laser is focused on the same confocal area in the sample plane. Under these conditions, the laser creates the maximum Raman scattering exactly in the desired sampling location.
Not all lasers, however, produce the best results for confocal scattering. At high magnification, such as with a 50× or 100× microscope objective, the diameter of a confocal aperture projected on the sample is on the order of 1 μm. To focus a laser into such a small spot size, the laser must be what is termed high-brightness. The brightness in this context refers to the laser beam quality — its ability to achieve a high power density by focusing all of its energy into the smallest possible spot size.
Diode lasers can also be "low brightness" because of their design parameters. Such lasers cannot be focused to a small spot size regardless of the optics used. The result is that areas of the sample outside of the confocal aperture are illuminated by the laser. Spatial resolution may be reduced, but the immediate effect is much lower Raman signal strength than might otherwise be expected. High-brightness lasers are readily available with output power levels of 30–80 mW. Low-brightness lasers have much higher power levels, from 250 mW to several watts. However, at high magnifications and with small confocal apertures, high-brightness lasers can produce equal or higher signal-to-noise ratios (S/N). This improved S/N can make the difference between success or failure in energy-starved applications such as Raman microscopy where every photon of Raman signal counts.
Theory
The focusing quality of a laser beam is characterized by its diameter and divergence. These parameters are often combined in a laser beam figure of merit known as the M2 factor.
Beam diameter, also known as beam waist, is the minimum diameter of a laser beam along its axis of propagation. The beam waist is sometimes reported as the beam waist radius, which is half the beam diameter.
Beam divergence is a measure of how much the laser beam diameter spreads along its propagation axis. It is usually reported as a half-angle in mrad (where mrad is milliradians).
M2 factor is the product of beam diameter times divergence relative to that of an ideal Gaussian (TEM00) beam. For this reason, this factor can be thought of as "times diffraction limit" of the laser beam. A laser beam that is diffraction-limited has ideal beam quality and can be focused into the smallest possible spot size. This ideal beam quality is designated by an M2 value of 1.0. For example, a laser with an M2 of 2 can only focus to a spot diameter that is twice the theoretical minimum.
The best lasers for focusing to a small spot size will have an M2 value close to 1.0.
Beam diameter, D, and divergence, θ, are locked in an inverse relationship, as shown in equation 1 (1,2):

where θ is the beam divergence full-angle (in milliradians), λ is the laser wavelength (in nanometers), and D is the beam waist diameter (in millimeters). The factor of 4 in the numerator is due to the use of full angle (2× half-angle) and diameter (2× radius) in this equation. You may see this equation in some texts simplified for an ideal Gaussian beam (M2 = 1) as in equation 2 (3):

Equations 1 and 2 show that you can decrease either the beam divergence or the beam diameter, but you cannot decrease both at the same time. This is the fundamental key to understanding laser brightness.
The other key to achieving high brightness is the transverse electromagnetic mode structure, or TEM, of a laser beam. In an ideal laser, the beam energy distribution across the beam is a Gaussian function. This is called a TEM00 mode structure. A laser may have multiple transverse modes with nodes in between. These multimode lasers have designations such as TEM10, TEM11, and so forth and have poor spatial coherence. Examples of these additional modes can be seen in Figure 1 or in other sources (5). Only a TEM00 can be focused to the smallest possible spot size and achieve the highest power density (2,4).
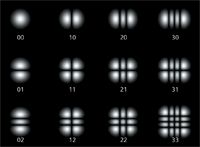
Figure 1: Transverse laser beam mode patterns.
Power density, milliwatts per unit area, is the key factor for achieving good signal strength in a Raman microscope system. We can directly set or measure the laser power (milliwatts). To calculate the area term, we need to calculate the beam diameter, d, at the focus of a microscope objective. This is given by equation 3:

where f is the focal length and D is the diameter of the beam entering the objective. This is shown in Figure 2.

Figure 2: Focusing of a Gaussian laser beam by a lens (DXR Raman microscope, Thermo Fisher Scientific).
It may not be obvious whether a laser in a Raman microscope system is high or low brightness. This can be determined from specifications provided by the laser manufacturer: TEM, beam divergence, beam size, and M2 factor. For example, a high-power 780-nm laser might have a beam size of 5 × 5 mm and a beam divergence of <5 mrad. The M2 factor can be calculated by rearranging equation 1 to solve for M2, as shown in equation 4:

Using the numbers given, we can see the product of beam diameter times beam divergence, Dθ, would be 25 times diffraction limited.
Equation 3 gives us the spot size for this low-brightness laser. A 100× microscope objective having a focal length f = 1.6 mm will produce a spot diameter of d = 4λM2f/πd or 8 μm.
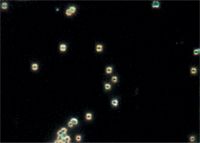
Figure 3: Image of 1-μm polystyrene spheres taken with a 100Ãmicroscope objective.
Following the same approach for a high-brightness 780-nm laser with an M2 of 1.1 and a beam diameter of 1.0 mm gives a spot size of 1.7 μm.
Table I compares the power densities achievable with the high- and low-brightness lasers used for this example. Note that the lower-power laser produces nearly 3.5× the power density at the sample compared to the high-powered laser because it is high brightness.

Table I: Expected power densities for two types of 780-nm lasers: a 150-mW low-brightness laser and a 24-mW high-brightness laser
Experimental
A 1-μm diameter polystyrene bead was used as a test sample to demonstrate the performance difference between low- and high-brightness lasers. The instrument used was the Thermo Scientific DXR Raman microscope equipped with a 780-nm, 150-mW low-brightness laser and a 780-nm, 24-mW high-brightness laser.
The polystyrene beads were placed on a calcium fluoride substrate to reduce any background fluorescence.
Spectral maps were acquired of a region surrounding an isolated polystyrene sphere using both lasers on the same Raman microscope system. A 100× objective and a 25-μm aperture were used for both maps. The performance was optimized in each case by focusing for maximum Raman signal before beginning the measurement.
Each map is a 3.0 μm × 3.0 μm area around the same isolated polystyrene bead. Data collection parameters for both maps were the same: step size, 200 nm for both x and y axes; microscope objective, 100× (0.96 N.A.); spectrograph aperture, 25 μm; length of acquisition per pixel, 5 s; number of acquisitions per pixel, 2. Both lasers were set to their maximum power output: 150 mW for the low-brightness laser and 24 mW for the high-brightness laser.
Results and Discussion
Figure 4 shows spectral maps acquired with each laser.
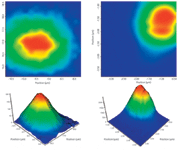
Figure 4: Spectral maps of a 1-μm polystyrene sphere with two different lasers. (Left) Map acquired with a 150-mW low-brightness laser. (Right) Map acquired with a 24-mW high-brightness laser.
The maps both show nearly the same size for the polystyrene sphere, which is because of the limitation imposed by the small confocal aperture. When using a 100× microscope objective, the conjugate of the confocal aperture in the sample plane of the microscope objective is 1 μm diameter. Keep in mind that this is the area the spectrograph is seeing, which is smaller than the laser spot size discussed in the "theory" section above. Higher signal may be obtained with the low-brightness laser by using a larger spectrograph aperture, but the system would no longer have a tight confocal aperture, resulting in a loss of spatial resolution.
Theory predicts we will observe strongly different peak signals from the two lasers, with higher peak signal from the laser with lower power but high brightness. This prediction is well met by the experimental data. If you look at the vertical intensity axis in the 3D plots in Figure 4, you will notice the Raman signal strength for the high-brightness map is much lower.
Figure 5 compares spectra taken from the peak in each map on the same Raman intensity axis. The high-brightness laser produces approximately 10 times more signal than the low-brightness laser even though the power output is only 24 mW compared to 150 mW.
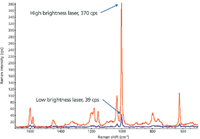
Figure 5: Peak height comparison for central spectra taken from maps shown in Figure 4.
Conclusion
Higher-power lasers that do not have high brightness (low M2 ) do not have an advantage for signal strength and may sacrifice spatial resolution when used with a small confocal aperture in Raman spectroscopy. Low-power, high-brightness lasers produce significantly higher signal strength compared to high-power, low-brightness lasers in this application.
Similar spatial resolution was seen with the two lasers in the case of an isolated polystyrene sphere on a nonfluorescing background. It is important to note that the majority of the laser power for the high-power, low-brightness laser is wasted. Not only does it not contribute to Raman signal within the confocal aperture in the sampling plane, it may produce spurious signals by scattering from the surrounding area (fluorescence or Raman signal from different compounds). In addition, the excess laser power will certainly contribute to sample heating in the area surrounding the region of interest.
Acknowledgments
Thanks to colleagues at Thermo Fisher Scientific: Kelly Cox who carried out the original work for this paper, Francis Deck who provided assistance with the optical parameters, and Ali Mirabedini who measured laser quality parameters.
Dick Wieboldt, PhD, is a principal scientist in the product development group at Thermo Fisher Scientific, located in Madison, Wisconsin. He is currently involved in exploring the use of Raman and FT-IR in areas such as energy, food safety, biochemistry, and material science. Please direct correspondence about this installment to: dick.wieboldt@thermofisher.com
References
(1) A.E. Siegman, Lasers (University Science Books, Sausalito, California, 1986).
(2) J.R. Meyer-Arendt, Introduction to Classical and Modern Optics, Second Edition (Prentice-Hall, Inc., Englewood Cliffs, New Jersey, 1984).
(3) E. Hecht, Optics, Third Edition (Addison Wesley Longman, Inc., New York, New York, 1998).
(4) R. Paschotta, Encyclopedia of Laser Physics and Technology (RP Photonics Consulting GmbH, http://www.rp-photonics.com/encyclopedia.html).
(5) http://en.wikipedia.org/wiki/File:–Hermite-gaussian.png/
