An Observation of Methanol in Ethanol Using Automated ATR Spectroscopy
Mixtures of methanol in ethanol were investigated using an automated ATR accessory. The spectral bands of methanol and ethanol were evaluated showing the expected absorbance changes.
Mixtures of methanol in ethanol were investigated using an automated ATR accessory. The spectral bands of methanol and ethanol were evaluated showing the expected absorbance changes.
Quantitation of contaminants and toxins within human-consumable products is a critically important aspect of ensuring consumer safety. Methanol contamination of consumable alcoholic beverages is particularly concerning due to the acute toxicity of methanol, with 4 mL of ingested methanol leading to irreversible vision loss and 30 mL of methanol potentially resulting in death (1). Recently, headlines discussing deaths and injuries linked to methanol contamination of commercially available liquors at popular resorts have emphasized the importance of methanol screening and quantitation methodologies.
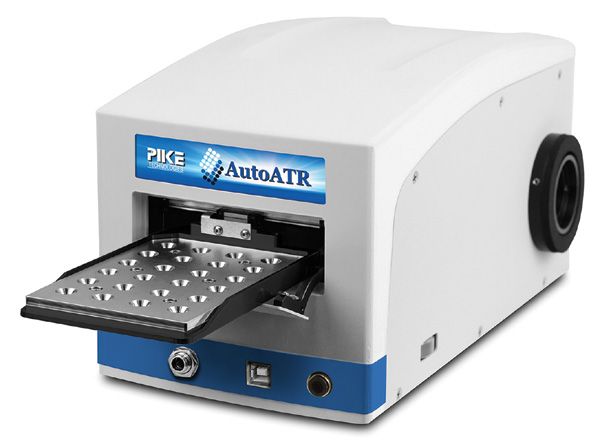
Here, we use PIKE Technologies' automated ATR accessory, the AutoATR, to observe the spectral changes over various concentrations of methanol in ethanol (Figure 1). The AutoATR uses 24 unique Si ATR elements, which have a thickness of 500 microns. The thin profile of the ATR crystal minimizes absorption of the IR source by the Si phonon bands which, in combination with the accessory's base optics, results in high energy throughput and reproducibility.

Figure 1: PIKE AutoATR automated ATR accessory.
Sampling automation is made possible by the AutoPRO7 software package. AutoPRO7 streamlines the collection of all background and sample spectra, reducing the required user involvement to the distribution of samples after the background spectra acquisition has completed.
Experimental Details
A series of five concentrations of methanol in ethanol were investigated, including 0, 10, 20, 30, and 40% v/v methanol in ethanol. Each mixture was created using an Eppendorf micropipette and high-purity methanol and ethanol. After each mixture was created, a clean micropipette tip was used to distribute 120 μL of each solution into the AutoATR well plates after the background spectra acquisition was completed.
Results
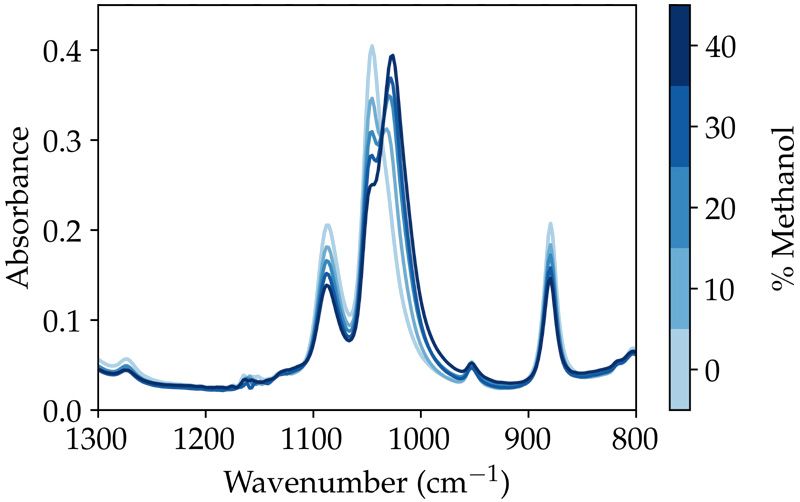
The ATR spectrum of each methanol/ethanol sample is shown in Figure 2. The dominant spectral bands of ethanol correspond to the 1087 and 1046 cm-1, while methanol exhibits a characteristic spectral band at 1033 cm-1. The complementary change in concentration of the two species is highlighted by the isosbestic point at 1036 cm-1 of the ATR spectra.

Figure 2: ATR spectra of each % v/v methanol in ethanol, collected with the AutoATR.
Conclusions
Quantitation of contaminants and toxins such as methanol is critically important to ensuring the well-being of consumers. In order to streamline these measurements, automated technologies such as the AutoATR provide a uniquely accurate and high-throughput approach to ATR-based chemical identification. The AutoATR has proven capable of spectrally distinguishing methanol from ethanol and is well-suited for quantifying individual species in mixed solutions.
References
(1) A. Dasgupta and A. Wahed, Clinical Chemistry, Immunology and Laboratory Quality Control (Elsevier, San Diego, California, 2014), pp. 317–335.

PIKE Technologies, Inc.
6125 Cottonwood Drive, Madison, WI 53719
tel. (608) 274-2721, fax (608) 274-0103
Website: www.piketech.com

New Study Reveals Insights into Phenol’s Behavior in Ice
April 16th 2025A new study published in Spectrochimica Acta Part A by Dominik Heger and colleagues at Masaryk University reveals that phenol's photophysical properties change significantly when frozen, potentially enabling its breakdown by sunlight in icy environments.
Advanced Raman Spectroscopy Method Boosts Precision in Drug Component Detection
April 7th 2025Researchers in China have developed a rapid, non-destructive Raman spectroscopy method that accurately detects active components in complex drug formulations by combining advanced algorithms to eliminate noise and fluorescence interference.