Anatomy of an Ion's Fragmentation After Electron Ionization, Part II
Special Issues
The authors continue their discussion of the role of the analysis of fragment ions in the interpretation of an analyte's mass spectrum.
Determining an organic compound's structure from its mass spectrum is challenging. If, as in the case of soft ionization — chemical ionization (CI), atmospheric pressure chemical ionization (APCI), field ionization (FI), electrospray (ES), atmospheric pressure photoionization (APPI), or fast atom bombardment (FAB) — the mass spectrum only provides the mass of the intact molecule, the challenge can be even greater. At best, an elemental composition can be determined if the measured mass is sufficiently accurate; however, many of these elemental compositions represent large numbers of compounds. There are 127 compounds in the NIST08 Mass Spectral Database that have the elemental composition C10H20O. Without an accurate mass measurement, the challenge is even more overwhelming. The elemental composition C10H20O has a nominal mass of 156 Da. The NIST08 Mass Spectral Database has 684 compounds with this nominal mass. To get past this point of an elemental composition, fragmentation of the ion representing the intact analyte nolecule is eeded. Approaches to the interpretation of even the most information-rich spectra — considered by most to be spectra produced by electron ionization (EI) — usually begin with the explanation of fragment ions formed by the unimolecular decomposition of the ion representing the intact molecule (the molecular ion [M+.] in the case of EI).
Examination of the spectral difference between 8-methyl-4-nonanone and 4-decanone (Figure 26) shows that the relative intensity of the peak at m/z 69 is much greater in the spectrum of 8-methyl-4-nonanone than it is in the spectrum of 4-decanone. This could lead to the conclusion that the same type of mechanism involved in the water loss from the acylium ion (through the formation of a secondary radical in the case of 4-decanone and a tertiary radical in the case of 8-methyl-4-nonanone) might be involved. Two possible mechanisms resulting in the expulsion of vinyl alcohol are shown in Figure 28. Both of these mechanisms are consistent with the increased abundance of the peak at m/z 69 in the mass spectrum of 8-methyl-4-nonanone compared with the spectrum of 4-decanone based on the formation of a tertiary intermediate.
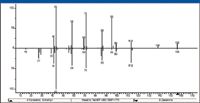
Figure 26: Head-to-tail comparison of the EI mass spectra of 4-decanone (down) and 8-methyl-4-nonanone (up).
This precursor-ion analysis showed that the ion with m/z 87 was also a precursor of the ion with m/z 69. The ion with m/z 87 (mentioned earlier, but whose origin has yet to be explained) could lose water to form the ion with m/z 69. In the EI mass spectrum of 4-decanone, the intensity of the peak representing the ion with m/z 87 is 16% of the intensity of the peak at m/z 86, which is far too great to be an X+1 isotope peak of the m/z 86 peak. At most, the peak at m/z 86 would represent an ion that has six atoms of carbon; however, it has been established that this odd electron ion has 5 atoms of carbon, 1 atom of oxygen, and 10 atoms of hydrogen, and is formed by a γ-hydrogen shift-induced β cleavage involving the gamma carbon on the C6 side of the carbonyl. Most of the abundance of the ion with m/z 87 is probably due to a double-hydrogen-shift rearrangement fragmentation, sometimes referred to as a McLafferty + 1 reaction (Figure 29) (3).

Figure 27: Precursor-ion analysis for m/z 69.
This means that the peak at m/z 87 represents a doublet produced by the X+1 ion of m/z 86 and another ion that produces the ion with m/z 69. A product-ion analysis was acquired using m/z 87 as the precursor ion to provide information on the elemental composition and possible structure of the m/z 87 ion. This analysis also proved that the ion with m/z 87 does fragment to produce the ion at m/z 69 (Figure 30), although it is obvious that the majority of the abundance of the ion with m/z 69 is due to the fragmentation of the hexyl acylium ion with m/z 113.

Figure 28: Two proposed mechanisms for the formation of the ion with m/z 69 from the hexyl acylium ion.
The product-ion mass spectrum for the ion with m/z 87 also shows that this ion will produce ions with m/z 45, 71, and 72. A proposed mechanism for the formation of ions with m/z 45 and 72 is shown in Figure 31. The ion with m/z 71 could be formed by the loss of a hydrogen radical from the ion with m/z 72 or by the loss of a molecule of CH4 from the ion with m/z 87.

Figure 29: Proposed mechanism for the formation of the ion with m/z 69 from the molecular ion of 4-decanone.
To confirm the elemental composition of the ion with m/z 69, this mass spectral peak was analyzed using the MassWorks software. The assigned accurate mass differed from the exact mass of the elemental composition of C5H9 by 0.42 millimass units. Also, an accurate mass assignment was made for the peak at nominal m/z 87, which would represent the doublet 12C413CH10O (87.0765 Da) and C5H11O (87.0810 Da) and was found to be 87.0790 Da; a variance of 3.5 millimass units from the 12C413CH10O composition and –2.0 millimass units from the C5H11O composition. The accurate m/z value assigned to the doublet will be the weighted average of the masses of the two ions based on their abundances.

Figure 30: Product-ion mass spectrum of the ion with m/z 87.
Experimental
EI mass spectral data for accurate mass determinations and relative intensities were acquired using an Agilent Technologies 7890A gas chromatograph (Wilmington, Delaware) coupled to an Agilent 5975C Inert XL MSD single-quadrupole mass spectrometer (Santa Clara, California). The product-ion and precursor-ion data were collected using an Agilent Technologies 7890A gas chromatograph coupled to an Agilent 5975B Inert XL MSD system that had been fitted with the Chromtech GmbH Evolution triple-quadrupole mass spectrometer upgrade (Chromsys LLC, Alexandria, Virginia).

Figure 31: Proposed fragmentation pathways of the fragment ion with m/z 87.
The GC conditions used in all data acquisitions on both instruments were the same (see Table II). Table III contains the acquisition parameters used with the single-quadrupole mass spectrometer; Table IV contains the acquisition parameters used with the triple-quadrupole mass spectrometer; and Table V contains the parameters used for the MS-MS experiments (precursor-ion and product-ion analyses).
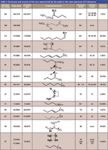
Table I: Structures and sources of the ions represented by the peaks in the mass spectrum of 4-decanone
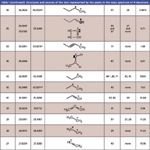
Accurate mass assignments of the ions produced in the EI mass spectrum of 4-decanone were made using the Cerno Bioscience (Danbury, Connecticut) MassWorks (Version 2, 0, 2, 0) software. The Agilent (single-quadrupole) GC–MS system was set to acquire mass spectral data in the raw scan mode with the threshold setting of 0. This resulted in 10 data points per m/z value. The software requires a special calibration of the mass spectral peak shapes acquired by the instrument used to acquire data for accurate mass assignment.
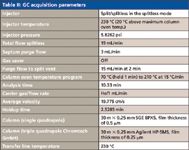
Table II: GC acquisition parameters
Calibration spectra were acquired before and after the elution of the analyte to generate two calibration files in MassWorks (Figure 32). The procedure for acquiring calibration spectra during the mass spectral acquisition is described in Table III under the heading Timed Events. The calibration gas (PFTBA) valve was held open for 1 min to allow the pressure in the source to stabilize to provide constant mass spectral peak shapes. After the Agilent data file is opened with the MassWorks software, nine spectra are averaged at the end of the calibration acquisition period. These spectra and a table of elemental compositions for fragment ions of PFTBA are used to generate the special calibration file. The software automatically calculates the exact masses of the ions using their elemental compositions. The average spectrum selected is then calibrated using the expected mass spectral peak shape to correct the experimental data, which provides the accurate mass assignment. After the calibration file is created, it is saved and can be applied to the data file under the MS analysis mode of the MassWorks software. This procedure was replicated for the second calibration acquisition to provide two different calibration files.

Table III: Single-quadrupole acquisition parameters
The MassWorks CLIPS search function was used for mass spectral peaks that represent two different ions of different elemental composition but that have the same nominal mass (Figure 33). A doublet peak is selected and the CLIPS search function is opened using the assigned accurate mass. The mass tolerance, elements present, range of elements present, electron state, and double-bond equivalence range are selected to allow MassWorks to calculate possible elemental compositions using the selected accurate mass assignments.
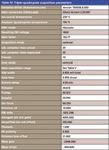
Table IV: Triple-quadrupole acquisition parameters
The mixture search of the CLIPS search function is used for a doublet by providing elemental compositions of known ions represented by adjacent mass spectral peaks to the CLIPS search dialog box. For example, the peak at m/z 57 is a doublet; therefore, the elemental composition for the ion represented by m/z 58 is entered into the CLIPS search to provide the correct mass spectral peak shape for the software to calculate the two possible elemental compositions accurately. This is necessary because the peak at m/z 58 is also a doublet, produced by the X+1 isotope peak from m/z 57 and the peak represented by the ion with an elemental composition of C3H6O+. The accurate mass calculations for the ions in the mass spectrum of 4-decanone are found in Table I. Those values with an asterisk indicate that the EI mass spectra was of very low intensity, which means that there is a greater probability of an error in the assignment.

Table V: MS-MS experiments information
Conclusion
As can be seen from Table I, each and every nonisotope nonbackground peak in the mass spectrum of 4-decanone has been rationalized. The analyte's structure has been confirmed based on these rationalizations and the examination of spectra of compounds thought to be similar to the analyte. The final step is to obtain an authentic sample of the analyte and perform an analysis on the same instrument that generated the spectrum being interpreted.

Figure 32: Mass spectrum of 4-decanone acquired in the raw scan mode. Insert is an expansion of the region between m/z 112 and 115.
The identification of the analyte as being 4-decanone would have been possible by using the database search utility, using the integer m/z value data acquired with a GC–MS instrument based on a transmission quadrupole because spectra of this compound are in the NIST08 Database. If a mass spectrum of the analyte is not in the NIST08 Database or some other available mass spectral database (as would have been the case if the unknown spectrum was that of structures a, b, or d), then the procedure described here will be very useful. The next step in this study will be to synthesize the four compounds represented by structures a, b, d, and e (these compounds are not commercially available) and obtain their mass spectra to determine if assumptions made in this study are correct. Because there is only a single spectrum of 8-methyl-4-nonanone in the NIST08 Database and that spectrum may be saturated, it will be necessary to obtain additional data to conclusively prove the tertiary radical formation theory.

Figure 33: Reconstructed total-ion-current chromatogram of data acquired for accurate mass determinations in the ions represented in the mass spectrum of 4-decanone.
O. David Sparkman, Patrick R. Jones, and Matthew Curtis are with the Pacific Mass Spectrometry Center, Chemistry Department, College of the Pacific, University of the Pacific, Stockton, California.
References
(1) A. Lavanchy, R. Houriet, and T. Gäumann, J. Org. Mass Spectrom. 14(2), 79–85 (1979).
(2) H. Budzikiewicz, C. Djerassi, and D.H. Williams, Mass Spectrometry of Organic Compounds (Holden-Day, San Francisco, 1967), p. 138.
(3) W. Carpenter, A.M. Duffield, and C. Djerassi, J. Am. Chem. Soc. 90, 160–164 (1968).
(4) H.E. Audier, A. Milliet, and J.C. Tabet, Helv. Chim. Acta 63, 344–358 (1980).
(5) J.R. Dias, Y.M. Sheikh, and C. Djerassi J. Am. Chem. Soc. 94(2), 473–481 (1972).

High-Speed Laser MS for Precise, Prep-Free Environmental Particle Tracking
April 21st 2025Scientists at Oak Ridge National Laboratory have demonstrated that a fast, laser-based mass spectrometry method—LA-ICP-TOF-MS—can accurately detect and identify airborne environmental particles, including toxic metal particles like ruthenium, without the need for complex sample preparation. The work offers a breakthrough in rapid, high-resolution analysis of environmental pollutants.
The Fundamental Role of Advanced Hyphenated Techniques in Lithium-Ion Battery Research
December 4th 2024Spectroscopy spoke with Uwe Karst, a full professor at the University of Münster in the Institute of Inorganic and Analytical Chemistry, to discuss his research on hyphenated analytical techniques in battery research.
Mass Spectrometry for Forensic Analysis: An Interview with Glen Jackson
November 27th 2024As part of “The Future of Forensic Analysis” content series, Spectroscopy sat down with Glen P. Jackson of West Virginia University to talk about the historical development of mass spectrometry in forensic analysis.
Detecting Cancer Biomarkers in Canines: An Interview with Landulfo Silveira Jr.
November 5th 2024Spectroscopy sat down with Landulfo Silveira Jr. of Universidade Anhembi Morumbi-UAM and Center for Innovation, Technology and Education-CITÉ (São Paulo, Brazil) to talk about his team’s latest research using Raman spectroscopy to detect biomarkers of cancer in canine sera.