The Applicability of Field-Portable GC–MS for the Rapid Sampling and Measurement of High-Boiling-Point Semivolatile Organic Compounds in Environmental Samples
Special Issues
In this study we report on the use of a field-portable GC-MS with rapid sampling techniques such as solid-phase micro extraction, purge-and-trap, thermal desorption, and heated headspace to provide a fast response for in-field-SVOCs analyses for a wide variety of environmental-type samples including potable waters, tea, plants and road gravel. We will show that this field-portable approach can provide the required sensitivity, selectivity for the effective analysis of SVOCs with very high boiling points such as polycyclic aromatic hydrocarbon (PAHs), pesticides, phenolic compounds and phthalate esters in a number of different field-based samples, in less than 10 minutes.
In this study, we report on the use of field-portable gas chromatography–mass spectrometry (GC–MS) with solid-phase microextraction, purge-and-trap, thermal desorption, and heated headspace sampling techniques to provide a fast response for in-field analysis of semivolatile organic compounds (SVOCs) in a wide variety of environmental-type samples including potable waters, tea, plants, and road gravel. We demonstrate that this field-portable approach can provide the required sensitivity and selectivity for the effective analysis of SVOCs with very high boiling points such as polycyclic aromatic hydrocarbons (PAHs), pesticides, phenolic compounds, and phthalate esters in a number of different field-based samples, in less than 10 min.
Over the years, many types of analytical instruments have been reduced to a portable or handheld format to be used in the field, including X-ray fluorescence (XRF), laser induced breakdown spectroscopy (LIBS), Raman, Fourier transform infrared (FT-IR), and near-infrared (NIR) analyzers. However, shrinking a gas chromatography–mass spectrometry (GC–MS) system to a field-portable configuration, while maintaining laboratory analytical performance, is a much greater challenge. Most of the previous attempts have used “point-and-shoot” approaches, which have not required any type of sample preparation or sample introduction accessories. For that reason, the practical value of a field-portable instrument is reduced significantly if it necessitates complex sample preparation or delicate procedures are required to introduce the sample into the gas chromatograph.
In this study, we describe results from field-portable GC–MS analysis of a wide variety of environmental samples (gas, liquid, solid), including high-boiling, semivolatile organic compounds (SVOCs). The analyses performed included
- Quantifying a mixture of terpenes
- Detecting geosmin in potable waters
- Analyzing polycyclic aromatic hydrocarbons (PAHs) in asphalt and coal tar–based gravel
- Characterizing a suite of organochlorine pesticides in black tea
- Screening for phenolic compounds and phthalate esters in water
The rapid sampling techniques used include solid-phase microextraction (SPME), a needle trap for gaseous samples, purge-and-trap and thermal desorption sampling for aqueous samples, and heated headspace sampling for solid samples. The combination of field-portable GC–MS with rapid sample preparation and introduction techniques enables a wide variety of field-based assays, including quantitative studies, and provides actionable results for nonspecialist operators in the field.
Experimental
The system used in this study was a Torion T-9 portable GC–MS system (PerkinElmer) with a compact, battery-operated, rugged, fieldable sampling accessory. The original system and its applicability for field-based analysis have been described previously in the open literature (1,2). However, a number of recent improvements have been made by replacing the conventional capillary column with a low-thermal-mass column bundle that uses direct-contact electrical resistive heating. This column provides identical heat distribution, but nearly eliminates cooler spots of traditional column technology, thus improving the chromatographic separation for SVOCs at the high temperature GC runs required for high-boiling-point compounds.
The mass spectrometer uses a toroidal ion-trap configuration, which is well-suited for miniaturization compared to other designs (3). The novel configuration allows for large trapping volumes, which result in high ion counts, low noise levels, and good spectral quality. The ion-trap mass analyzer is heated to ~175 °C and operates under vacuum, which results in the electrodes staying clean for long periods of time and reduces the need for frequent maintenance.
Instrumental Conditions
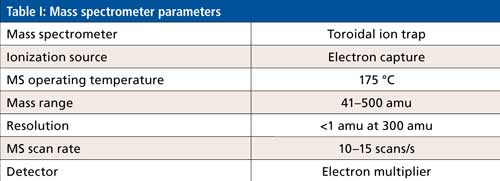
The mass spectrometer operating conditions for this investigation are shown in Table I. The GC separating conditions are described in each subsection on the methodology for each different type of sample matrix.
Methodology
Let’s now take a more detailed look at the methodology for analysis of a suite of different SVOCs, with a wide range of boing points.
The Analysis of Terpenes
Terpenes are a large class of organic compounds, produced by a variety of plants, including conifers, hops, and cannabis with a typical boiling point range of 150–180 °C. They are the primary constituents of the essential oils of many types of plants and flowers widely used as fragrances in perfumery, as well as for medicinal purposes. Synthetic variations and derivatives of natural terpenes are also used for a variety of aromas and flavors used as food additives. Therefore, to exemplify the capability of this technology, four terpene compounds were spiked into 200 mL of 0.6% sodium chloride in water. The analytes were then extracted using half–half SPME polydimethylsiloxane–divinylbenzene (PDMS–DVB) 65-µm fibers at room temperature (22 °C) for 15 min without shaking or vibrating. With this sampling approach, the fiber is placed half in the head space and half immersed into the liquid phase of the sample, as shown in Figure 1.
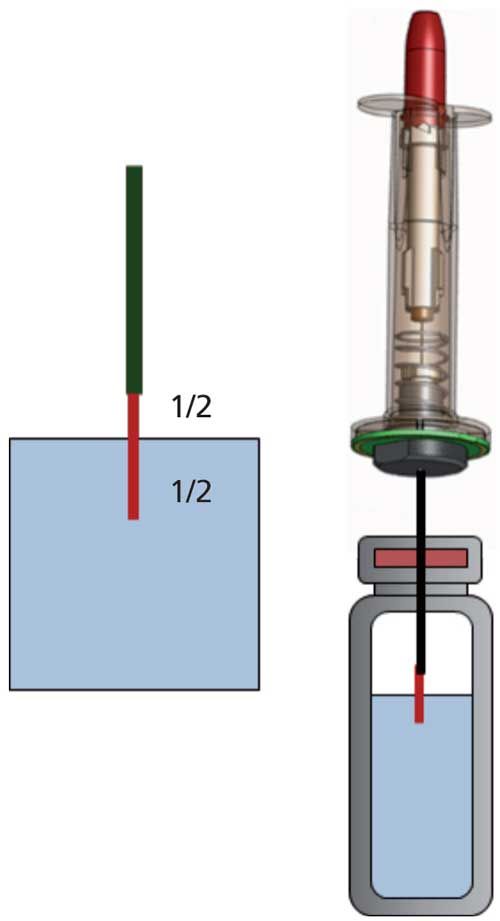
Figure 1: The four terpene analytes were extracted by half–half SPME (PDMS–DVB 65 µm fibers) at room temperature (22 °C) for 15 min, before being injected into the GC–MS system.
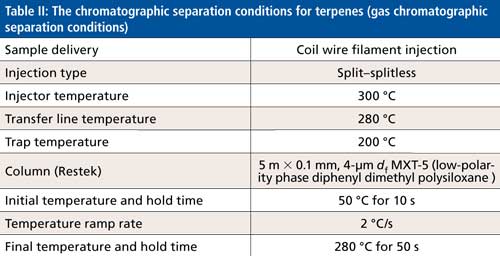
This sample was then injected into the GC–MS system using the chromatographic separating conditions shown in Table II.
The total ion chromatogram (TIC) of the four terpenes ([+]-α-pinene, myrcene, [+]-α-limonene, and isolongifolene), is shown in Figure 2.
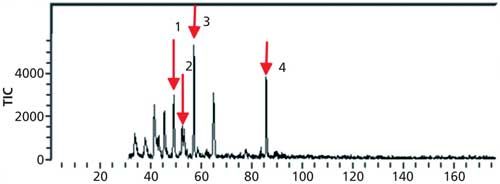
Figure 2: Total ion chromatogram of four terpene compounds. Peaks: 1 = (+)-α-pinene, 2 = myrcene, 3 = (+)-α-limonene, 4 = isolongifolene.
A four-point calibration graph was then generated for the four terpene compounds. The concentrations of the standards and the respective calibration plots with correlation coefficients (R2) are shown in Figure 3. It should be noted that the estimated detection limit for the four compounds was 20 ppt, which was based on the statistical analysis of multiple replicates of the lowest standard (sample 1).
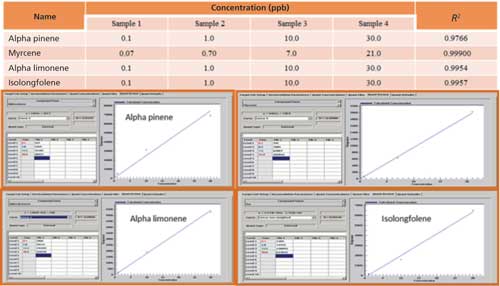
Figure 3: Calibration plots of the four terpene compounds.
Analysis of Geosmin in Drinking Water
Geosmin is an organic compound produced by a variety of microorganisms and bacteria. It has a distinct earthy flavor and aroma and is responsible for the earthy taste of beets and the strong scent that occurs in the air when rain falls after a dry spell of weather. Geosmin is produced by several classes of microbes, including cyanobacteria and actinobacteria, and is released when these microbes die. Communities whose water supplies depend on surface water can periodically experience episodes of unpleasant-tasting water when a sharp drop in the population of these bacteria releases geosmin into the local water supply (9). Chemically, it is a bicyclic alcohol with a formula of C12H22O, and a derivative of decahydronaphthalene, commonly known as decalin. Its boiling point is ~270 °C (10).
For this study, 20 ppt of geosmin was spiked into 500 mL of a water sample. Without any pretreatment step, the water sample was then passed through polydimethylsiloxane (PDMS) particles (125–180 µm size) packed in a deactivated stainless steel solid-phase extraction (SPE) desorption tube at ambient temperature using a flow rate of 25–35 mL/min delivered by a vacuum pump. The target analyte was then transferred into a PDMS needle trap using the instrument’s thermal desorber system. The desorption step was carried out at 200 °C at 6 mL/min for 10 min, using helium carrier gas. Sample introduction into the GC–MS system using the needle trap was conducted at 270 °C for 60 s. A schematic of the sample delivery approach is shown in Figure 4.
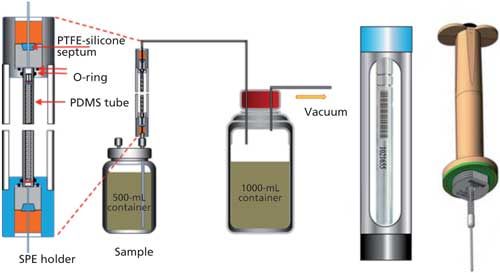
Figure 4: The sampling procedure and thermal desorption step for the analysis of geosmin by GC–MS.
The chromatographic separation conditions are shown in Table III. The TIC of the separation is shown in Figure 5, together with the extracted ion chromatogram (RIC), showing the parent molecular ion and the associated fragments of geosmin, which is confirmed by the National Institute of Standards and Technology (NIST) reference mass spectrum underneath it. Figure 6 shows the deconvoluted chromatogram and mass spectrum, demonstrating that the 20 ppt geosmin is well-separated using the instrument’s deconvolution algorithm. Based on the statistical analysis of the geosmin calibration, it was estimated that the detection limit was in the order of single-digit parts-per-trillion levels.
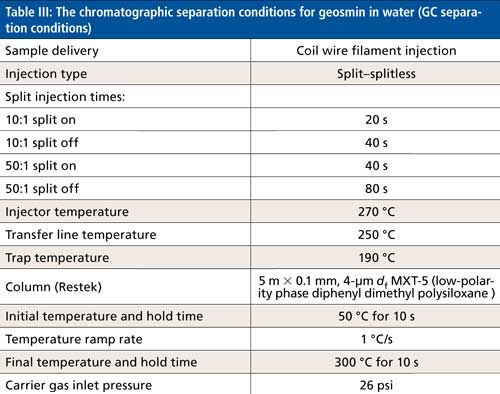
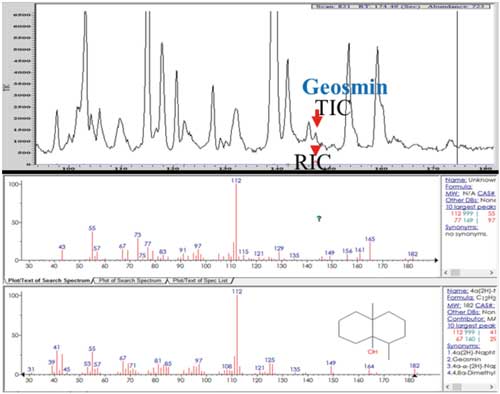
Figure 5: Total ion (TIC) and extracted ion chromatograms (RIC) of geosmin and its MS fragments in a water sample, identified and confirmed by the mass spectrum from the NIST reference library.
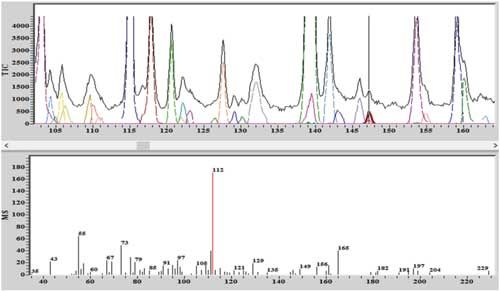
Figure 6: The deconvoluted chromatogram and mass spectrum demonstrating that the geosmin is well-separated using the instrument’s deconvolution algorithm.
PAHs in Asphalt and Coal Tar-Based Gravel Samples
Road and parking lot surfaces are typically made from asphalt and coal tar products that contain high levels of carbonaceous compounds. For this reason it is very important to know the composition of the polycyclic aromatic hydrocarbon levels in the gravel samples used in the road surface preparation process. PAHs in these types of samples typically range from napthalene up to dibenz[a,h]anthracene with boiling points between 220 °C and 525 °C. It is well recognized that high-temperature program methods are normally required for the determination of high-boiling-point semivolatile analytes such as PAHs and pesticides in various environmental sample matrices, which can make it extremely difficult to separate these compounds with good spectral quality (4–8).
So for this study, 40 g of the gravel samples was spiked with stock standard solutions to make calibration standards of 0.05, 0.25, 0.5, and 1.0 ppm of the PAH analytes. The samples were then extracted with a mixture of dichloromethane (5 mL) and water (~15 mL) by hand shaking for about 2–3 min. The liquid phase was then transferred to another vial to let the two phases separate out. For some of the samples, preconcentration was necessary to improve the detection. This preconcentration was achieved by placing 1 mL of the organic phase into a 2-mL vial and allowing the solvent to evaporate to get a suitable volume for the measurement. A 20-µL aliquot of the sample in the organic phase was then introduced into the glass tube using a syringe and the solvent was eliminated using a vacuum pump or air compressor. The target analytes then were transferred into the PDMS needle trap using a sample displacement approach at 300 °C for 5 min with a purging flow rate of 30 mL/min. The GC conditions for the separation are shown in Table IV. The TIC of the separation is seen in Figure 7 and clearly shows that high-molecular-weight, high-boiling-point PAHs, such as benzo[ghi]perylene and benzo[b]fluoranthene, have been separated and detected.
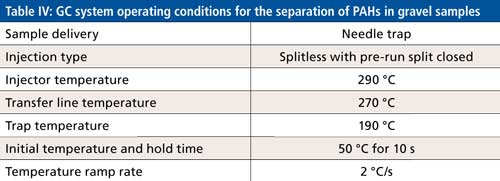
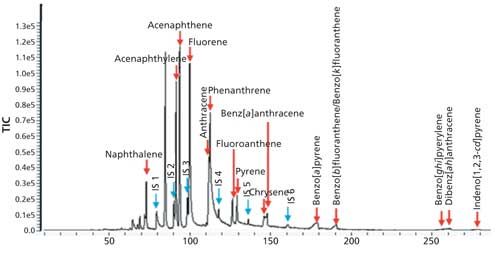
Figure 7: TIC of a 250 ppb spiked sample of PAHs.
Organochlorine Pesticides in Tea
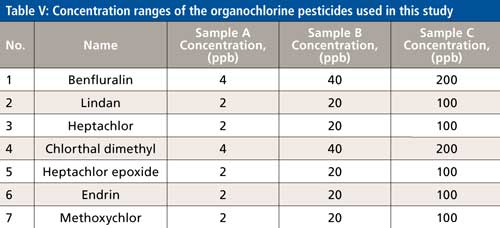
For this investigation, 20 g of dry black tea was steeped in 500 mL of hot water and left for four days at 22 oC. Then a 15 mL sample was spiked at three concentration levels (A, B, C) of seven different organochlorine insecticides shown in Table V, with boiling points ranging between 275 °C and 425 °C.
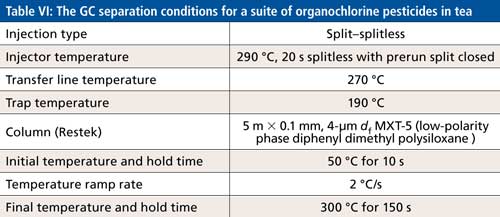
The sample preparation was performed using SPME fibers conditioned at 220 °C for 60 min, and the immersion extraction process was carried out at 22 °C for 10 min by stirring with a bar mixer at 300 rpm. The fibers were then rinsed after the extraction with deionized water for 10 s without vibration. The sample was injected at 270 °C for 40 s (15 s splitless). After injection the fibers were washed with deionized water for 30 s and conditioned at 270 °C for 30 s (in the GC injector). The GC separation conditions are shown in Table VI.
The TIC of sample B is shown in Figure 8.
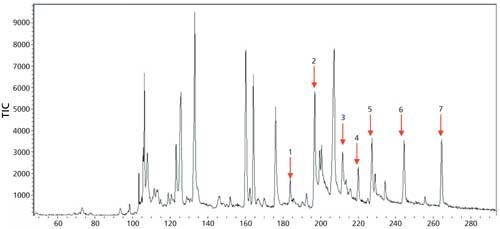
Figure 8: The TIC of the seven organochlorine pesticides in sample B (identity and concentration of pesticide shown in Table V).
General Screening Tool for SVOCs
This portable GC–MS approach can also be used as a general screening tool for SVOCs in water using micro liquid extraction and a coil wire filament. The experiments were carried out using tap water spiked with SVOCs at concentrations from low-parts-per-billion to sub-parts-per-million levels. A small amount (0.2–0.5 mL) of suitable solvent, such as dichloromethane, hexane, pentane, or acetone, is used for extraction. Manual shaking and salting-out may be applied using sodium chloride at 0.5–3% to speed up the extracting process. The extraction is performed for a few minutes and the solvent containing the analytes is then applied on to the coil, or if necessary, concentrated by letting the solvent evaporate after transferring it to a small vial. Sample introduction using the coil is performed after solvent on the coil is evaporated. The screening tests were carried out with mixtures of PAHs, phenolic compounds, phthalate esters, organochlorine, organophosphorus, and pyrethroid pesticides and herbicides. However, because we have previously shown the separation of PAHs and various pesticides, we only show representative data for the phenolic compounds and the phthalate esters here. The chromatographic separation conditions for the phenols and phthalate esters are shown in Table VII.
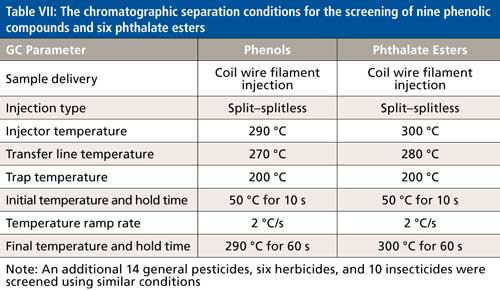
Figure 9 shows the TIC of the separation of all the phenolic compounds in water, with phenol (C6H5OH) identified with the bold red arrow. The RIC of phenol is shown on the right with the reference mass spectrum from the NIST library below it. The phenols identified from left to right are phenol, 4-methylphenol, 2-nitrophenol, 3,5-dichlorophenol, 4-chloro-3-methylphenol, 2,4,6-trichlorophenol, 4-nitrophenol, 2-methyl-4,6-dinitrophenol, and pentachlorophenol.
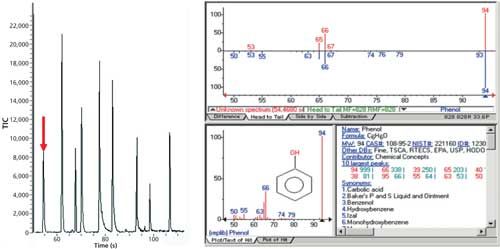
Figure 9: The TIC of the separation of all the phenolic compounds in water with phenol (C6H5OH) identified with the bold red arrow. The XIC of phenol is shown on the right, with the reference mass spectrum from the NIST library below it. The full suite of phenols going from left to right includes phenol, 4-methylphenol, 2-nitrophenol, 3,5-dichlorophenol, 4-chloro-3-methylphenol, 2,4,6-trichlorophenol, 4-nitrophenol, 2-methyl-4,6-dinitrophenol, and pentachlorophenol.
The group of phthalate esters is shown in Figure 10, with dimethyl phthalate (C10H10O4) shown with the bold red arrow. The RIC of dimethyl phthalate is shown on the right, with the reference mass spectrum from the NIST library below it. The phthalate esters identified from left to right are dimethyl phthalate, diethyl phthalate, dibutyl phthalate, benzyl butyl phthalate, diisooctyl phthalate, and di-n-octyl phthalate.
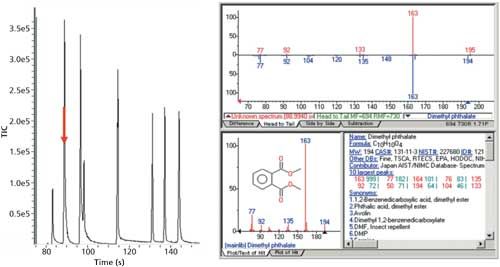
Figure 10: The TIC of the separation of a group of phthalate esters with dimethyl phthalate (C10H10O4) shown with a bold red arrow. The XIC of dimethyl phthalate is shown on the right with the reference mass spectrum from the NIST library below it. The full suite of phthalate esters going from left to right includes dimethyl phthalate, diethyl phthalate, dibutyl phthalate, benzyl butyl phthalate, diisooctyl phthalate, and di-n-octyl phthalate.
The total running time for these screening tests for both phenols and phthalate esters was less than 3 min. Ion molecule chemistry occurred to some degree on both types of samples, so absolute identification was confirmed using the NIST library search capability. Although the peak capacities are relatively low for these separations, the deconvolution algorithm helped to separate and identify the analytes with greater accuracy. Dynamic ranges and detection limits in real samples will be determined and presented in a future study.
Conclusion
There is a growing demand for the analysis of trace levels of volatile and semivolatile organic compounds in air, water, and solid matrix samples under harsh conditions in remote, field-based locations. This study has demonstrated that it is now possible to achieve laboratory-grade performance with portable GC–MS combined with rapid sample preparation or introduction techniques. This combination enables a wide variety of environmental-based assays for both quantitative and qualitative screening purposes, which can provide fast, actionable data for nontechnical and inexperienced operators in the field.
It has been demonstrated that the approach used in this study has detected SVOCs relevant to terpenes, plant protection chemicals, and polycyclic aromatic hydrocarbons (PAHs), with very high boiling points (up to 550 °C), at low parts-per-trillion concentrations in under 10 min total analysis time. It has also been shown that the detection of natural compounds such as geosmin can be detected in water at low parts-per-trillion levels. In addition, the screening of phenolic compounds and phthalate esters in drinking water can be carried out at low parts-per-billion levels. As a result, the use of portable GC–MS and associated sampling techniques provide the required sensitivity, selectivity, and speed of analysis for the effective analysis of high-boiling-point SVOCs in the field.
References
- J.A. Contreras et al., Journal of American Society of Mass Spectrometry19(10), 1425–1414, (2008).
- T.V. Truong et al., Scientia Chromatographica6(1), 13–26, (2014).
- Product Note: Torion T-9 portable GC/MS, PerkinElmer Inc., Shelton, CT: http://torion.com/fileadmin/media/documents/brochures/Torion_T9 _GCMS_ProductNote.pdf.
- SW-846, Test Method 8275A: Semivolatile Organic Compounds in Soil/Sludges and Solid Wastes Using Thermal Extraction/Gas Chromatography/Mass Spectrometry (TE/GC/MS): United States Environmental Protection Agency, December, 1996: https://www.epa.gov/hw-sw846/sw-846-test-method-8275a-semivolatile-organic-compounds-soilsludges-and-solid-wastes-using.
- Test Method 8141A: The Analysis of Organophosphorus Pesticide Compounds by GC Capillary Column Technology, United States Environmental Protection Agency, September, 1994: https://www3.epa.gov/wastes/hazard/testmethods/sw846/pdfs/Method %208141A,%20Revision%201%20-%201994.pdf.
- U.S. Environmental Protection Agency, Compendium Method TO-13A, Determination of Polycyclic Aromatic Hydrocarbons (PAHs) in Ambient Air Using Gas Chromatography/Mass Spectrometry (GC/MS). Office of Research and Development, Cincinnati, OH. March, 1999: https://www3.epa.gov/ttnamti1/files/ambient/airtox/to-13arr.pdf.
- R. Provost, L. Marotta, and R. Thomas, LCGC North Am. 32(10), 810–818 (2014).
- L. Marotta, S. Varisco, M. Snow, T. Kwoka, and R. Thomas, LCGC North Am. 34(3), 214–220 (2016).
- N.N. Gerber and H A. Lechevalier, Appl. Microbiol. 13(6), 935–938 (1965).
- T. Manickum and W. John, Hydrol.: Curr. Res. 2(3), 1–10 (2012).
Tai Van Truong and Nathan L. Porter are senior scientists for portable MS and GC-MS at PerkinElmer in American Fork, Utah. Edgar D. Lee is a director of research for portable MS and GC–MS at PerkinElmer. Robert J. Thomas is the principal consultant at Scientific Solutions in Gaithersburg, Maryland. Direct correspondence to: tai.truong@perkinelmer.com
High-Speed Laser MS for Precise, Prep-Free Environmental Particle Tracking
April 21st 2025Scientists at Oak Ridge National Laboratory have demonstrated that a fast, laser-based mass spectrometry method—LA-ICP-TOF-MS—can accurately detect and identify airborne environmental particles, including toxic metal particles like ruthenium, without the need for complex sample preparation. The work offers a breakthrough in rapid, high-resolution analysis of environmental pollutants.
The Fundamental Role of Advanced Hyphenated Techniques in Lithium-Ion Battery Research
December 4th 2024Spectroscopy spoke with Uwe Karst, a full professor at the University of Münster in the Institute of Inorganic and Analytical Chemistry, to discuss his research on hyphenated analytical techniques in battery research.
Portable and Wearable Spectrometers in Our Future
December 3rd 2024The following is a summary of selected articles published recently in Spectroscopy on the subject of handheld, portable, and wearable spectrometers representing a variety of analytical techniques and applications. Here we take a closer look at the ever shrinking world of spectroscopy devices and how they are used. As spectrometers progress from bulky lab instruments to compact, portable, and even wearable devices, the future of spectroscopy is transforming dramatically. These advancements enable real-time, on-site analysis across diverse industries, from healthcare to environmental monitoring. This summary article explores cutting-edge developments in miniaturized spectrometers and their expanding range of practical applications.
Mass Spectrometry for Forensic Analysis: An Interview with Glen Jackson
November 27th 2024As part of “The Future of Forensic Analysis” content series, Spectroscopy sat down with Glen P. Jackson of West Virginia University to talk about the historical development of mass spectrometry in forensic analysis.
Revealing the Ancient Secrets of Chinese Swamp Cypress Using Cutting-Edge Pyrolysis Technology
November 18th 2024A study published in the Journal of Analytical and Applied Pyrolysis by Yuanwen Kuang and colleagues used advanced pyrolysis techniques to reveal the preservation and chemical transformations of 2,000-year-old Chinese swamp cypress wood, offering valuable insights for archaeological conservation and environmental reconstructions.