Applications of Micro X-Ray Fluorescence Spectroscopy in Food and Agricultural Products
In recent years, advances in X-ray optics and detectors have enabled the commercialization of laboratory μXRF spectrometers with spot sizes of ~3 to 30 μm that are suitable for routine imaging of element localization, which was previously only available with scanning electron microscopy (SEM-EDS). This new technique opens a variety of new μXRF applications in the food and agricultural sciences, which have the potential to provide researchers with valuable data that can enhance food safety, improve product consistency, and refine our understanding of the mechanisms of elemental uptake and homeostasis in agricultural crops. This month’s column takes a more detailed look at some of those application areas.
Food and agricultural products are important contributors to human health, and the elemental composition of these products is a critical determinant of plant yield, product quality, marketability, and nutritional value. Accurately analyzing the elemental composition of these products is essential for optimizing agricultural practices and ensuring the safety and quality of food products. X-ray fluorescence (XRF) spectroscopy is a powerful tool for elemental analysis in agricultural and plant sciences due to its ease of use and ability to provide quantitative or semi-quantitative analysis of solid materials. The non-destructive nature of XRF analysis allows the determination of elemental composition while preserving sample integrity including the analysis of live plants (1).
XRF spectroscopy is based on the ejection of an inner orbital electron by an incident X-ray, resulting in an electron hole that is subsequently filled by an electron from a higher energy orbital. This results in the fluorescent emission of element specific characteristic X-rays which can be detected by either an energy dispersive or wavelength dispersive spectrometer, yielding information on the elemental composition of the specimen. Significant advances in X-ray optics and detectors have facilitated the commercialization of laboratory micro XRF (µXRF) spectrometers (2). These instruments offer spot sizes in the ~3 to 30 µm range, enabling routine imaging of element localization within samples. Such non-destructive high-resolution elemental mapping could previously only be achieved on relatively small areas using scanning electron microscopy with energy dispersive spectroscopy (SEM-EDS), or by using µXRF beamlines at synchrotron facilities. The development of laboratory scale µXRF spectrometers allows for application across various research and industrial settings. The capability to collect data on element distribution from large and hydrated samples such as intact plants, with performance approaching that of synchrotron beamlines, opens a variety of new µXRF applications in food and agricultural sciences (3). These advancements offer a new tool to enhance agricultural productivity, food safety, and nutritional quality.
Micro-XRF spectroscopy can be utilized to ensure the quality of food products by detecting and quantifying both essential and trace elements. While bulk analysis techniques such as inductively coupled plasma mass spectrometry (ICP-MS), optical emission spectroscopy (ICP-OES), and conventional XRF analysis are well established, these techniques do not provide localized spatial information. This capability is crucial for verifying nutrient distribution and ensuring compliance with regulatory standards. The accurate measurement of elements such as iron, calcium, and zinc in food products can help manufacturers ensure that products meet nutritional guidelines. This technique is also potentially useful in identifying specific sources of adulteration in food products, which is vital for maintaining the integrity of food supply chains and protecting consumer health (4). Adulteration can occur intentionally (such as the addition of cheaper ingredients to reduce costs or inorganic pigments to improve color), or unintentionally (through contamination during production or storage). The screening of food packaging materials for toxic elements such as lead or cadmium which may leach into food products can ensure the safety of packaging materials.
The imaging capability of µXRF allows for quantification or semi-quantification of element concentrations, but more importantly spatial localization which is useful for crop diagnostics (5). The ability to image the distribution of elements within live plant tissue provides new insights into the mechanisms of elemental uptake and homeostasis (6). This knowledge is essential for developing strategies to enhance nutrient efficiency and mitigate the accumulation of toxic elements in crops. Micro-XRF can reveal the localization of beneficial elements, such as calcium, which is important for preventing disorders like blossom-end rot or to detect potentially toxic elements, such as cadmium in vegetables (7). The objective of this work was to evaluate the efficacy of µXRF for elemental imaging in realistic samples and to demonstrate its performance in applications relevant to food and agricultural products.
Experimental
Samples and Sample Preparation
Samples of food and plant materials were obtained from retail grocery outlets in Northern Michigan. Samples generally required no additional preparation steps for analysis except as follows: Samples were placed either directly on the sample stage with a layer of anti-slip material (foam shelf liner; tortilla chip, wheat cracker and applesauce cup), or placed on polyethylene terephthalate (PETE) film (“acetate film”) supported on a 3D printed frame to reduce x-ray scattering from the stage (cucumbers, food packaging, and tomato leaf). The cucumber samples were secured to the acetate with low-density polyethylene (LDPE “cling wrap” prior to analysis to prevent drying. Tomato (Solanum lycopersicum) leaves were harvested from plants grown from seed in the Lake Superior State University (LSSU) greenhouse and were ~4 weeks old at the time of harvest. Evaporation during imaging was reduced by covering leaves in 3 µm mylar film (Fisher Scientific) and completed within ~2 hours of harvest. Other samples were imaged in air, and dry (vacuum stable) samples were imaged under vacuum (pressure = 2 mbar). Lead(II) chromate used for adulteration of cinnamon was purchased from Fisher Scientific.
Instrument Configuration
Elemental imaging by µXRF spectroscopy was conducted with an M4 Tornado Plus spectrometer (Bruker Nano GmbH). The spectrometer was equipped with a primary source consisting of a rhodium anode with polycapillary optics yielding an X-ray spot size of ~20 µm, and a second X-ray source consisting of a microfocus tungsten anode and variable collimator optics (0.5–4.5 mm). Fluorescence x-rays were detected using twin 60 mm2 silicon drift detectors equipped with light element windows, enabling the detection of the carbon Kα peak at 0.277 keV when imaging under a vacuum or helium atmosphere. The stage accommodates samples weighing up to 7.5 kg and has a scan area of 16 x 19 cm (larger samples can be accommodated, so long as they don’t collide with the interior housing during scanning). Peak identification, spectral deconvolution, and image processing was performed using the instrument software (M4 Esprit, Standard).
Results and Discussion
Food Quality Control and Effects of Processing on Nutrients
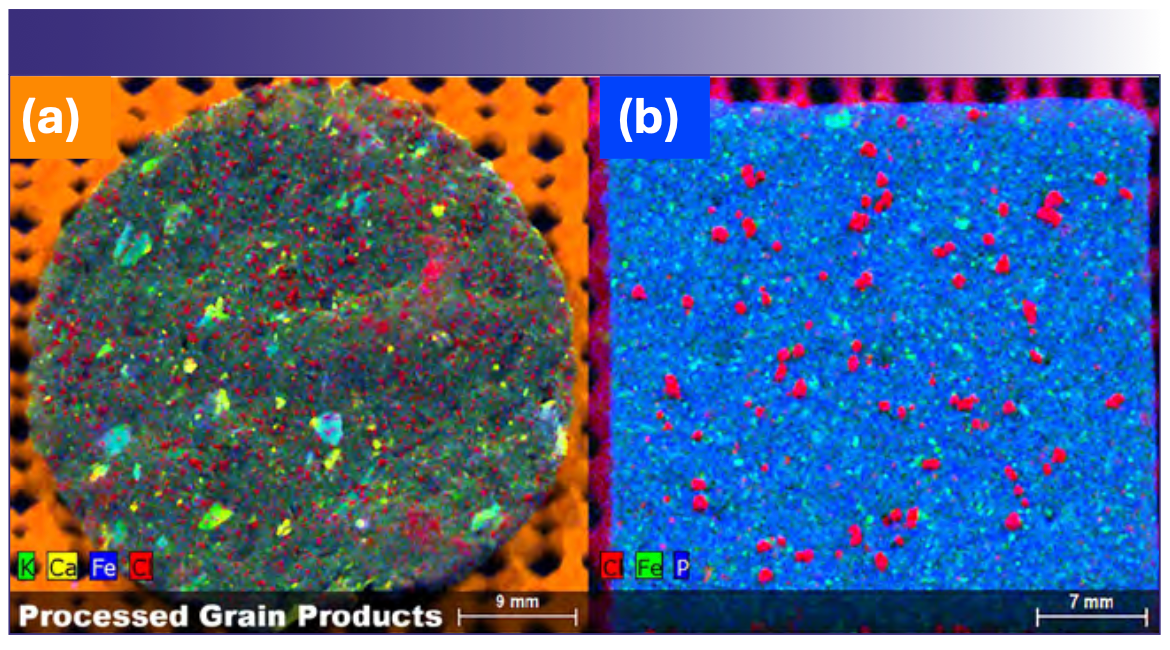
Consumer preference for nutritious food of uniform quality has resulted in food manufactures devoting significant attention to consistency of product aroma, flavor, texture, and appearance. For products where the elemental distribution affects product quality, µXRF offers unique advantages over conventional techniques for bulk analysis, as it offers insights on the element distribution of food components. One example where µXRF is particularly useful is imaging the distribution of salt within food products. Figure 1 shows the distribution of salt within a tortilla chip and a wheat cracker by mapping the Cl Kα (red). In the case of the wheat cracker, salt grains are relatively coarse and distributed at a relatively low density. The tortilla chip, by contrast, contains significantly smaller grains, distributed at a higher spatial density. Both the tortilla chip and the wheat cracker also show distinct iron rich regions, with the tortilla chip also showing potassium/calcium rich regions (refer to Figure 1 for color codes). Given the nutritional importance of these elements, understanding the distribution and homogeneity of these elements may yield additional insights on the effects of food processing on nutrient distribution.
FIGURE 1: Processed grain products. Element maps of (a) tortilla chip, and (b) wheat cracker.
Additional examples of how µXRF can be utilized to understand the effects of food processing on nutrient distribution are illustrated in Figures 2 and 3. Figure 2 illustrates the differences in the elemental distribution resulting from the pickling process. In the fresh cucumber slice (Figure 2b), calcium is concentrated in the outer epidermal layers, along the vascular network, and in the ovule. Potassium, on the other hand, is abundant in the tissue immediately below the peel and is concentrated in the locular tissue surrounding the ovules. In both wet treatments, this localization is lost, however the calcium chloride found in pickling salts has clearly permeated the tissue in the pickled slice. The impacts of the calcium chloride is even more evident in the chlorine map (Figure 2c), where the element is virtually absent in the first two treatments. Figure 2d shows the sulfur distribution, while Figure 2e shows the zinc distribution. These two elements show the same delocalization of nutrients occurring during processing as indicated in Figure 2b (refer to Figure 2 for color codes).
FIGURE 2: Three different treatments of cucumber fruit slices. (a) Visible light image of (from left to right) a freshly slice cucumber, a peeled & vinegared cucumber prepared for a salad, and a slice from a whole commercial pickle; (b) µXRF element distribution of potassium and calcium in the cucumber fruit slices from (a); (c) chlorine element map; (d) sulfur element map; (e) zinc element map.
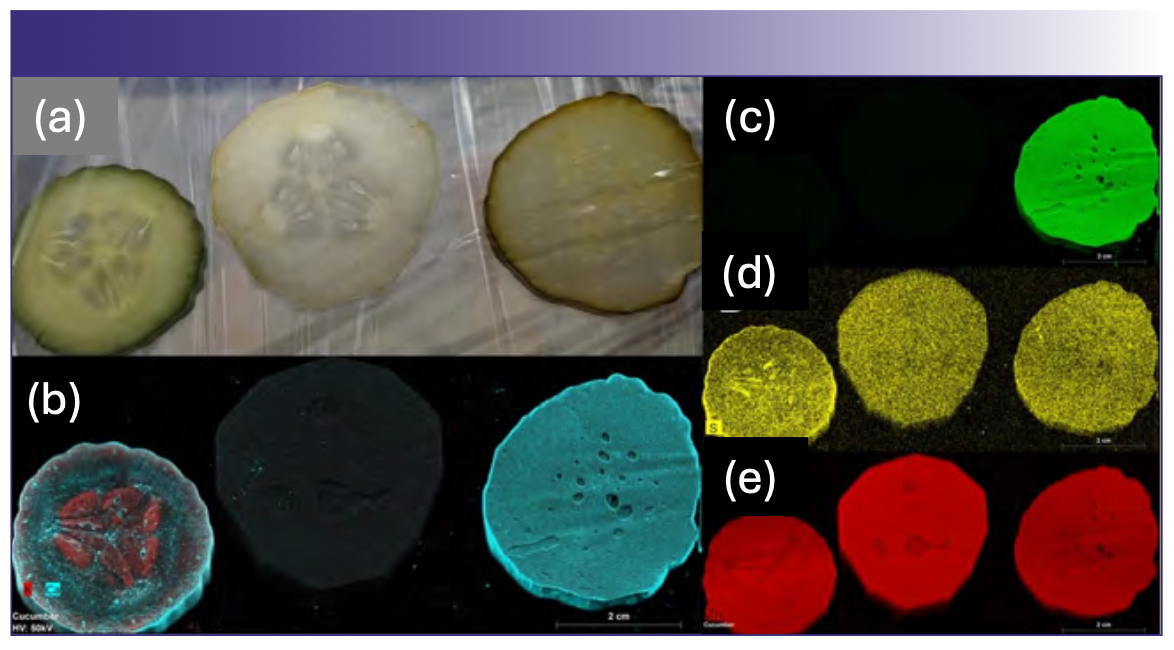
FIGURE 3: Bananas. Two μXRF images of banana slices. (a) Image shows nutrient distribution in a freshly sliced banana, while (b) the image on the right is a commercially prepared banana chip. Three primary nutrients are displayed in each (silicon, phosphorus, and potassium).
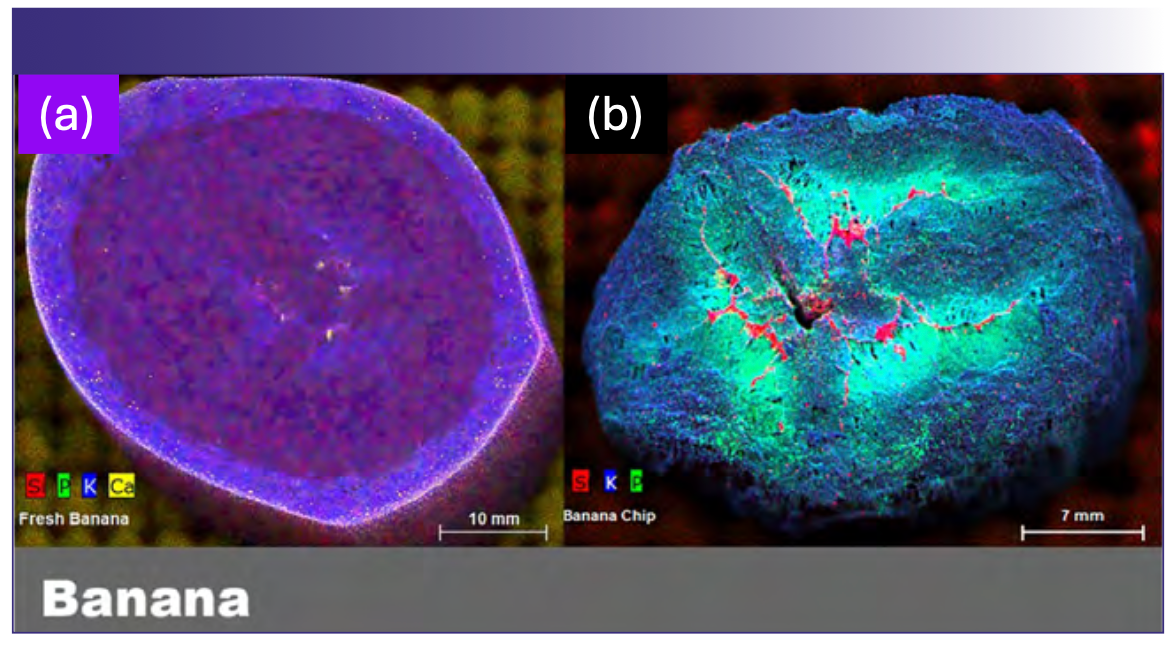
Clear differences between a fresh banana and the commercial banana chip were observed (Figures 3a and 3b), particularly with regard to the silicon distribution. In the banana chip, the silicon distribution is concentrated in the central region, while silicon appears to be distributed more uniformly throughout the fresh banana slice. Possible explanations include alterations of the silicon distribution during the dehydration process or potentially the use of silica as a desiccant or anti clumping agent (no silica addition was indicated in the label ingredients). Additionally, it is also clear that calcium is enriched in the banana peel, which is typically discarded in common practice, relative to the fruit.
Food Adulteration
The presence of potentially toxic elements in food is an ongoing concern, whether introduced through natural processes or intentionally added. While some foods have long been recognized as a dietary source of elements sufficient to result in a public health risk (such as mercury in fish), in recent years a number of additional foods have been a source of concern. For example, in 2016 the U.S. Food and Drug Administration issued a risk analysis suggesting that exposure the arsenic from rice, a common ingredient in baby food, significant increased lifetime risk of bladder and lung cancers, and may constitute a public health concern (8). In addition to exposure from naturally occurring elemental impurities in foods, additional food safety risks may occur due to the intentional economic adulteration of foods. A recent example was the discovery of lead chromate in cinnamon, first identified in cinnamon applesauce in 2023 (9). The resulting investigation identified cinnamon containing lead concentrations as high as 5100 µg/g, and 1200 µg/g, of chromium, and the recall of numerous cinnamon apple sauce products in March, 2024 (10).
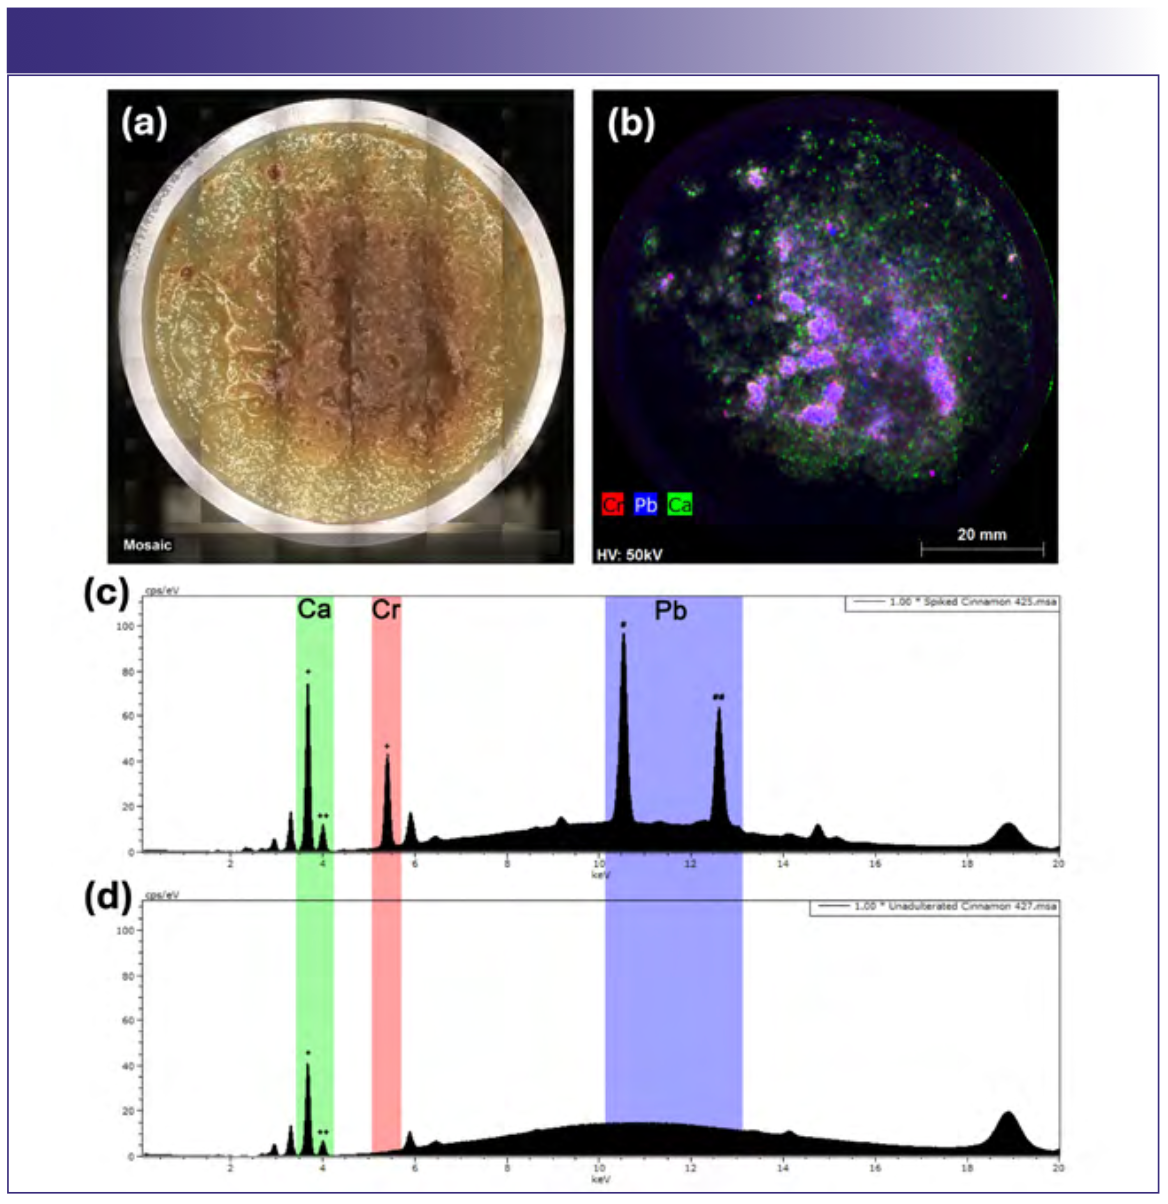
As a demonstration of how µXRF might be used to detect adulteration in food products, commercial cinnamon was purposely adulterated with lead chromate (~5000 µg/g) and added to a commercial plain applesauce cup for elemental imaging (Figure 4). Lead (blue) and chromium (red) were readily detected in the adulterated applesauce and are clearly associated with the cinnamon. Calcium (green) was also highly enriched in the cinnamon relative to the applesauce, and the elemental images show that the lead chromate was not completely homogenous within the cinnamon despite vigorous manual mixing. Spot analysis on the cinnamon was subsequently performed using both the Rh source with polycapillary optics and the tungsten source with the 4.5 mm collimator (60 s live time, Figures 4c and 4d), and both spectra showed clear lead and chromium peaks with excellent signal to noise, confirming adequate sensitivity under both sets of analytical conditions.
FIGURE 4: Adulteration of cinnamon in applesauce. Commercial ground cinnamon was purposely adulterated with 5000 μg/g lead(II) chromate. (a) Vis- ible light image; (b) element map (Rh source) of Ca (green), Cr (red), and Pb (blue); (c) spectrum (Rh source) showing characteristic fluorescence peaks for Ca, Cr, and Pb (+ Kα, ++ Kβ, # Lα, ## Lβ); (d) spectrum (Rh source) of unadulterated cinnamon demonstrating that Cr and Pb are not detected.
While bulk analysis techniques such as ICP-MS and ICP-OES should have sufficient sensitivity to readily identify the lead and chromium contamination in this example, information on their spatial distribution would have been lost in the sample preparation/digestion process, potentially delaying the identification of the cinnamon as the adulterated component. Further, as µXRF imaging is nondestructive, the same sample could have been subsequently analyzed by additional techniques following imaging, whereas utilizing plasma spectroscopy techniques first would have precluded further spatially resolved analysis.
Identification of Elemental Components in Food Packaging
Food packaging is a necessary component of many commercial food items, and can provide significant benefits with respect to preservation of product quality as well as improving consumer appeal. Nonetheless, packaging components must be selected with care, as they have the potential to contribute to exposure to potentially toxic elements through various routes including migration into foods under certain conditions, hand to mouth transfer, and the potential of young children to chew on packaging materials (11). A particular risk is the potential use of inorganic pigments in packaging materials, especially in foods which may be consumed by children. While plasma spectroscopy techniques such as ICP-MS and ICP-OES are able to detect inorganic components such as pigments with high sensitivity, sample preparation and digestion is sometimes challenging for some packaging materials, and loss of spatial information may confound attempts to understand the source of contamination. For these applications, µXRF imaging proves to be advantageous.
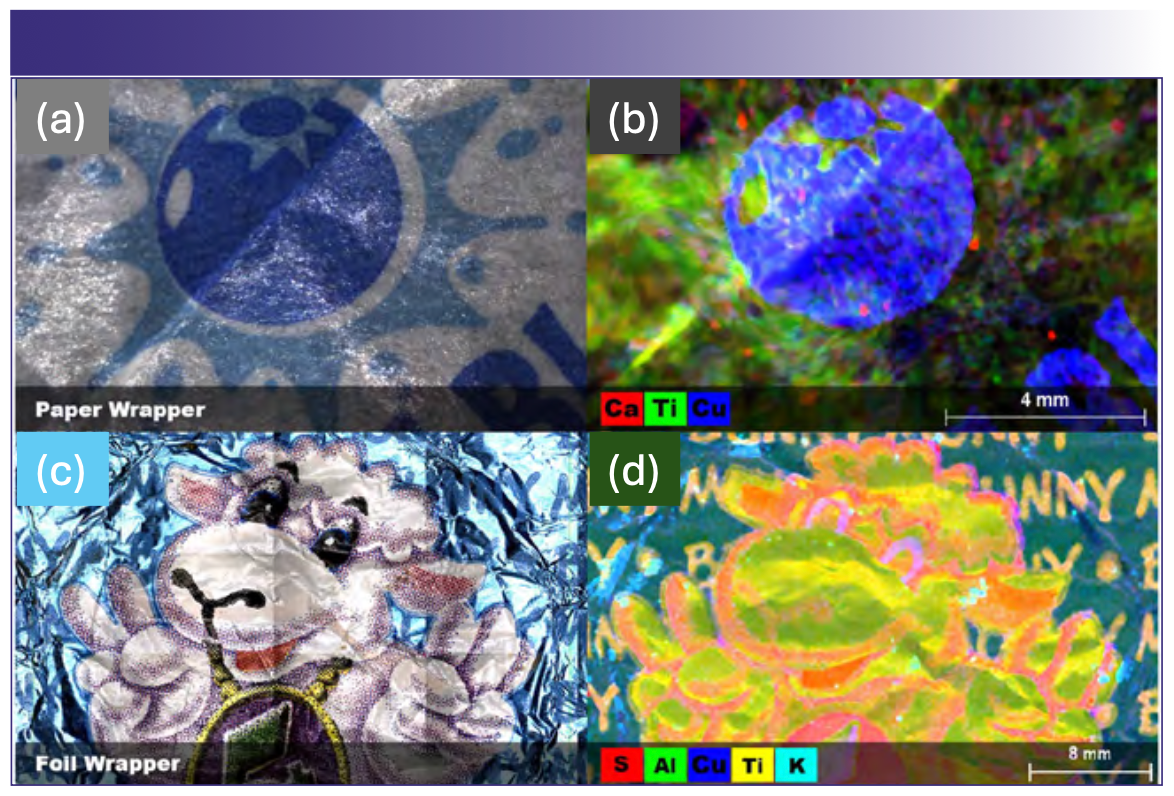
Packaging materials for two food items (candy) that are likely to be consumed by children were analyzed by µXRF (Figures 5a–5d). The first item was a hard candy lollipop with a wax paper wrapper, and the second was a chocolate holiday candy with a foil wrapper. In both candies, the use of metal containing pigments was readily identified based on the correlation between metal distributions and the printed images. In both candies, vivid blue colors correlate to copper distribution, suggesting the use of copper based pigments. Similarly, white colors correlate with titanium distribution, suggesting the presence of titanium(IV) oxide (titanium white), a ubiquitous white pigment. In the case of the foil wrapper, aluminum was distributed uniformly throughout, consistent with an aluminum foil base as expected (refer to Figure 5 for color codes). Fortunately, neither sample was found to contain pigments that might pose a high degree of risk such as lead chromate or cadmium yellow (cadmium [II] sulfide), but the relative ease of assigning elements with visual pigments makes µXRF imaging well suited to screening food packaging for potentially toxic elemental components, even in the case of the wax coated papers, which could prove challenging for other elemental imaging techniques such as scanning electron microscopy with energy dispersive X-ray spectroscopy (SEM-EDS).
FIGURE 5: Candy wrappers. Elemental pigments and packaging material in food packaging. (a) Visible light image of a lollipop wrapper; (b) element map of the lollipop wrapper; (c) visible light image of a foil wrapper from a holiday chocolate candy; (d) Element map of the foil wrapper.
Element Localization in Agricultural Plants
In conventional agricultural systems, crop yields are strongly affected by the availability of soil nutrient elements such as the macronutrients nitrogen, potassium, and phosphorus and various micronutrients such as calcium, iron, and manganese. Conversely, the presence of excess micronutrients or hazardous elements such as arsenic, lead, or cadmium may induce plant stress, reducing yields, and potentially rendering agricultural products unfit for consumption (12). Thus, a detailed understanding of the mechanisms that control elemental uptake and homeostasis is critical to maximizing crop yields and improving the sustainability of agricultural systems. Additionally, some plants show tolerance to elevated concentrations of potentially toxic elements and the ability to accumulate elevated concentrations, leading to growing interest in their application to phytoremediation of contaminated soils. From an economic perspective, identifying suitable species that efficiently accumulate elements of interest while still yielding usable biomass products or from which the elements can be recovered (“phytomining”), would significantly reduce the financial resources required to remediate contaminated sites. In each of these applications, the ability of µXRF imaging to provide information on the localization of elements within plant tissues can provide significant insights into the underlying mechanisms that affect element translocation and plant stress responses.
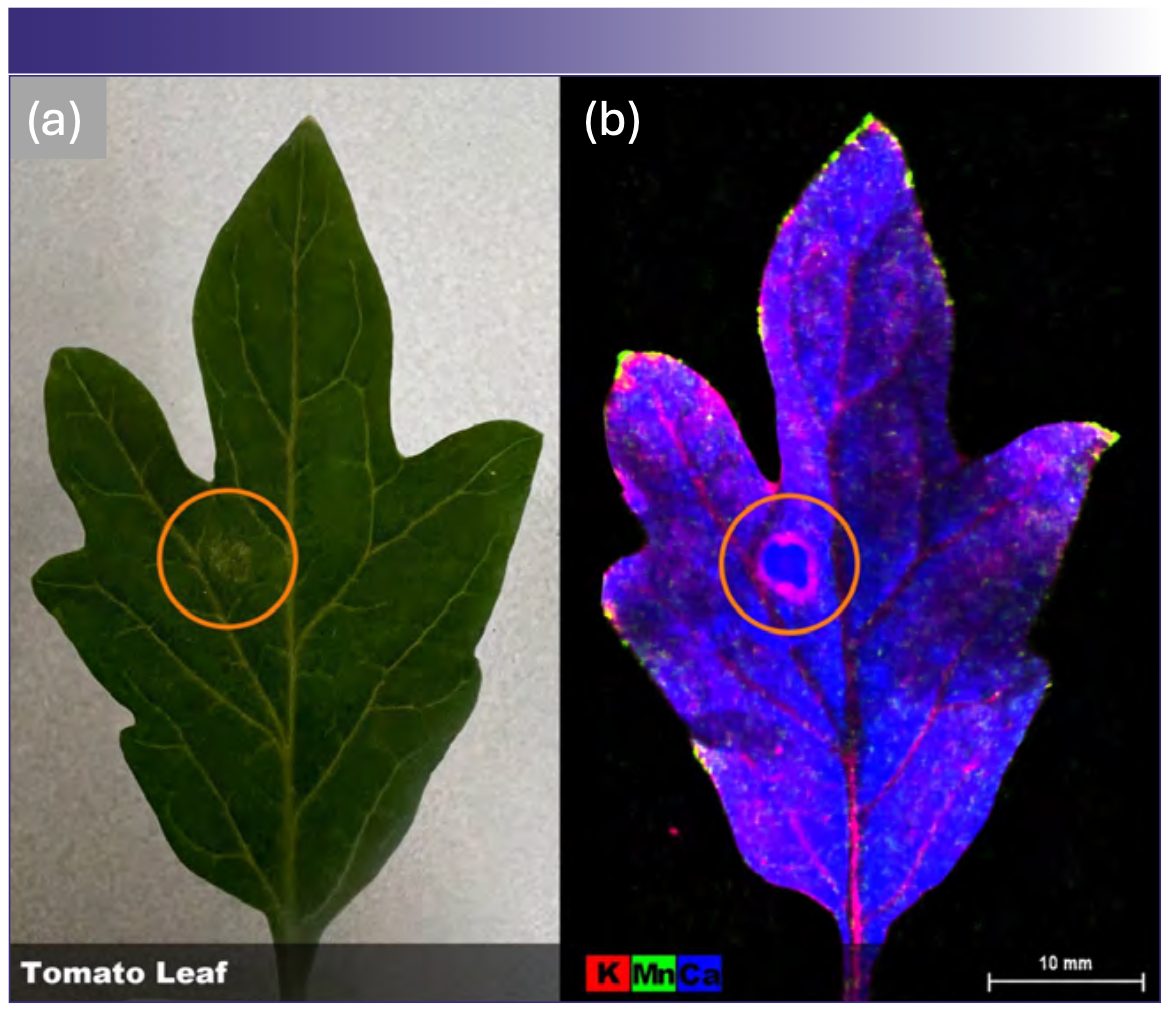
To investigate the distribution of key plant nutrient elements in juvenile tomato leaves, a freshly harvested leaf was analyzed by µXRF under atmospheric conditions (Figures 6a and 6b). Results showed that calcium (blue) was distributed throughout the leaf tissue, while potassium (red) was localized at higher concentrations within the veins. Conversely, manganese (green) was concentrated within the leaf tips and the margins. The leaf selected also contained a lesion (orange circle), with potassium concentrated at its margin, which suggests the involvement of potassium in plant response to tissue damage. Additionally, this data further demonstrates that caution must be used when using portable XRF instruments for in situ element monitoring, as the selection of analysis location may significantly impact results due to tissue localization.
FIGURE 6: Intact tomato leaf. (a) A freshly picked leaf compared to (b) the μXRF image of the same leaf demonstrates the distribution of three major plant nutrients: potassium, manganese, and calcium. The μXRF image also clearly demonstrates the mobilization and redistribution of nutrients in response to damage (circled in both [a] & [b].
Conclusion
The ability to perform high-resolution elemental imaging in the laboratory provides valuable data that can enhance food safety, improve product consistency, and deepen our understanding of elemental uptake and homeostasis in crops. By providing detailed insights into the elemental composition of food and agricultural products, µXRF supports efforts to enhance nutritional value, prevent contamination, and improve crop yields. As this emerging technology becomes more accessible to the fields of agricultural science, new and novel uses will continue to be developed. These applications will likely open currently unforeseen avenues of research and applications that improve the sustainability of agricultural systems.
Acknowledgments
Micro-XRF analysis was performed at the Micro Analysis and Spectroscopic Characterization (MASC) Lab at Lake Superior State University. The Bruker M4 Tornado Plus µXRF was acquired with funding from the National Science Foundation, NSF MRI Award #2320397.
References
- Feng, X.; Zhang, H.; Yu, P. X-Ray Fluorescence Application in Food, Feed, and Agricultural Science: A Critical Review. Crit. Rev. Food Sci. Nutr. 2021, 61 (14), 2340–2350. DOI: 10.1080/10408398.2020.1776677
- Tsuji, K.; Matsuno, T.; Takimoto, et al .New Developments of X-Ray Fluorescence Imaging Techniques in Laboratory. Spectrochim. Acta B: At. Spectrosc. 2015, 113, 43–53. DOI: 10.1016/j.sab.2015.09.001
- Mijovilovich, A.; Morina, F.; Bokhari, S. N.; Wolff, T.; Küpper, H. Analysis of Trace Metal Distribution in Plants with Lab-Based Microscopic X-Ray Fluorescence Imaging. Plant Methods 2020, 16, 1–21. DOI: 10.1186/s13007-020-00621-5
- St. Jeor, V. L; Muroski, A. R.; McGuire, C.; Lape, A. Micro-X-Ray Fluorescence in Food Forensics. In AIP Conference Proceedings 2011, 1365 (1), 411-414. American Institute of Physics. DOI: 10.1063/1.3625390
- Porfido, C.; Köpke, K.; Allegretta, I; et al. Combining Micro- and Portable-XRF as a Tool for Fast Identification of Virus Infections in Plants: The Case Study of ASa-Virus in Fraxinus ornus L. Talanta 2023, 262, 124680. DOI: 10.1016/j.talanta.2023.124680
- Ramos, I.; Pataco, I. M.; Mourinho, M. P.; et al. Elemental Mapping of Biofortified Wheat Grains Using Micro-X-Ray Fluorescence. Spectrochim. Acta B: At. Spectrosc. 2016, 120, 30–36. DOI: 10.1016/j.sab.2016.03.014
- Rizwan, M.; Ali, S.; Adrees, M., Ibrahim, M.; Tsang, D. C., Zia-ur-Rehman, M., ... & Ok, Y. S. A Critical Review on Effects, Tolerance Mechanisms and Management of Cadmium in Vegetables. Chemosphere 2017, 182, 90–105. DOI: 10.1016/j.chemosphere.2017.05.013
- U.S. Department of Health and Human Services, Food and Drug Administration, Center for Food Safety and Applied Nutrition. Arsenic in Rice and Rice Products Risk Assessment Report. May 13, 2014. revised March 2016.
- US FDA Investigation of Elevated Lead & Chromium Levels: Cinnamon Applesauce Pouches (November 2023) https://www.fda.gov/food/outbreaks-foodborne-illness/investigation-elevated-lead-chromium-levels-cinnamon-applesauce-pouches-november-2023 (accessed 2024-05-22)
- FDA Alert Concerning Certain Cinnamon Products Due to Presence of Elevated Levels of Lead. https://www.fda.gov/food/alerts-advisories-safety-information/fda-alert-concerning-certain-cinnamon-products-due-presence-elevated-levels-lead. (accessed 2024-05-22)
- Kim, K. C.; Park, Y. B.; Lee, M. J., Kim; J et al. Levels of Heavy Metals in Candy Packages and Candies Likely to be Consumed by Small Children. Food Res. Int. 2008, 41 (4), 411–418.DOI: 10.1016/j.foodres.2008.01.004
- Martínez-Ballesta, M. C.; Dominguez-Perles, R.; Moreno, D. A.; et al. Minerals in Plant Food: Effect of Agricultural Practices and Role in Human Health: A Review. Agron. Sustain. Dev. 2010, 30 (2), 295–309. DOI: 10.1051/agro/2009022
Derek Wright is a Professor of Environmental Science and is the Facility Coordinator of the Micro Analysis and Spectroscopic Characterization Laboratory at Lake Superior State University (Sault Ste. Marie, Michigan). He earned his PhD in 2008 from Rutgers University, and has expertise in both atomic and molecular spectroscopy, ICP-MS, XRF, SEM-EDS, and molecular techniques.

Mark Zierden is an Assistant Professor of Bioinorganic Chemistry at Lake Superior State University who specializes in plant uptake of elements and homeostasis. He earned his PhD in 2016 from Temple University and has expertise in both atomic spectroscopy and mass spectrometry.

Stephen Kolomyjec is an Associate Professor of Biology at Lake Superior State University who specializes in population genetics and imaging methods. He earned his PhD in 2011 from James Cook University and has expertise in genetic methods, molecular biology, zoology, electron microscopy, light microscopy, photography, and digital image analysis.

Benjamin Southwell is an Associate Professor of Bioanalytical Chemistry and is the Facility Coordinator of the Cannabis Center of Excellence at Lake Superior State University. He earned his MA in 2013 from Central Michigan University and has expertise in in both atomic and molecular spectroscopy, mass spectrometry, and molecular techniques.●


LIBS Illuminates the Hidden Health Risks of Indoor Welding and Soldering
April 23rd 2025A new dual-spectroscopy approach reveals real-time pollution threats in indoor workspaces. Chinese researchers have pioneered the use of laser-induced breakdown spectroscopy (LIBS) and aerosol mass spectrometry to uncover and monitor harmful heavy metal and dust emissions from soldering and welding in real-time. These complementary tools offer a fast, accurate means to evaluate air quality threats in industrial and indoor environments—where people spend most of their time.
AI Shakes Up Spectroscopy as New Tools Reveal the Secret Life of Molecules
April 14th 2025A leading-edge review led by researchers at Oak Ridge National Laboratory and MIT explores how artificial intelligence is revolutionizing the study of molecular vibrations and phonon dynamics. From infrared and Raman spectroscopy to neutron and X-ray scattering, AI is transforming how scientists interpret vibrational spectra and predict material behaviors.
Advancing Corrosion Resistance in Additively Manufactured Titanium Alloys Through Heat Treatment
April 7th 2025Researchers have demonstrated that heat treatment significantly enhances the corrosion resistance of additively manufactured TC4 titanium alloy by transforming its microstructure, offering valuable insights for aerospace applications.