Assay Robustness Improvement for Drug Urinalysis Using FAIMS and H-SRM on a Triple-Quadrupole Mass Spectrometer
Special Issues
This article demonstrates the improved robustness of a liquid chromatography–tandem mass spectrometry assay achieved by utilizing the combined selectivity of high-field asymmetric waveform ion mobility spectrometry and highly selective reaction monitoring.
When analysts develop liquid chromatography–mass spectrometry (LC–MS) methods, they use reference standards to establish initial conditions. Applying these initial conditions to real-world biological samples presents significant challenges, including reduced signal-to-noise ratio (S/N). Biological matrices add interferences and contribute to reduced method selectivity. Bioanalytical scientists have many tools to solve selectivity problems that arise during method development. The three common classes of tools include MS, LC, and sample preparation.
The easiest approach to increasing selectivity is changing the MS parameters. On triple-quadrupole mass spectrometers, changing parameters such as the ion-entrance voltages or m/z transitions might result in reduced sensitivity without an increase in selectivity. The only MS parameter that offers increased selectivity without significant loss in sensitivity is highly selective reaction monitoring (H-SRM). H-SRM results from the hyperbolic cross-section of the mass spectrometer's quadrupoles.
The selectivity of the LC method can also be increased by changing the mobile phase (gradient, modifiers) or the stationary phase. These adjustments lead to the altering of all the associated method parameters (integration retention time window, column equilibration time, and so forth), making this a time-consuming endeavor. Modification of sample preparation procedures may include choosing between solid-phase extraction (stationary phase, wash and elution solvents), liquid–liquid extraction (extracting solvent, buffers), or simple solvent addition (protein precipitation, dilute-and-shoot). Revisiting sample preparation wastes time and resources because the samples are already prepared and available for analysis.
High-field asymmetric waveform ion mobility spectrometry (FAIMS) is a new tool for increasing LC–MS method robustness. The technique separates gas-phase ions at atmospheric pressure. Desolvated ions enter the annular region between two concentric cylindrical FAIMS electrodes and are transported toward the mass spectrometer's entrance via a flow of clean, dry gas. Within the gas-filled region of the electrodes, the ions oscillate as a result of a waveform causing alternating high and low electric fields. The waveform is asymmetric; the high field is applied for one time unit followed by an opposite-polarity low field component applied for twice as long. Separation of ions during the two opposite polarity phases of the waveform is caused by behavior differences of the ions under the high- and low-field conditions.
Over time, ions travel toward one or the other electrode. A low dc voltage compensates for this migration, resulting in a select ion subset being transmitted into the mass spectrometer. The magnitude of the so-called compensation voltage (CV) is compound dependent. Ions requiring a different CV for transmission are removed from the ion beam; thus, selectivity is achieved. The CV can be set to a constant value or stepped during an LC–MS run to coincide with the elution of specific analytes. High analyte transmission efficiency is achieved with this increase in selectivity by means of a unique ion-focusing mechanism arising from the cylindrical geometry of the FAIMS electrodes.
This article describes the advantages of using LC, FAIMS, and H-SRM to improve bioanalytical robustness, using norverapamil in human urine as an example.
Experimental Conditions
Chemicals and reagents: Norverapamil hydrochloride and verapamil hydrochloride were purchased from Sigma-Aldrich (St. Louis, Missouri). HPLC-grade methanol and formic acid were acquired from VWR (Mississauga, Canada). All chemicals were used as received.
Sample preparation: A 25-mL volume of human urine was fortified with analyte and internal standard to a final concentration of 100 pg/mL. This stock solution was treated with 75 mL of 0.1% formic acid in water. The resulting solution (25 pg/mL) was analyzed directly.
Sample analysis: HPLC analyses were performed on a Finnigan Surveyor HPLC system (Thermo Electron). Samples were injected onto a 50 mm × 2.1 mm embedded polar group reversed-phase column. The injection volume was 10 μL. The gradient LC method used mobile phases A (0.1% formic acid in water) and B (70:30:0.1 methanol–water–formic acid) at a flow rate of 0.4 mL/min. The gradient was as follows (time, %B): (0, 10) (3, 100) (4, 100) (4.1, 10) (5, 10). The entire LC effluent from the sample injections was directed to the Ion Max source on a TSQ Quantum Ultra mass spectrometer (Thermo Electron).
MS conditions:
- Ion source and polarity: H-ESI, positive ion mode
- Spray voltage: +3000 V
- Vaporizer temperature: 350 °C
- Sheath gas: Nitrogen, 60 psi
- Auxiliary gas: Nitrogen, 40 psi
- Transfer tube temperature: 300 °C
- Transfer tube offset: 35 V
- Tube lens offset: 110 V
The transitions monitored were m/z 441.25 to m/z 165.10 for norverapamil and m/z 455.25 to m/z 165.10 for verapamil, each at a collision energy of 26eV and scan time of 100 ms. The MS selectivity was regulated by setting Q1 resolution to a peak width of either 0.7 or 0.2 u full-width at half maximum (FWHM).

Figure 1
Additional gas-phase separation before entry of ions into the mass spectrometer was achieved by including FAIMS in the analysis.
FAIMS conditions:
- Dispersion voltage: –4500 V
- Outer bias voltage: 35 V
- Compensation voltage: –16 V
- Tinner electrode: 40 °C
- Touter electrode: 50 °C
- Gas flow rate: 2.5 L/min
- Gas composition: 50% helium in nitrogen
Results and Discussion
A representative LC–SRM chromatogram for the analysis of norverapamil in human urine collected using unit mass resolution (0.7 u in both Q1 and Q3) is shown in Figure 1.
Although LC–MS-MS is a selective technique, many isobaric interferences appear in the chromatogram. These isobaric interferences increase the chemical background and may make reproducible integration of the analyte peak difficult.
A representative LC–H-SRM chromatogram (0.2 u in Q1) is shown in Figure 2. H-SRM has removed most of the interferences.
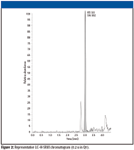
Figure 2
An even further increase in selectivity is achieved by utilizing FAIMS and H-SRM in the LC–MS-MS analysis. Implementing FAIMS requires the establishment of conditions for the transmission of the desired analytes through the interface. Stable conditions for ion transmission are expressed by the CV. Figure 3 shows a CV scan during infusion of a norverapamil reference standard. The CV was ramped from 0 to –30 V in 1.5 min. The maximum response for norverapamil occurred at –16 V and indicated the appropriate CV for LC–FAIMS–H-SRM analysis. The structure of norverapamil is shown in the inset.
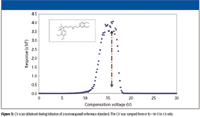
Figure 3
Figure 4 shows a representative LC–FAIMS–SRM chromatogram for norverapamil in human urine. For this chromatogram, the FAIMS CV was set to –16 V. A comparison of this chromatogram with Figure 2 shows that these two techniques eliminated different interferences. Next, the combined selectivity of FAIMS and H-SRM was explored.
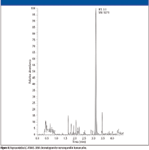
Figure 4
To acquire an LC–FAIMS–H-SRM chromatogram for norverapamil in human urine, the FAIMS CV was set to –16 V and Q1 peak width was set to 0.2 u. A representative LC–FAIMS–H-SRM chromatogram for the analysis of norverapamil in human urine is shown in Figure 5. The combined selectivity offered by FAIMS and H-SRM results in a cleaner chromatogram than the corresponding trace in Figures 1, 2, and 4. Very few interferences are transmitted. Although a factor of three was lost in absolute signal, the "assay sensitivity," as defined by S/N, has increased five fold.
Because complex biological samples are sprayed directly at the FAIMS interface, the robustness of the FAIMS-enabled system was evaluated. Figure 6 shows peak areas resulting from samples of norverapamil in urine injected every 5 min over a three-day period. The %RSD for the analyses was 6.4%.
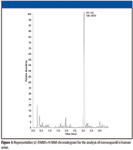
Figure 5
Conclusions
The increases in selectivity offered by the combination of FAIMS and H-SRM result in improved assay robustness. The cleaner chromatograms are more easily and more reproducibly integrated. For the analysis of norverapamil in urine, the new method was developed without having to revert to modification of the LC method or sample preparation steps. The use of LC–FAIMS–H-SRM over LC–SRM reduced the chemical background and produced a fivefold increase in assay sensitivity.
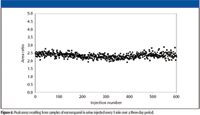
Figure 6
Jim Kapron is a strategic marketing specialist at Thermo Electron Corporation, Scientific Instruments Division, based in Ottawa, Ontario, Canada. E-mail: james.kapron@thermo.com
Other Reading
(1) J.T. Kapron, M. Jemal, G. Duncan, B. Kolakowski, and R. Purves, Rapid Commun. Mass Spectrom. 19, 1979–1983 (2005)
High-Speed Laser MS for Precise, Prep-Free Environmental Particle Tracking
April 21st 2025Scientists at Oak Ridge National Laboratory have demonstrated that a fast, laser-based mass spectrometry method—LA-ICP-TOF-MS—can accurately detect and identify airborne environmental particles, including toxic metal particles like ruthenium, without the need for complex sample preparation. The work offers a breakthrough in rapid, high-resolution analysis of environmental pollutants.
Trending on Spectroscopy: The Top Content of 2024
December 30th 2024In 2024, we launched multiple content series, covered major conferences, presented two awards, and continued our monthly Analytically Speaking episodes. Below, you'll find a selection of the most popular content from Spectroscopy over the past year.