Auger Spectroscopy
Some forms of spectroscopy involve actions other than measuring a property of light. In the case of this form of spectroscopy, the energies of emitted electrons are measured.

Some forms of spectroscopy involve actions other than measuring a property of light. In the case of this form of spectroscopy, the energies of emitted electrons are measured.
In 1923, Austrian physicist Lise Meitner reported on the emission of electrons from atoms that were bombarded with other electrons (1). In 1925, French physicist Pierre Auger reported the same effect, and correctly attributed it to an excited-state atom that is giving off energy by releasing an upper-quantum state electron (2). Because the energies of these electrons are element-specific, it forms the basis of a type of spectroscopy. Auger spectroscopy was born. (Once again, Meitner is shut out. Many science historians believe that she should have shared Otto Hahn's 1944 Nobel Prize in chemistry for the discovery of nuclear fission. The use of "Auger" to name this form of spectroscopy is thus another example of an instance where Meitner might not be getting the credit she deserves.)

David W. Ball
Auger (pronounced "oh-ZHAY") spectroscopy can be considered a form of X-ray photoelectron spectroscopy (XPS) (3), at least in one of its guises. For about 30 years after its formal discovery, it actually was thought of as a nuisance in the performance of XPS. However, since the 1950s, technology has advanced to be able to take advantage of the effect as a separate spectroscopic technique (4).
How It Works
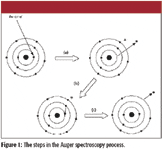
Figure 1 shows a schematic of the steps involved in the Auger effect. In step (a), an incoming energy source, which can be a beam of electrons or X-rays, knocks out a core electron (that is, an electron relatively close to the atomic nucleus). This creates an electronically excited atom, as indicated by the asterisk in the right side of step (a). Step (b) shows that an electron from an outer orbital moves down to fill the hole that the first electron left. This still leaves the atom electronically excited. The atom loses this additional energy by emitting an X-ray photon or ejecting an electron from an even higher shell with whatever excess kinetic energy is necessary, leaving behind a (temporarily) 2+ -charged ion, as shown in step (c).

Figure 1
The kinetic energy of the ejected electron, KE, can be approximated by the energy levels of the original electrons involved:

where E1, E2, and E3 are the original energies of the first core electron, the second electron that moves down, and the third electron that gets ejected, respectively. There is supposed to be a correction for the third energy, because it is actually an energy of the ion, not the atom, but these are usually ignored. Because three electrons are involved, Auger spectroscopy is not used to detect hydrogen or helium but can be utilized for any heavier element. Because the energy levels of the elements typically are well-known, Auger spectroscopy can be used to determine the elemental analysis of a sample, either by analysis of the X-rays emitted or the electrons emitted. Because a free electron will not travel a large distance in a solid, Auger spectroscopy is largely a surface technique, allowing users to probe the chemical composition of a surface.
As the atomic number of the elements being analyzed increases, so do the number of possible transitions, suggesting that Auger spectra get hopelessly complicated for larger elements. However, experience shows that most elements show only a few strong signals in their Auger spectra, dominated by transitions between the 1s, 2s, 2p, and occasionally the n = 3 shells.
Instrumentation
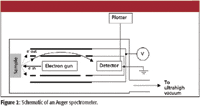
Because Auger spectroscopy is sensitive to the outer layers of a sample, samples must either be very clean or (more usually) be cleaned and then examined in an ultrahigh vacuum (<10–9 mm Hg pressure) environment. Schematically, an Auger spectrometer is straightforward. An electron gun utilizing a tungsten filament, a lanthanum hexaboride tip, or a field emission gun source is aimed at the sample and emits electrons. Electron focusing optics might also be present, especially for techniques that attempt a fine spatial resolution of the sample. The Auger electrons are detected by an electron detector, which scans the kinetic energies of the electrons and records output to a detector. Figure 2 shows a diagram of a modern Auger spectrometer. To measure the number of electrons emitted versus their kinetic energy, most Auger spectrometers use a cylindrical mirror analyzer (represented by the darker lines in Figure 2) that varies a potential on some concentric cylindrical electrodes, the inner of which has several apertures in it to allow only electrons of a certain kinetic energy to pass at any certain voltage.

Figure 2
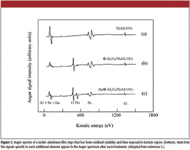
Because many electrons, not just Auger electrons, are scattered as part of a measurement, the electron detector actually detects a nonzero background noise level. Auger spectra are plotted in derivative mode, much like electron spin resonance (ESR) spectra, to better emphasize the slight variations in the signal. Some spectra are also mathematically manipulated to emphasize the Auger signal over the background noise, for example by multiplying the energy of the Auger electron by its intensity and then taking the derivative. A typical Auger spectrum is shown in Figure 3.

Figure 3
According to Losito and colleagues (6), Auger spectra also can be recorded using two different X-ray excitation sources. Because the kinetic energies of the ejected electrons are not dependent upon the energy of the excitation source, Auger spectra will have the same relative spacing of lines and can be recognized easily by superimposing the two different spectra.
Auger spectroscopy was once considered a nuisance in X-ray photoelectron spectroscopy. In the past 50 years, however, it has developed into a useful technique in its own right, providing important surface information for scientists and engineers exploring a wide range of interfacial science.
David W. Ball is a professor of chemistry at Cleveland State University in Ohio. Many of his "Baseline" columns have been reprinted in book form by SPIE Press as The Basics of Spectroscopy, available through the SPIE Web Bookstore at www.spie.org. His most recent book, Field Guide to Spectroscopy (published in May 2006), is available from SPIE Press. He can be reached at d.ball@csuohio.edu; his website is academic.csuohio.edu/ball.
References
(1) L. Meitner, Z. Physik 17, 54 (1923).
(2) P. Auger, Compt. Rend. 180, 65 (1925).
(3) D.W. Ball, Spectroscopy 18(11), 36 (2003).
(4) D.F. Stein, Chapter 1 in Auger Electron Spectroscopy, C.L. Briant and R.P. Messmer, Eds. Treatise on Materials Science and Technology, vol. 30 (Academic Press, Boston, 1988).
(5) E. Ozensoy, C.H.F. Peden, and J. Szanyi, J. Phys. Chem. B 110, 17001–17008 (2006).
(6) I. Losito, L. Sabbatini, and J.A. Gardella Jr., Chapter 16 in Comprehensive Desk Reference of Polymer Characterization and Analysis, R.F Brady, Jr., Ed. (Oxford University Press, Oxford, 2003).

New Study Reveals Insights into Phenol’s Behavior in Ice
April 16th 2025A new study published in Spectrochimica Acta Part A by Dominik Heger and colleagues at Masaryk University reveals that phenol's photophysical properties change significantly when frozen, potentially enabling its breakdown by sunlight in icy environments.