Can We Simplify Data Process Mapping?
Data process mapping is an effective way to identify data integrity vulnerabilities and remediate them. A modified example published by the Active Pharmaceutical Ingredients Committee (APIC) is reviewed critically. Can it be simplified?
Regulatory authorities expect that laboratories assess their manual processes and computerized systems to identify and remediate any data integrity vulnerabilities and risks. This approach is mentioned in the Medicines and Healthcare Products Regulatory Agency (MHRA) (section 3.4) and the Pharmaceutical Inspection Co-operation Scheme (PIC/S) (in section 9.1.6) guidance documents (1,2). Typically, this assessment can be performed in one of two ways—either by using a checklist or data process mapping.
MHRA guidance goes into specifics (1):
3.4 … An example of a suitable approach is to perform a data integrity risk assessment (DIRA) where the processes that produce data or where data is obtained are mapped out and each of the formats and their controls are identified and the data criticality and inherent risks documented.
What happens if you don’t do a DIRA? The PIC/S Guidance describes data integrity deficiencies in Section 11.2.3 (2) as:
- Data integrity failure resulting from bad practice,
- Opportunity for failure (without evidence of actual failure) due to absence of the required data control measures.
An example of the first is sharing user identities so that an action cannot be attributed to an individual. The second is more interesting—you have not done anything wrong, but there are no controls in place to prevent an analyst from doing a wrong action, such as, for example, user access to data and the system clock via the operating system. It is the possibility that an analyst could do something that is preventable. Take note! Are you sure you have all necessary controls in place over the data lifecycle?
To undertake these assessments, organizations have published guidance documents (3–9). We review the second version of the APIC Practical Risk-based Guide for Managing Data Integrity Methodology for assessing systems and processes (9). This is a good guide, and, as the name suggests, it is very practical because it provides examples related to good and poor system and process design.
In this column, we do the following:
- Review critically a modified data process mapping from APIC’s Guide Section 9.2 (9),
- Provide some details omitted from the APIC approach, and
- Suggest a simpler way to conduct a DI data process mapping and remediation.
Where’s the Inventory?
Before we start, my assumption is that your organization has an inventory of computerized systems and manual processes. Each entry is classified for data criticality (the process, data generated, and potential impact on the patient), which determines the priority order of assessment and remediation. You have an inventory, haven’t you?
In addition, management must support both business and data mapping assessments and remediation by providing the resources for this work. If they don’t, perhaps you might like to show them my column on understanding the cost of non-compliance (10), or simply ask they if they look good in orange?
Checklist or Data Process Mapping?
Before delving into the details of a way of data process mapping, another method is a checklist to identify data integrity vulnerabilities. A comparison of the two approaches is shown in Table I. Data process mapping is more flexible, and it is also applicable to manual processes because the checklists focus only on computerized systems.


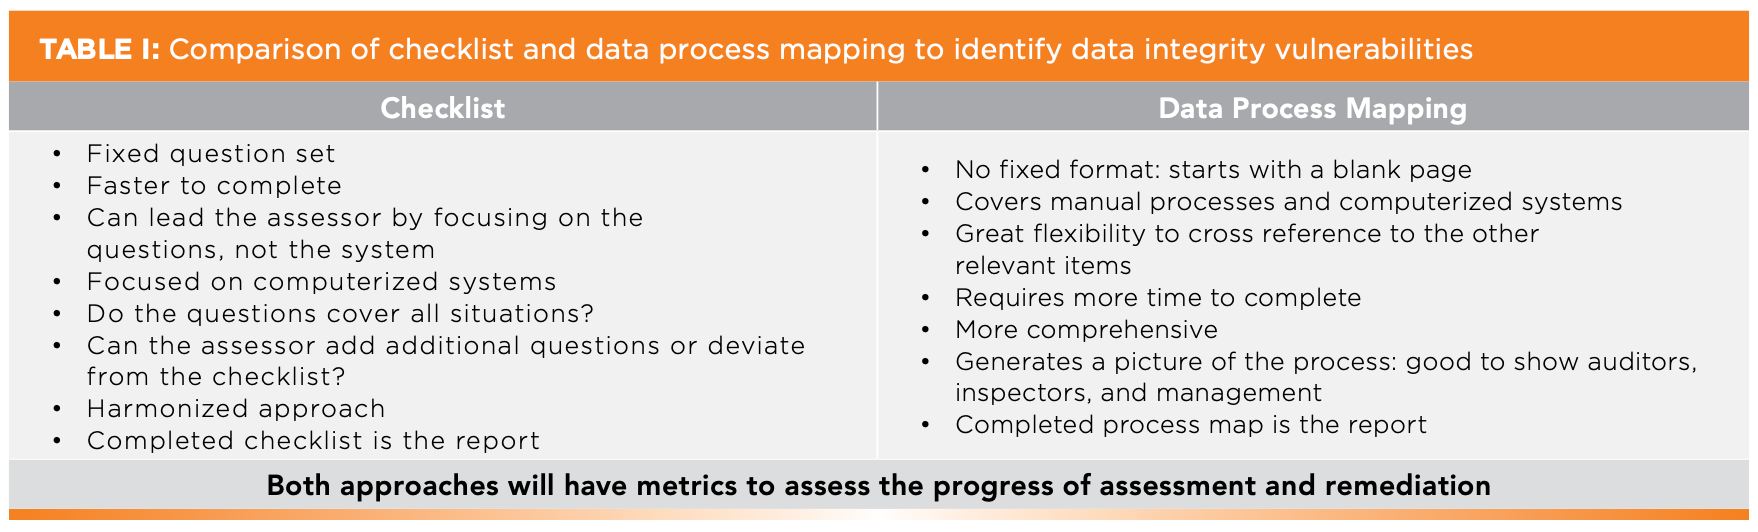
Regardless of the methodology, both take time and require trained staff to be involved. Therefore, management must ensure that adequate time is available to perform these assessments and remediate any data integrity vulnerabilities. Please avoid implementing just procedural solutions with analyst training. These are just temporary, error-prone sticking plasters to await automation of a manual process or replacement of a deficient system.
APIC Methodology
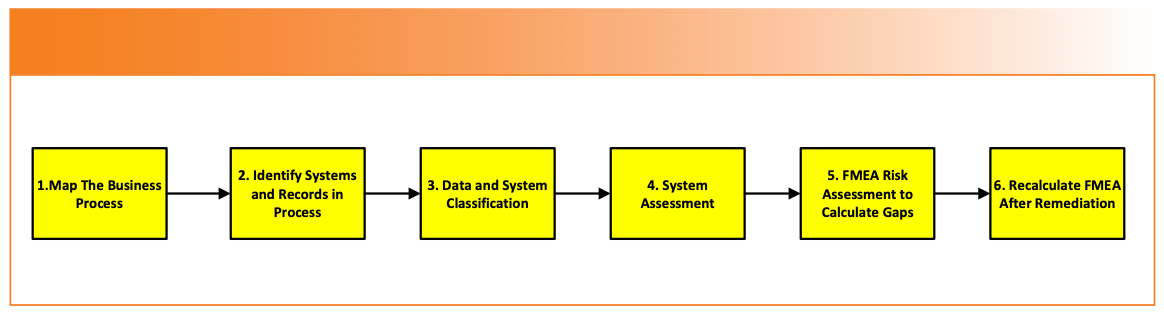
The APIC data process mapping methodology consists of six stages, and is shown in Figure 1:
- Map an analytical process, identifying the steps involved from sample management to generation of the reportable result.
- When the map is complete, identify where any analytical instruments and computerized systems (including spreadsheets!) are involved. Then, identify all records generated against each process step.
- Classify the records and systems into one of the six categories provided in the guide.
- Assess the controls and identify the vulnerabilities for all records, instruments, and systems.
- Input the vulnerabilities into a Failure Mode Effects Analysis (FMEA) spreadsheet to select the most important ones for remediation.
- After remediation, repeat the assessment to see if the residual risk is acceptable or not.

.")
FIGURE 1: The APIC data process mapping methodology (9).
The guide provides a working example of a QC process in Section 9.2 of a quantitative analysis using an analytical balance, an ultraviolet–visible (UV-vis) spectrometer system to calculate the results, which are entered manually into a laboratory information management system (LIMS) (9). It provides a spreadsheet for completed FMEAs before and after remediation.
The process steps are:
- Sample preparation involving an analytical balance configuration is locked and segregated from the users.
- The spectrometer is standalone, and it is not connected to a network.
- A raw data sheet (RDS) is used to record the work.
- The reportable results are typed into a LIMS.
APIC Process Modifications
In the APIC process, the LIMS and balances are out of scope of the assessment. I have included them for completeness because you must always map the entire process. If the balance and LIMS were covered in separate process mapping exercises, the work should be cross referenced in this assessment. I have also modified the APIC example as follows:
- In APIC, the spectrometer software calculated the result. This is boring, so I have modified the process to simply measure the absorbance at specific wavelength and print measurements from the system.
- All spectrometer users share a single logon: cowboy time!
- To make life more entertaining, the absorbances are then typed into a validated spreadsheet. Well, you would, wouldn’t you?
- LIMS data entry is included to enable a complete second person review of the whole process.
Process and System Classification
We’ll start the review by looking at the APIC classification of processes and systems, which are divided into six categories (Table II). I have edited the description to focus on the laboratory.


Some critical comments:
- Category 1: I hate to admit, but last time I used a pH paper was in the 1970s! However, the list should also include paper records such as an instrument logbook and the master analytical batch record or blank raw data sheet (RDS) as used in the Guide. The phrase “No GXP data are stored” should be modified to “GXP data are recorded manually.”
- Category 2: As an auditor, using an analytical balance and recording the weight by observation is a critical finding. In my view, no objective evidence for such a critical instrument is a data integrity violation.
- Category 3: Here, the balance has a printer attached to document the work. That’s great, but there is no mention that modern balances also have user accounts in the firmware. A user should have a unique user log on that is automatically transferred to the printout along with the date and time. As noted by APIC, the balance is locked and users cannot access the configuration. Failure to implement this would be an opportunity for failure under PIC/S PI-041 (2), as discussed earlier.
I have no comments about the remaining categories, except that I would add spreadsheets to category 6.
Data Process Mapping Example
Section 9.2 of the APIC guide has been modified, as mentioned earlier, to include a transcription check of the result to LIMS, comply with Annex 11 clause 6 (11), and incorporate electronic signatures by the analyst and second person reviewer. The modified workflow is shown in Figure 2. Implicit in the data process mapping is to ensure that applicable ALCOA++ criteria are met (12).


FIGURE 2: A modified APIC QC data process mapping example.
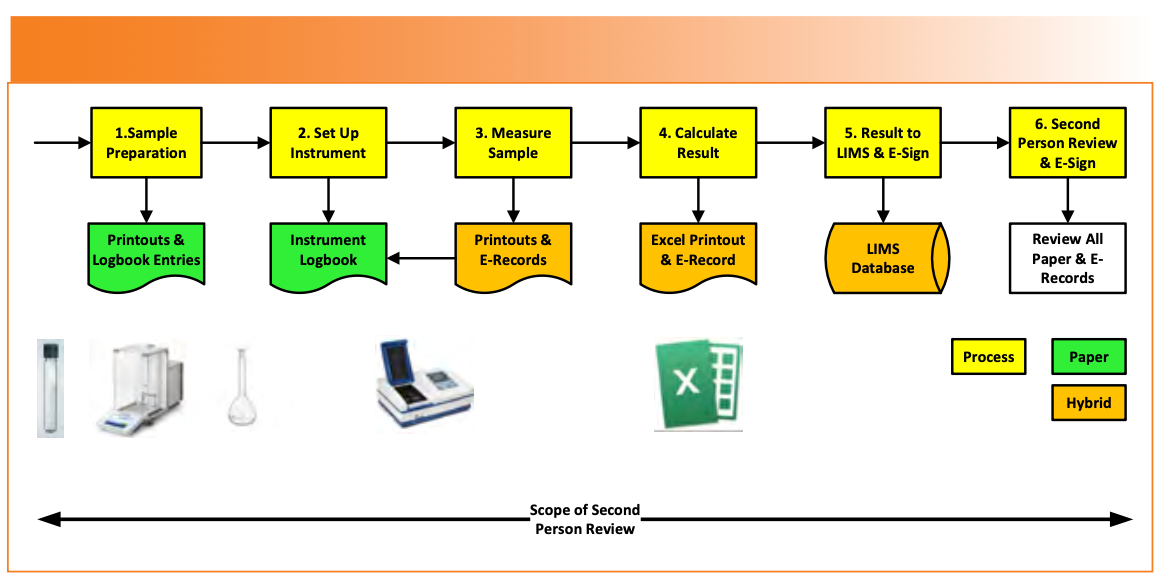
The data process mapping of the analytical process is divided by APIC into four phases [9]:
(1) Sample preparation
(2) Instrument set up and analysis
(3) Result calculation and entry into LIMS
(4) Second person review of analytical records.
Phase 1: Sample Preparation
The overall process is shown in Stage 1 of Figure 2.
- A raw data sheet (RDS) is used to record work. This must be a controlled document that is uniquely numbered and bound to prevent page substitution, unlike a recent 483 observation where analysts could reprint a page of a batch record simply by scanning a QR code (13). Isn’t it good to know that technology can automate data falsification?
- The RDS will be used to manually record the serial numbers of the volumetric glassware used. Any reagents, buffers, and solvents used will have reference to the batch and preparation details. The balance ID needs to be recorded on the RDS.
- The analytical balance as mentioned earlier is critical but not discussed in depth by APIC, as user accounts and access privileges are not defined and maintained.
- Do the printouts have the analysts name and correct time and date stamp on them from the log in, or are they written when the work is complete? The original printouts should be stuck onto the RDS as required by PIC/S PI-041 section 8.9 (2).
- The balance printout must have the full sequence of weighing actions, such as check masses vs. acceptance criteria, standard information with vessel weight, tare weight, and weight of the standard. A similar approach is required for sample weights.
What is missing from this description? The balance logbook! This is a specific requirement under Chapter 4.31 (14) and 21 CFR 211.182 (15). Moreover, a logbook is a critical component of data integrity correlating work performed and documenting the sequence of user actions (16). Oops!
Phase 2: Instrument Setup and Analysis
Let’s look at the set up and analysis performed using the UV-vis spectrometer and start with some initial checks (stages 2 and 3 in Figure 2):
- Is the system validated and the configuration settings documented? Yes, excellent!
- Are user roles defined and all users have unique IDs? No! All users share a single account with administrator privileges. No attribution of action. Oh, dear.
- Users can access to the data files via the operating system, the system clock, and the recycle bin. Remember the PIC/S rationale for a deficiency (2)?
- The system is used as a hybrid (signed paper printouts with electronic records), which is the worst situation to be in because two incompatible media formats must be managed and synchronized over the record retention period. PIC/S PI-041 section 9.10 also discourages the use of hybrid systems and recommends their replacement (2).
- Electronic records are manually backed up by the users when they have the time, using a USB device and copy and paste. The final nail in the coffin is that backup is a secondary QC activity, and typically, analysts never have the time to perform it. This should be an automatic function managed by IT; connecting a standalone system to a network is a simple task.
Not the brightest start to the assessment of this phase of the process.
On the plus side, the instrument setup and use is good with instrument methods named for easy identification, and data files are automatically saved by system along with a procedure for file naming. Printouts are linked to the data file name and associated metadata, such as the method used.
However, the instrument logbook has been omitted from the APIC example— AGAIN! I want to reiterate the importance of this apparently mundane and forgettable document; it allows correlation between instrument printouts, e-records in the data system, and logbook entries. Put simply, if all three are congruent, it is an indication that the correct processes have been followed, and that they are consistent and traceable.
Phase 3: Result Calculation and Entry to LIMS
In a deviation from the APIC example, measurements from the UV spectrometer printouts are typed into a validated Excel template, which is good, but it is another hybrid system (stages 4 and 5 in Figure 2). However, the data process mapping identifies the following problems:
The completed spreadsheet file is saved, but there is no file naming convention or specific storage location defined. Therefore, a user can save the file on a local or network drive. Be warned that auditors and inspectors search local drives for files with .xlsx and similar file extensions. Insert a big smiley face emoji.
The results are printed, but there is no link to spreadsheet file which fails record signature linking 21 CFR 11.70 (17) and PIC/S PI-041 section 9.5.2, correlating hybrid records for completeness (2).
As a result, there is a failure of ALCOA++ criteria because the records are not consistent or traceable (18,19).
The analyst then enters the individual determinations and reportable value into the LIMS, where they are compared with the specifications, and, if within the limits, the analyst e-signs the result.
Phase 4: Second Person Review
This phase of the process is both a scientific necessity and regulatory imperative to comply with 21 CFR 211.194(a) (15) and GMP Chapter 6.17vii (20), and it is stage 6 in Figure 2. It consists of a detailed review of all paper and electronic records from sampling to reporting to ensure the work was performed correctly, procedures were followed, results are not selected, data are not falsified, and any deviations are recorded and investigated.
- The analysis of the second person review reveals that most work is performed correctly, with one or two problems.
- The audit trail of the spectrometer is printed to paper and reviewed manually; each page is initialed and dated by the reviewer.
- The spreadsheet printout is checked against the spectrometer printouts and signed by reviewer, but the electronic file was not reviewed (probably as it can’t be found?).
- The reviewer initials all paper records as evidence of review and then e-signs the result in LIMS.
Ideally, each software application should have a function to document AT review electronically without the need to print or have paper checklists. However, few applications have this option in the laboratory. If the audit trail does not have an adequate search function or can highlight changes (21), either review on screen or print to PDF.
Audit Trail Review Case Study
The system has limited functionality, and only a specific user role called Level 90 can change data. Otherwise, the audit trail just records the functioning of the system.
- Before: Owing to a lack of search facility, the audit trail is printed (circa 70–150 pages). The lucky user must initial and date each page; don’t you just love the sadists in QA? Now the even luckier reviewer must trawl through each page looking to see if a Level 90 user has logged on. Naturally, the chosen one must initial and date each page to document their review, providing they have not expired because of extreme boredom. The review is slow, laborious, error prone, and takes a minimum of two hours.
- After: The audit trail is printed not to paper, but to the PDF. It can be saved with a batch-related file name. Open the file, press Control F and enter Level 90 into the search function and if nothing is found. Job done! Total time two minutes. If there is such a user role, check if any changes have been made.
To be contentious, why do you need to keep the PDF file since the original records are in the audit trail? The printing to PDF can be repeated at any time as the original records remain in the audit trail.
Summary of DI Vulnerabilities
The data process mapping has found several data integrity vulnerabilities or poor practices as collated in Table III. Each one is classified as:
- Non-compliance against a regulatory requirement
- A potential non-compliance as per PIC/S PI-041 section 11.2.3 (2); there is no evidence of data deletion or time traveling but there is the potential for this
- Inefficient business process


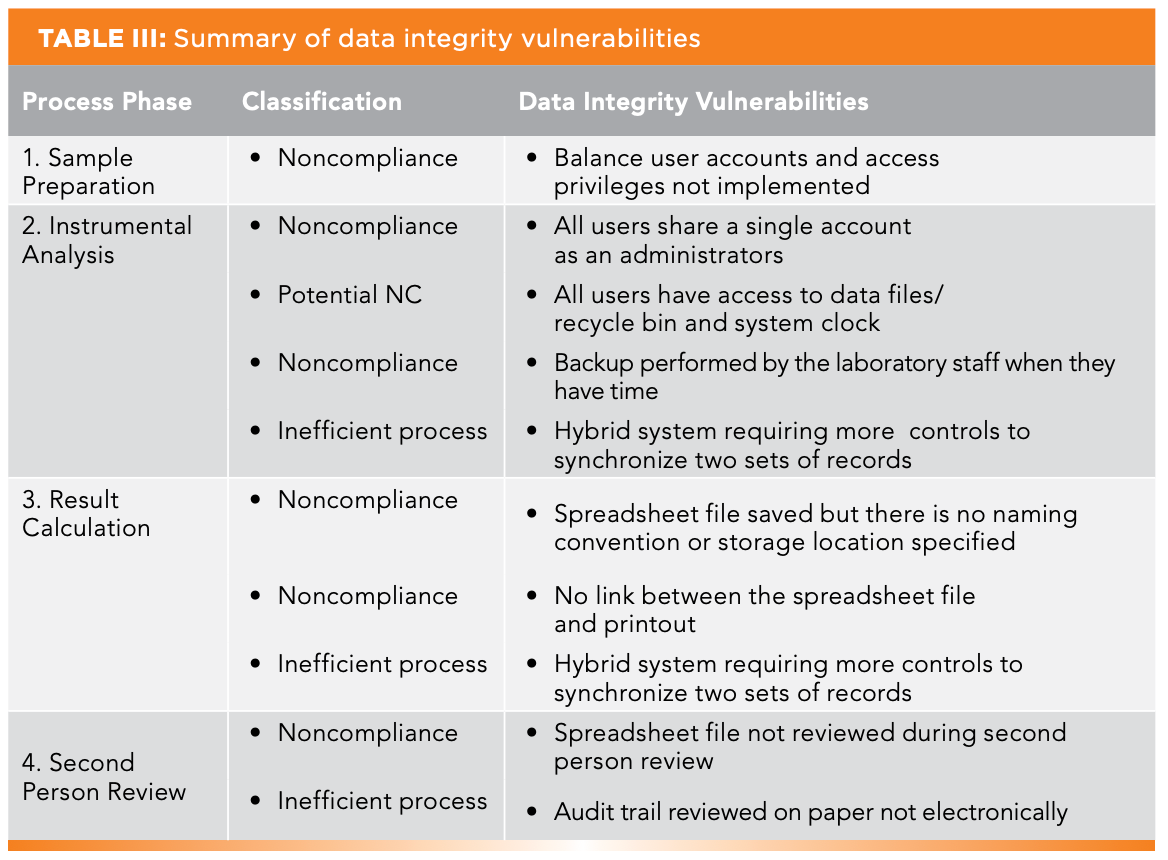
The last one is of interest because this is typically not covered in a checklist, but it is obvious when conducting data process mapping. The business process must be improved in three places for business efficiently and eliminate data vulnerabilities:
- Printing an audit trail to paper and reviewing the entries is very inefficient, as discussed earlier.
- The two hybrid systems require more management of the two incompatible record media.
- Can the spreadsheet be eliminated by incorporating the calculations into the spectrometer system or LIMS?
- Can the manual entry to LIMS be eliminated by connecting the spectrometer to the network and exporting the results to LIMS?
Incorporation of technical rather than procedural controls is one of the improvements listed for the update of Annex 11 for computerized systems (22).
Now, we must consider what to do. The APIC process flow in Figure 1 shows an FMEA risk assessment should be conducted, BUT before starting down this road, let us take a value-added detour and see what ICH Q9(R1) on Quality Risk Management (23) says.
ICH Q9(R1) to the Rescue!
ICH Q9(R1) for Quality Risk Management has been recently updated and section 5.1 is entitled Formality for QRM Documentation (23), and argues that not all situations require a formal risk assessment. The three determining factors for a such decision are uncertainty, importance, and complexity.
Let’s see how the three criteria match up with the non-compliances listed in Table III; we’ll take the problem of shared user identities in the UV-Vis spectrometer.
- Uncertainty: None. There is no attribution of action.
- Importance: High. The following GMP requirements are not met: Chapter 4.9, 4.21c (14), Chapter 6.17 (vi, vii & viii) (209), and Annex 11 12.1 & 12.4 (11), not to mention a slew of 21 CFR 11 and 21 CFR 211 violations (15,17)
- Complexity: Low. You have been lazy, and you have not implemented user roles and access privileges in the software.
The process flow analysis has identified the data integrity vulnerabilities, and this will be documented and remediated in the assessment report. Do we need to complete the FMEA? A resounding NO should be the answer because it is a total waste of time; you don’t need a crystal ball to know the outcome of the FMEA.
Alternatively, apply common sense. You already know what the problem is and the resolution: why waste time?
Titanic@Iceberg.com
Put simply:
YOU ARE OUT OF COMPLIANCE.
FIX IT.
NOW.
Don’t wait for a risk assessment to tell you what you already know. I would argue strongly, based on ICH Q9(R1) above, that the data process mapping report (see Table I) is your risk assessment (23). The remedial action should be:
- Raise a change request for the spectrometer that documents and justifies the implementation of separate user accounts and user roles, and approve it.
- Devise user roles with access privileges, with no conflicts of interest.
- Buy additional user licenses, if required.
- Allocate each user a unique account and an appropriate role.
- Implement user account management operated by IT or QA.
- Document and validate—I would suggest representative testing only.
Take a similar approach with all other DI vulnerabilities, poor practices, and business inefficiencies: Fix them! Redesign the process, and incorporate remediation or eliminate the vulnerabilities.
Exit, Pursued by a Bear…
On the other hand, you can waste time and effort if you have a fetish for risk assessments or if QA cannot think and insist you must complete an FMEA. Think of the fun hours inputting to your FMEA spreadsheet the problem, the possible effect, and then allocating random numbers for severity, occurrence, detectability. Finally, the final cell in the row has a value of 42 and the color turns red. Shock and horror: we are out of compliance!
Hold on a minute! What is new? Nothing, apart from a completed and colorful spreadsheet stating the bleeding obvious. What is the point?
My modified approach to data process mapping is shown in Figure 3. It involves the complete elimination of the FMEA risk assessment and the substitution of the data process mapping report. A further modification could be that the data process mapping report just identifies the DI vulnerabilities and links each one to the various CAPA and change requests raised.


FIGURE 3: A modified APIC data process mapping approach.
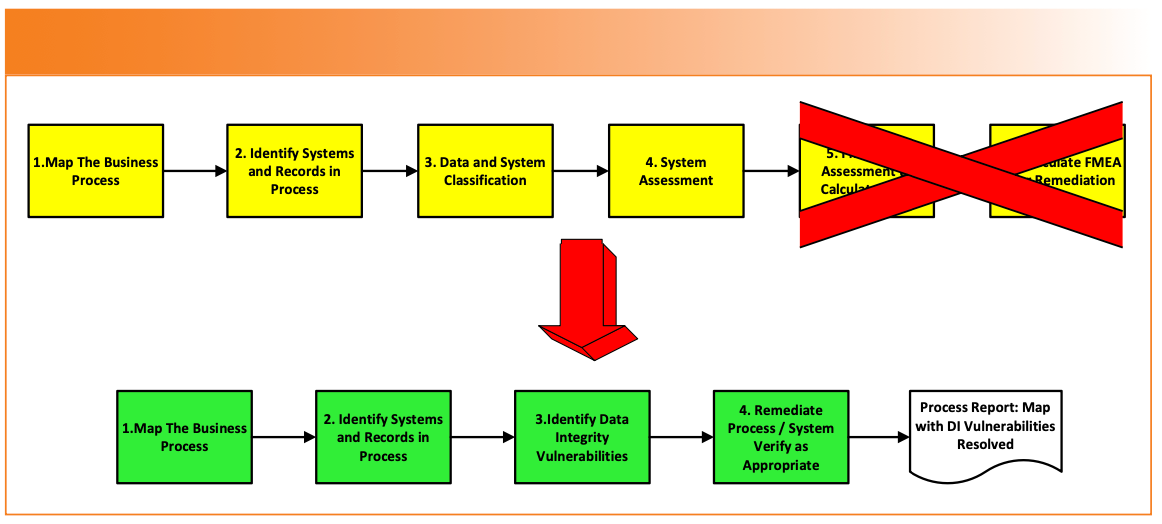
Summary
This column has conducted a practical review of one data process mapping example and has highlighted some practical changes that were made to improve it. Instead of performing a formal risk assessment, once the data process mapping exercise has highlighted any data vulnerabilities and business inefficiencies, these can be scheduled for remediation.
Acknowledgments
I would like to thank Mahboubeh Lotfinia for constructive review comments.
References
(1) MHRA GXP Data Integrity Guidance and Definitions. Medicines and Healthcare Products Regulatory Agency, London, United Kingdom, 2018.
(2) PIC/S PI-041 Good Practices for Data Management and Integrity in Regulated GMP/GDP Environments. Pharmaceutical Inspection Convention/Pharmaceutical Inspection Cooperation Scheme, Geneva, Switzerland, 2021.
(3) GAMP Guide Records and Data integrity. International Society for Pharmaceutical Engineering, Tampa, Florida, 2017.
(4) GAMP Good Practice Guide: Data Integrity-Key Concepts. International Society for Pharmaceutical Engineering, Tampa, Florida, 2018.
(5) GAMP Good Practice Guide: Data Integrity by Design. International Society for Pharmaceutical Engineering, Tampa, Florida, 2020.
(6) Technical Report 80: Data Integrity Management System for Pharmaceutical Laboratories. Parenteral Drug Association (PDA), Bethesda, Maryland, 2018.
(7) Burgess, C.; et al. GMP, GCP and GDP Data Integrity and Data Governance, 3rd Edition. European Compliance Academy Heidelberg, Germany, 2022.
(8) Practical Risk-based Guide for Managing Data Integrity version 1. 2019.
(9) Practical Risk-based Guide for Managing Data Integrity version 2. 2022. https://apic.cefic.org/publication/practical-risk-based-guide-for-managing-data-integrity/.
(10) McDowall, R. D. Do You Really Understand the Cost of Noncompliance? Spectroscopy 2020, 35 (11), 13–22.
(11) EudraLex - Volume 4 Good Manufacturing Practice (GMP) Guidelines, Annex 11 Computerised Systems. European Commission: Brussels, Belgium, 2011.
(12) McDowall, R. D. Is Traceability the Glue for ALCOA, ALCOA+, or ALCOA++? Spectroscopy 2022, 37 (4), 13–19. DOI: 10.56530/spectroscopy.up8185n1
(13) FDA 483 Observations Jiangsu Hengrui Pharmaceuticals Co. Ltd. 2024, (accessed 2024-06-22). https://www.fda.gov/media/179134/download.
(14) EudraLex - Volume 4 Good Manufacturing Practice (GMP) Guidelines, Chapter 4 Documentation, E. Commission, Editor. Brussels, Belgium, 2011.
(15) 21 CFR 211 Current Good Manufacturing Practice for Finished Pharmaceutical Products. Food and Drug Administration, Sliver Spring, Maryland, 2008.
(16) McDowall, R. D. The Humble Instrument Log Book. Spectroscopy 2017, 32 (12), 8–12.
(17) 21 CFR Part 11; Electronic Records; Electronic Signatures Final Rule. Federal Register 1997, 62 (54), 13430–13466.
(18) McDowall, R. D. Is Traceability the Glue for ALCOA, ALCOA+ or ALCOA++? Spectroscopy 2022, 37 (4), 13–19. DOI: 10.56530/spectroscopy.up8185n1
(19) EMA Guideline on Computerised Systems and Electronic Data in Clinical Trials. European Medicines Agency: Amsterdam, The Netherlands, 2023.
(20) EudraLex - Volume 4 Good Manufacturing Practice (GMP) Guidelines, Chapter 6 Quality Control. European Commission: Brussels, Belgium, 2014.
(21) McDowall, R. D. Why is My Application’s Audit Trail Rubbish? Spectroscopy 2017, 32 (11), 24–27.
(22) Concept Paper on the Revision of Annex 11 of the Guidelines on Good Manufacturing Practice for Medicinal Products–Computerised Systems. 2022. https://www.ema.europa.eu/en/documents/regulatory-procedural-guideline/concept-paper-revision-annex-11-guidelines-good-manufacturing-practice-medicinal-products_en.pdf.
(23) ICH Q9(R1) Quality Risk Management. International Council for Harmonisation: Geneva, Switzerland, 2023.
R. D. McDowall is the director of R. D. McDowall Limited and the editor of the “Questions of Quality” column for LCGC International, Spectroscopy’s sister magazine. Direct correspondence to: SpectroscopyEdit@MMHGroup.com ●


Synthesizing Synthetic Oligonucleotides: An Interview with the CEO of Oligo Factory
February 6th 2024LCGC and Spectroscopy Editor Patrick Lavery spoke with Oligo Factory CEO Chris Boggess about the company’s recently attained compliance with Good Manufacturing Practice (GMP) International Conference on Harmonisation of Technical Requirements for Registration of Pharmaceuticals for Human Use (ICH) Expert Working Group (Q7) guidance and its distinction from Research Use Only (RUO) and International Organization for Standardization (ISO) 13485 designations.


