Characterization of TiO2 Nanopowders by Raman Spectroscopy
Raman spectroscopy is proving to be a powerful technique for characterizing the structural and morphological properties of nanopowders. Specifically, Raman spectroscopy can provide details of the grain size and thickness of titanium dioxide (TiO2) nanopowder films. These measured film properties affect the efficiency of photovoltaic devices, such as solar cells, and also the effectiveness of nanopowders in catalysis applications.
Raman spectroscopy has been successfully used to study the microscopic nature of the structural and morphological properties of nanopowders. Nanoparticles of titanium dioxide (TiO2) are essential parts of dye-sensitized solar cells and materials for catalysis. Dye-sensitized solar cells are advantageous alternatives to conventional solid-state photovoltaic devices because of performance, environmental compatibility, and cost. Grain size and thickness of TiO2 film show a dominant effect on the efficiency of the photovoltaic devices. We have investigated commercial TiO2 nanopowders with different sizes using Raman spectroscopy. The conservation of momentum for light scattering from the phonons means that the only modes at the center of Brillouin Zone (q = 0) are Raman active. The localization of phonons in nanoscale materials leads to the relaxation of this selection rule. It gives rise to an increase in the number of Raman active modes away from the center of the Brillouin zone, and, therefore, results in peak shifts and broadening. This study presents and compares the details of the evolution of the Eg band at 142.9 cm-1 from different nanopowders. This research likewise discusses experimental results in the frame of the model of confined phonons. It was found that the Raman spectra of nanopowders are very sensitive to methods and preparation conditions.
The past few decades been rapidly emerging as the era of nanotechnology. The technological applications grow when an understanding of the fundamental properties of nanomaterials as a function of grain or particle size allows us to predict it. Grain size and thickness of titanium dioxide (TiO2) film have shown a dominant effect on the efficiency of the photovoltaic devices and the application in catalysis (1–4). Nanomaterials synthesized by various methods and the properties of nanomaterials with the same size of grains may be different. This effect is due to defects in structures. Isolated or weakly connected nanoparticles form a nanopowder. Raman scattering, a nondestructive technique that is comparable with other methods used for characterization of nanopowders, requires only a small quantity of a sample and has a short measurement time. Peak position and width of the Raman band are susceptible to the local structure of the materials. The purpose of this study is to develop the understanding relationship between grain size and the structure and properties of commercial TiO2 nanopowders.
Among the three natural phases of TiO2, (which include rutile and brookite), the anatase phase is the most important in applications of catalysis and dye-sensitized solar cells.
The crystalline structure of anatase is tetragonal; the unit cell composes of two primitive cells, each with two TiO2 units (space group is D19/4h ). Group theory predicts six Raman active modes, which are Eg at 144 cm-1, Eg at 197 cm-1, B1g at 399 cm-1, B1g at 513 cm-1, A1g at 519 cm-1, and Eg at 638.2 cm-1 (5–7). Our primary interest is the Eg mode at 142.9 cm-1, due to its being very sharp and intense.
Theory
The properties of nanopowder do not differ from those of the bulk, unless the dimension of grains is less than 10 to 20 nm. Raman scattering probes only the optical phonons in the center of the Brillouin zone (q = 0). This selection rule is mainly a consequence of the infinite periodicity of the crystal lattice (L →∞). The wavefunction of phonons with wavevector q = 0 defines by equation 1:

where u(q0,r) has a periodicity of lattice. Therefore, â q=2π/L → ∞, â q/q = 0; one would expect that the line shape of the Raman band will be Lorentzian. The first-order Raman spectrum can be calculated by integrating the contribution of all phonons over the Brillouin zone and expressed by equation 2:

where ωi(q) is a phonon dispersion curve, and Γ0 is the natural line width of the center zone optical phonon in an infinite crystal.
In the case of nanocrystalline materials, the periodicity of the crystal is interrupted, and this rule is relaxed. In an isolated grain, the phonon can remain confined within the grain. For a spherical particle of size L, the phonon wavefunction decays to a minimal value close to the boundary. The function Φ(q0,r) in equation 1 may be replaced by a new function Ψ(q0,r) according to equation 3:

where W(r, L) is a phonon weight function. There are several weight functions proposed for an isolated grain. These are: 1) Gaussian function, W(r, L) = exp (-αr2/L2) (8); 2) function by analogy with the ground electron state of an electron in a hard-sphere, W(r, L) = sin (αr)/ αr (9); and 3) function by analogy with a wave in a lossy medium, W(r, L) = exp (-αr) (9). Parameter α will define how fast the amplitude of the phonon decays toward the boundary. For some nanomaterials, rigid confinement of the phonons (amplitude vanished at the boundary) in nanocrystals is required to explain experimental data.
When phonons are confined in nanocrystals, wavefunction Ψ(q0,r) is no longer an eigenfunction of the phonon at q0 = 0. Instead, it is a superposition of eigenfunctions with the q vector in an interval of âq – q0â, centered at q0. Ψ’ (q0,r) with a possible expansion in a Fourier series (equation 4):

and Fourier coefficients C (q0,q) (equation 5):

Let us assume that u(q,r)= u(q0,r), and that phonon transitions matrix elements |<q0 | Ô |q>|2 for q≠q0 have a non-zero value. The eigenfunctions are weighted through coefficients C (q0,q) according to equation 6:

where Ô is a photo-phonon operator. In this case, the first-order Raman spectrum is expressed by equation 7:

The additional contribution to the Raman spectrum from these phonons results in an asymmetric broadening of the line shape. The increased intensity in the high or low wavenumber side of the Raman band arises from the contribution of either positive (ωi > ω0) or negative dispersion (ωi < ω0) of the phonon branch away from the center of Brillouin zone. A dispersion curve assumes to be isotropic. Depending on the material, it may be approximated by several functions as ω(q) = ω0 + A[1 - cos(qa)] (11), or parabolic ω(q) = ω0 + βq2] (10). The ω0 is the frequency of the phonon in the center of the Brillouin zone, while α is the lattice parameter. The zone boundary corresponds to qα = π and A, β are parameters specific to the material.
Experiment
TiO2 nanopowders from two vendors were used for this study. One is US Research NanoMaterrials Inc. (USRNM), which provides nanopowders with the following profile: purity 99.98% Super Grade, APS ( 30 nm, 15 nm, and 5 nm) and SSA: 50 m2/g, 60 m2/g, and 50 m2/g, respectively. Color: white; bulk density: 0.42 g/cm3, 0.22 g/cm3, and 0.42 g/cm3, respectively. True Density: 3.9 g/cm3; pH: 5.5-6.5, Loss of weight in drying: 1%; loss of weight on ignition: 3%. The other supplier was Nanostructured & Amorphous Materials (NAM), which provides nanopowder with purity: 99.8%; SSA: 150–300 m2/g; color: white; APS: 5 nm; bulk density: 0.25-0.3 g/cm3. The single crystal of anatase was from Roy Harltburt Minerals, with a size of 2 x 3 x 4 mm.
Raman spectra of the samples were collected at room temperature in a backscattering configuration using a LabRam Evolution Raman microscope (Horiba Scientific) equipped with an Olympus BX-41 microscope (objective x100, NA 0.9), TE cooled CCD detector (Synapse OE 1024x256), Horiba Scientific), 632.8 nm HeNe laser, and 1800 gr/mm grating. The spectral resolution of the instrument was 0.35 cm-1. The laser power was 7 mW, and the acquisition time was between 2 and 20 s depending on the sample. Two to ten spectra were registered for each sample at a different position to verify sample homogeneity and the absence of photoinduced phenomena. The reference spectrum of Si (peak position of 520.6 cm-1) was measured after each spectrum to avoid temperature drift.
Results and Discussion
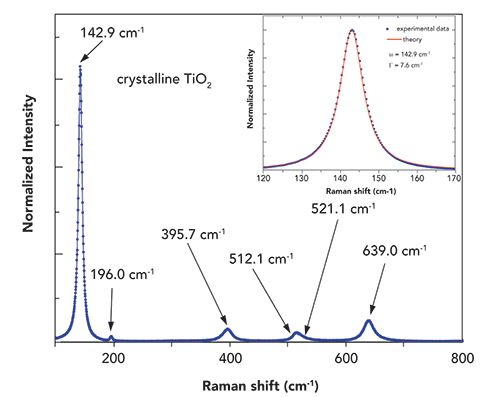
The unpolarized Raman spectrum of crystalline anatase is shown in Figure 1. The Raman peaks observed at 142.9, 196.5, 396.5, 514.4, 521.0, and 638.2 cm−1 are assigned as the Eg, Eg, B1g, B1g, A1g and Eg modes of the anatase phase, respectively. The position of peaks is in agreement with previously reported data (5–7).
Figure 1: Raman spectrum of crystalline TiO2 (anatase). Upper right-hand insert shows line shape of Eg band and fitting parameters.
Raman spectra of crystalline anatase and TiO2 nanopowders from USRNM with a grain size of 30 nm and 15 nm are shown in Figure 2a. The Raman band at ~142.9 cm−1 for nanopowders becomes broader with decreasing the grain size and shifts for that of the TiO2 crystal. The spectra of the 5 nm nanopowder taken in 10 different spots are not reproducible from point to point and show in Figure 2b. From the Raman spectroscopy point of view, 5 nm nanopowder is not considered a homogeneous material on the scale of the spot size of the focused laser, which is 430 nm ((0.61 × λ)⁄(N.A.); λ = 0.6328 μ, N.A. = 0.9).
Figure 2: Raman spectra of TiO2 nanopowders: (a) 30 nm and 15 nm samples are from USRNM, and 5 nm sample is from NAM; (b) spectra of 5 nm nanopowder from USRM taken in different spots (see text for details).
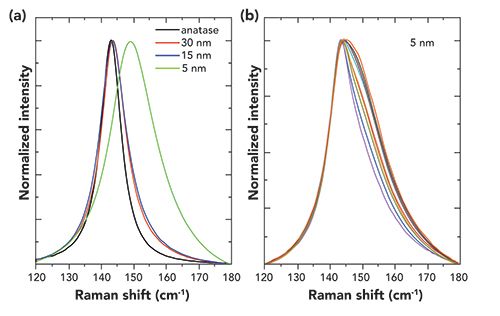
Because of that, 5 nm nanopowder from USRNM was excluded from future work. Nanopowders with a grain size of 30 nm and 15 nm show excellent reproducibility of the position and spectral line shape in different spots. Raman spectra of nanopowder with a grain size of 5 nm from NAM is shown in Figure 2a. Spectra taken at different points are reproducible. The grain size for two of these 5 nm nanopowder samples (from NSRNM and NAM) are reported to be the same; however, Raman spectra reveal significant differences in the materials.
The broadening and shift of the Raman peak at 142.9 cm-1 observed in the spectra can be originated to the surface pressure or confinement effects. It is unlikely that there is a shift in the position and line shape of the Raman band due to the surface pressure or stress and strain. These materials are in the form of nanopowder, which is isolated or weakly connected nanoparticles. In nanopowder, nanoparticles are free and not embedded in any medium. Therefore, phonon confinement is the main cause of this phenomenon. The occurrence of the strong line at 142.9 cm−1 indicates that the TiO2 nanopowders possess a certain degree of long-range order.
The broadening of the peak compared with the single crystal, and a shoulder from the high wavenumber side suggests the contribution of the phonons away from the center of the Brillouin zone.

Among many proposed confinement functions, the Gaussian confinement function is a simple model considering that particles are homogeneous spheres, and the parameter α defines how fast the wavefunction decays when approaching the boundary. In this case, weight coefficient |C(0,q)|2 will be expressed by equation 9:

The L is the diameter of nanoparticle, while α is a parameter, which is specific to the material. A phonon amplitude decays toward the boundary of the nanoparticle at 2r/L = 1 at the actual boundary determined by α. Rigid confinement, at which the amplitude of the phonons vanished at the boundary, corresponds to a larger α value.
As a model of the phonon dispersion curve, we use the analytical expression 10

with parameter of A = 20, with a being a lattice parameter and zone boundary corresponding to the qa = π (11,12). Based on this model, parameters of the Eg band of TiO2 were calculated, assuming that the central frequency is 142.9 cm-1; this frequency does not change with the size of the grains.
The insert in Figure 1 shows the Raman spectrum of crystalline TiO2 fitted using Lorentzian line shape because in single-crystal (ideal conditions) |C(0,q)|2 = 0. The line at 142.9 cm-1 is very narrow with full width at half maximum (fwhm) of 7.6 cm-1.
Figures 3 and 4 show spectra and fitting parameters for nanopowders with 30 nm and 15 nm grain size respectively. Parameters L, α, and Γ are calculated using the weight coefficient |C(0,q)|2 in equation 9. The size of the nanopowder L extracted from the Raman spectra is in good agreement with the size of the grains obtained from XRD (vendor’s specification). Parameter Γ0 increases with a decrease of grain size, and it shows similar behavior as reported in (13). Parameter α decreases in value as grain size becomes smaller. It corresponds to the condition that the amplitude of phonons requires more rigid confinement for large-size grains, and therefore, the amplitude should vanish toward the boundary much faster when compared with small-size grains.
Figure 3: Raman spectrum and fitting parameters of the Eg band for 30 nm nanopowder of TiO2.
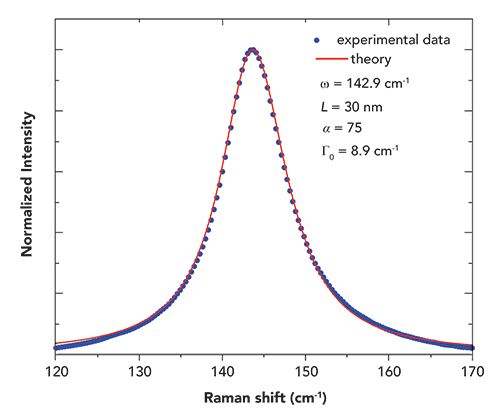
Figure 4: Raman spectrum and fitting parameters of the Eg band for 15 nm nanopowder of TiO2.
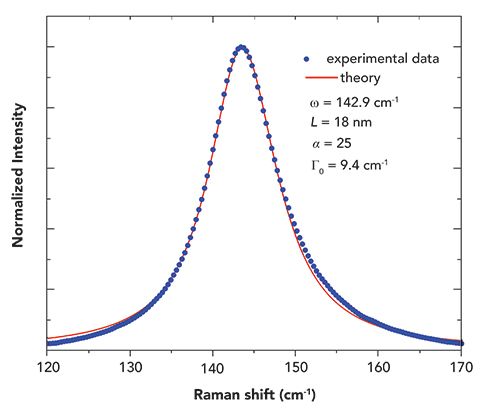
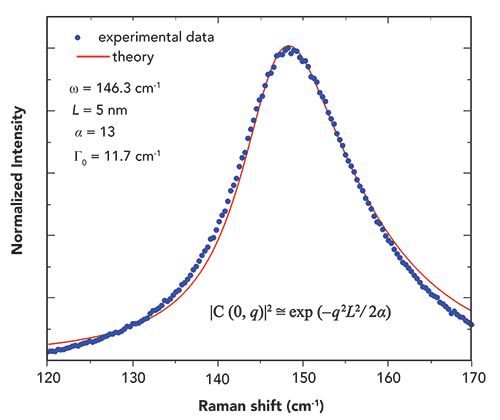
Figure 5 shows the Raman spectrum and fit parameters of the TiO2 nanopowder with a grain size of 5 nm. If a Gaussian weight function is in use, the spectrum only fits with ω0 = 146.3 cm-1 and grain size of 5 nm. However, there is no evidence that phonon frequency in the center of the Brillouin zone changed with the size of nanoparticles. Therefore, Gaussian weight function W(r, L) is not a good model for this sample.
Figure 5: Raman spectrum and fitting parameters of the Eg band for 5 nm nanopowder of TiO2.
Few other functions were proposed for confined phonons model (11,12), and one of them is by the analogy of the ground state of an electron in hard-sphere, defined by equation 11:

The weight coefficient |C(0,q)|2 in this case, is expressed by equation 12.

Figure 6 shows the spectrum and fitting parameters for the nanopowder with the grain size of 5 nm. The spectrum fitted with ω0 = 142.9 cm-1 and L of 6.8 nm, which is close to reported grain size 5 nm from the XRD data.
Figure 6: Raman spectrum and fitting parameters of the Eg band for 5 nm nanopowder of TiO2.
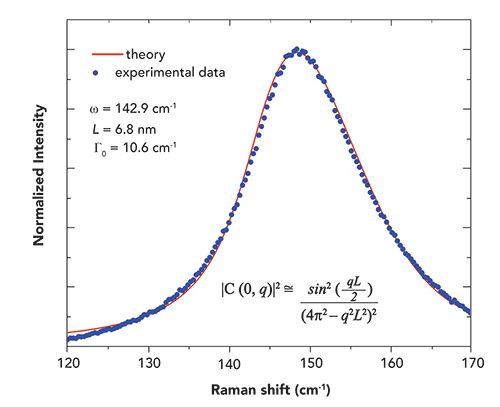
The fact that the line shape of nanopowders with 30 nm and 15 nm grain size is different from the line shape of the 5 nm nanopowder indicates that the properties of the nanomaterials are very different in the sense of phonon scattering. Using different weight functions to fit the experimental data confirms that phonons scatter in the material differently; the decay of phonons close to the boundary is also different.
Conclusion
In this work, I demonstrate the use of micro-Raman spectroscopy for non-destructive characterization of nanocrystalline TiO2 nanopowders. Grain size can be extracted from the spectrum of TiO2 nanopowders by applying a model of confined phonons. Results showed a good correlation between grain sizes obtained from Raman spectra and XRD. Raman spectra are more sensitive to the structure of nanopowders compared with XRD because Raman spectra of nanopowders may be different even though the XRD data shows the same grain size.
References
- N.-G. Park, G. Schlichthörl, J. van de Lagemaat, H.M. Cheong, A. Mascarenhas, and A.J. Frank, J. Phys. Chem. B103(17), 3308–3314 (1999).
- P. Ettireddy, N. Ettireddy, S. Mamedov, P. Boolchand, and P. Smirniotis, Applied Catalysis B. Environmental76, 123 (2007).
- S. Mamedov, T. Moriyama, T. Numata, N. Nabatova-Gabain, S. Yanagida, and L. Yan, Mat. Res. Soc. Symp. Proc. 1578 (2013).DOI: 10.1557/opl. 2013.915
- M.-I. Baraton, Recent Pat. Nanotechnol 6(1), 10–15 (2012). DOI: 10.2174/187221012798109273
- T. Ohsaka, F. Izumi, and Y. Fujiki, J. Raman Spectrosc.7(6), 321–324 (1978).
- T. Oshaka, J. Phys. Soc. Japan48, 1661 (1980).
- O. Frank, M. Zukalova, B. Laskova, J. Kürti, J. Koltaib, and L. Kavan, Phys. Chem. Chem. Phys.14, 14567–14572 (2012).
- H. Richter, Z.P. Wang, and L. Ley, Solid State Commun.39, 625–629 (1981).
- I.H. Campbell and P.M. Fauchet, Solid State Commun. 58, 739 (1986).
- E. Roca, C. Trallero-Giner, and M. Cardona, Phys. Rev. B49(19), 13704–13711 (1994).
- M. Mikami, S. Nakamura, O. Kitao, and H. Arakawa, Phys. Rev.B 66, 155213 (2002).
- D. Bersani and P. P. Lottici, and X.-Z. Ding, Appl. Phys. Lett. 72(1), 73–75 (1998).
- C.J. Doss and R. Zallen, Phys. Rev. B48, 15626–15637 (1993).
S. Mamedov is with Horiba Scientific, in Piscataway, New Jersey. Direct correspondence to: sergey.mamedov@horiba.com
AI-Powered SERS Spectroscopy Breakthrough Boosts Safety of Medicinal Food Products
April 16th 2025A new deep learning-enhanced spectroscopic platform—SERSome—developed by researchers in China and Finland, identifies medicinal and edible homologs (MEHs) with 98% accuracy. This innovation could revolutionize safety and quality control in the growing MEH market.
New Raman Spectroscopy Method Enhances Real-Time Monitoring Across Fermentation Processes
April 15th 2025Researchers at Delft University of Technology have developed a novel method using single compound spectra to enhance the transferability and accuracy of Raman spectroscopy models for real-time fermentation monitoring.
Nanometer-Scale Studies Using Tip Enhanced Raman Spectroscopy
February 8th 2013Volker Deckert, the winner of the 2013 Charles Mann Award, is advancing the use of tip enhanced Raman spectroscopy (TERS) to push the lateral resolution of vibrational spectroscopy well below the Abbe limit, to achieve single-molecule sensitivity. Because the tip can be moved with sub-nanometer precision, structural information with unmatched spatial resolution can be achieved without the need of specific labels.
