Comprehensive Gas Chromatography Coupled to Simultaneous Dual Detection (TOF-MS/FID) as a Confirmatory Method for MOSH and MOAH Determination in Food
Food contamination from mineral oil saturated hydrocarbons (MOSHs) and mineral oil aromatic hydrocarbons (MOAHs) is problematic and requires a sensitive analytical technique. These contaminants were analyzed using GC×GC with flame ionization detection (FID) and time-of-flight–MS (TOF–MS) parallel dual detection. The method provides enhanced chromatographic separation, along with the full mass spectra information, and overcomes difficult interferences, resulting in reduction of false positives over conventional GC–MS methods.
Mineral oil hydrocarbon (MOH) contamination has been described as a complex mixture of isomers mainly related to two classes of compounds, namely mineral oil saturated hydrocarbons (MOSHs) and mineral oil aromatic hydrocarbons (MOAHs). The former class includes aliphatic hydrocarbons, both linear and branched (alkanes and isoalkanes called also paraffin and isoparaffin), and cyclic compounds (cycloalkanes or naphthenes) with possible lateral alkylation. The MOAH class includes one or more benzene rings, mainly alkylated, which usually represent up to 25% of the MOSH fraction (1). Humans can be exposed to MOH through ingestion, skin contact, or inhalation, but the former is the most common. Many sources of food contamination can be listed, either as intended and unintended. A well-presented compendium can be found in (2).
Although still under investigation, the toxicity of MOSH and MOAH is of different concern. MOAHs, mainly the three-to-seven ring polycyclic aromatic compounds with a low degree of alkylation, are potentially mutagenic and tumor promoters (1,3). More debate is open on the effects of MOSH: those in the C16 to C35 range can be selectively accumulated and cause microgranulomas in several rat tissues (such as lymph nodes, spleen, and liver) (1,4,5). Nevertheless, the correlation between exposition and granuloma formation or inflammatory response is still not clear, and data on humans are scarce (6).
The European Commission has required an effort to re-evaluate the toxicology of MOH based on a detailed characterization rather than on physicochemical properties (1), and to gather more information regarding the occurrence and possible sources of contamination in food (7). In this regard, the focus is on the analytical methods for MOSH and MOAH determination, which is rather demanding, not just in terms of sample preparation (8–10). Both MOSH and MOAH appear on a chromatographic trace as an unresolved complex mixture (UCM) or a “hump.” Several off-line methods have been proposed (11–13), the method of election for MOH determination is hyphenated liquid–gas chromatography (LC–GC) method (14–16). Although the method is very efficient, many interferences from different sources (including, but not limited to, polyolefins from plastic, carotenoids, olefins, and terpenoids from the sample itself), may be present in both of the fractions, which, in some cases, are not easily distinguished by the MOSH and MOAH UCMs, thus leading to possible false positives. Complicating the scenario even more is the lack of a confirmatory method with MS as requested by Decision 2002/657 (17). The lack of standards requires the use of a flame ionization detector (FID) for quantification rather than MS, because MS virtually provides the same response for all hydrocarbons (18). Such an issue is a hot topic of discussion in the field, and, although a GC–MS has been proposed to fill the gap, the lack of specific diagnostic fragments to differentiate MOSH and MOAH from other possible contaminants or analogous (such as MORE, mineral oil refined product, PAO, polyalphaolefins, POSH, and polymer oligomeric hydrocarbons) leaves the issue open (2,19,20). The use of comprehensive multidimensional GC (GC×GC) has been proposed (21,22), and, until now, it seems the most promising solution. However, all the applications using GC×GC had been presented and optimized before the publication of the last Joint Research Center (JRC) Guidelines in 2019 (23), which required extending the data reported to the C10 to C50 range.
The aim of this work is to investigate the potential of a GC×GC system coupled in parallel to an FID and time-of-flight (TOF) MS as a confirmation tool for MOSH and MOAH analysis within the JRC guidelines requirements.
Materials and Methods
Reagents, Standards, and Samples
All the solvents were purchased from MilliporeSigma. The n-hexane, acetone, and dichloromethane were distilled before use.
The MOSH and MOAH internal standards, containing 5-α-cholestane (Cho, 0.6 mg m/L), n-C11 (0.3 mg/mL), n-C13 (0.15 mg/mL), cyclohexyl cyclohexane (CyCy, 0.3 mg/mL), n-pentyl benzene (5B, 0.30 mg/mL), 1-methyl naphthalene (1-MN, 0.30 mg/mL), 2-methylnaphthalene (2-MN, 0.30 mg/mL), tri-tert-butyl benzene(TBB, 0.3 mg/mL) and perylene (Per, 0.6 mg/mL) in toluene, were provided by Restek. The MOSH/MOAH retention time standard, containing a standard mixture of n-alkane C10-C40 (50 mg/L each) plus C50 was also from Restek.
All the glassware was carefully washed and rinsed with distilled solvents (acetone and n-hexane) before use.
Palm oil and a spice extract were provided by a private laboratory (which asks to not be disclosed).
GC×GC-FID/TOF-MS Analysis
The primary column was a Rxi-17Sil MS 12 m × 0.25 mm i.d. × 0.25-μm df connected through a tee-union (Agilent) to two Rxi-1 MS 1.4 m × 0.1-mm i.d. × 0.1-μm df linked to the FID and the TOF-MS.
GC oven temperature program: 50 °C (hold 1 min) to 350 °C (hold 1 min) at 5 °C/min. A 10 °C offset was applied between the first and secondary ovens. The carrier gas, helium, was supplied at an initial pressure of 275 kPa (constant flow). Injection temperature: 310 °C. Injection mode and volume: splitless injection (1 min); 3μL. Modulation was performed every 10 s, applying variable hot and cold pulse durations based on the wide range of volatilities in the sample.The FID was operated as follows: H2 flow: 40 mL/min; airflow: 400.0 mL/min; make up (He): 30.0 mL/min; Temperature: 350 °C. MS parameters: 40–750 m/z; spectra generation frequency (TOF-MS and FID): 100 Hz; interface and ion source temperatures were 250 °C and 340 °C, respectively. MS ionization mode: electron ionization (EI) at 70 eV. Data were acquired and elaborated using the ChromaTOF brand software (v5.50).
Results and Discussion
GC×GC-FID/TOF-MS: Chromatographic Optimization
The optimization of the GC×GC system with dual detection started from a series of considerations, namely the separation efficiency, the sensitivity, and the goal to obtain a perfect match between FID and MS retention times. Based on the outcomes of previous work by Cordero and coworkers (24), the use of two secondary columns was selected to maximize separation efficiency and two-dimensional (2D) space exploitation. Differently from the calculations done elsewhere with quadrupole MS systems (22,24), the use of the TOF-MS mentioned above, which consists of a slightly longer transfer line (31 cm) required extra care regarding the flow and MS/FID split calculations. In fact, our initial calculation suggested the use of a 1.6 m × 0.1 mm segment connected to the MS and 1.4 m × 0.1 mm to the FID, as also reported in (24) for a split between the two detectors of ~50% and a match of the retention times. However, the experimental results did not confirm the calculation, because an extra resistance has to be accounted for, due to the length of the transfer line constantly maintained at high temperature (340 °C). The final optimal column lengths were 1.4 m × 0.1 mm for both of the secondary columns. Although the use of pressure control mode rather than flow control mode for the carrier gas would have ensured a constant split all over the chromatographic area, the retention time match would have been negatively affected. Therefore, the flow control mode was used and the split ratio variation over the entire oven ramp (50–350 °C) was experimentally evaluated analyzing a mixture of n-alkanes in the GC×GC-TOF-MS/FID system and comparing the signal with the data obtained in a GC×GC-FID system, without any splitting device. An average splitting of 56/44 at FID-MS was measured, with a variation between C10 and C50 within the experimental variability of the three replicates (Figure 1). The chemical-class structure in the 2D chromatogram was maintained up to the elution of the C50.
Figure 1: FID response (n = 3) obtained for a mixture of n-alkanes analyzed in the GC×GC-TOF-MS/FID system, normalized versus the response of the same mixture analyzed by GC×GC-FID.
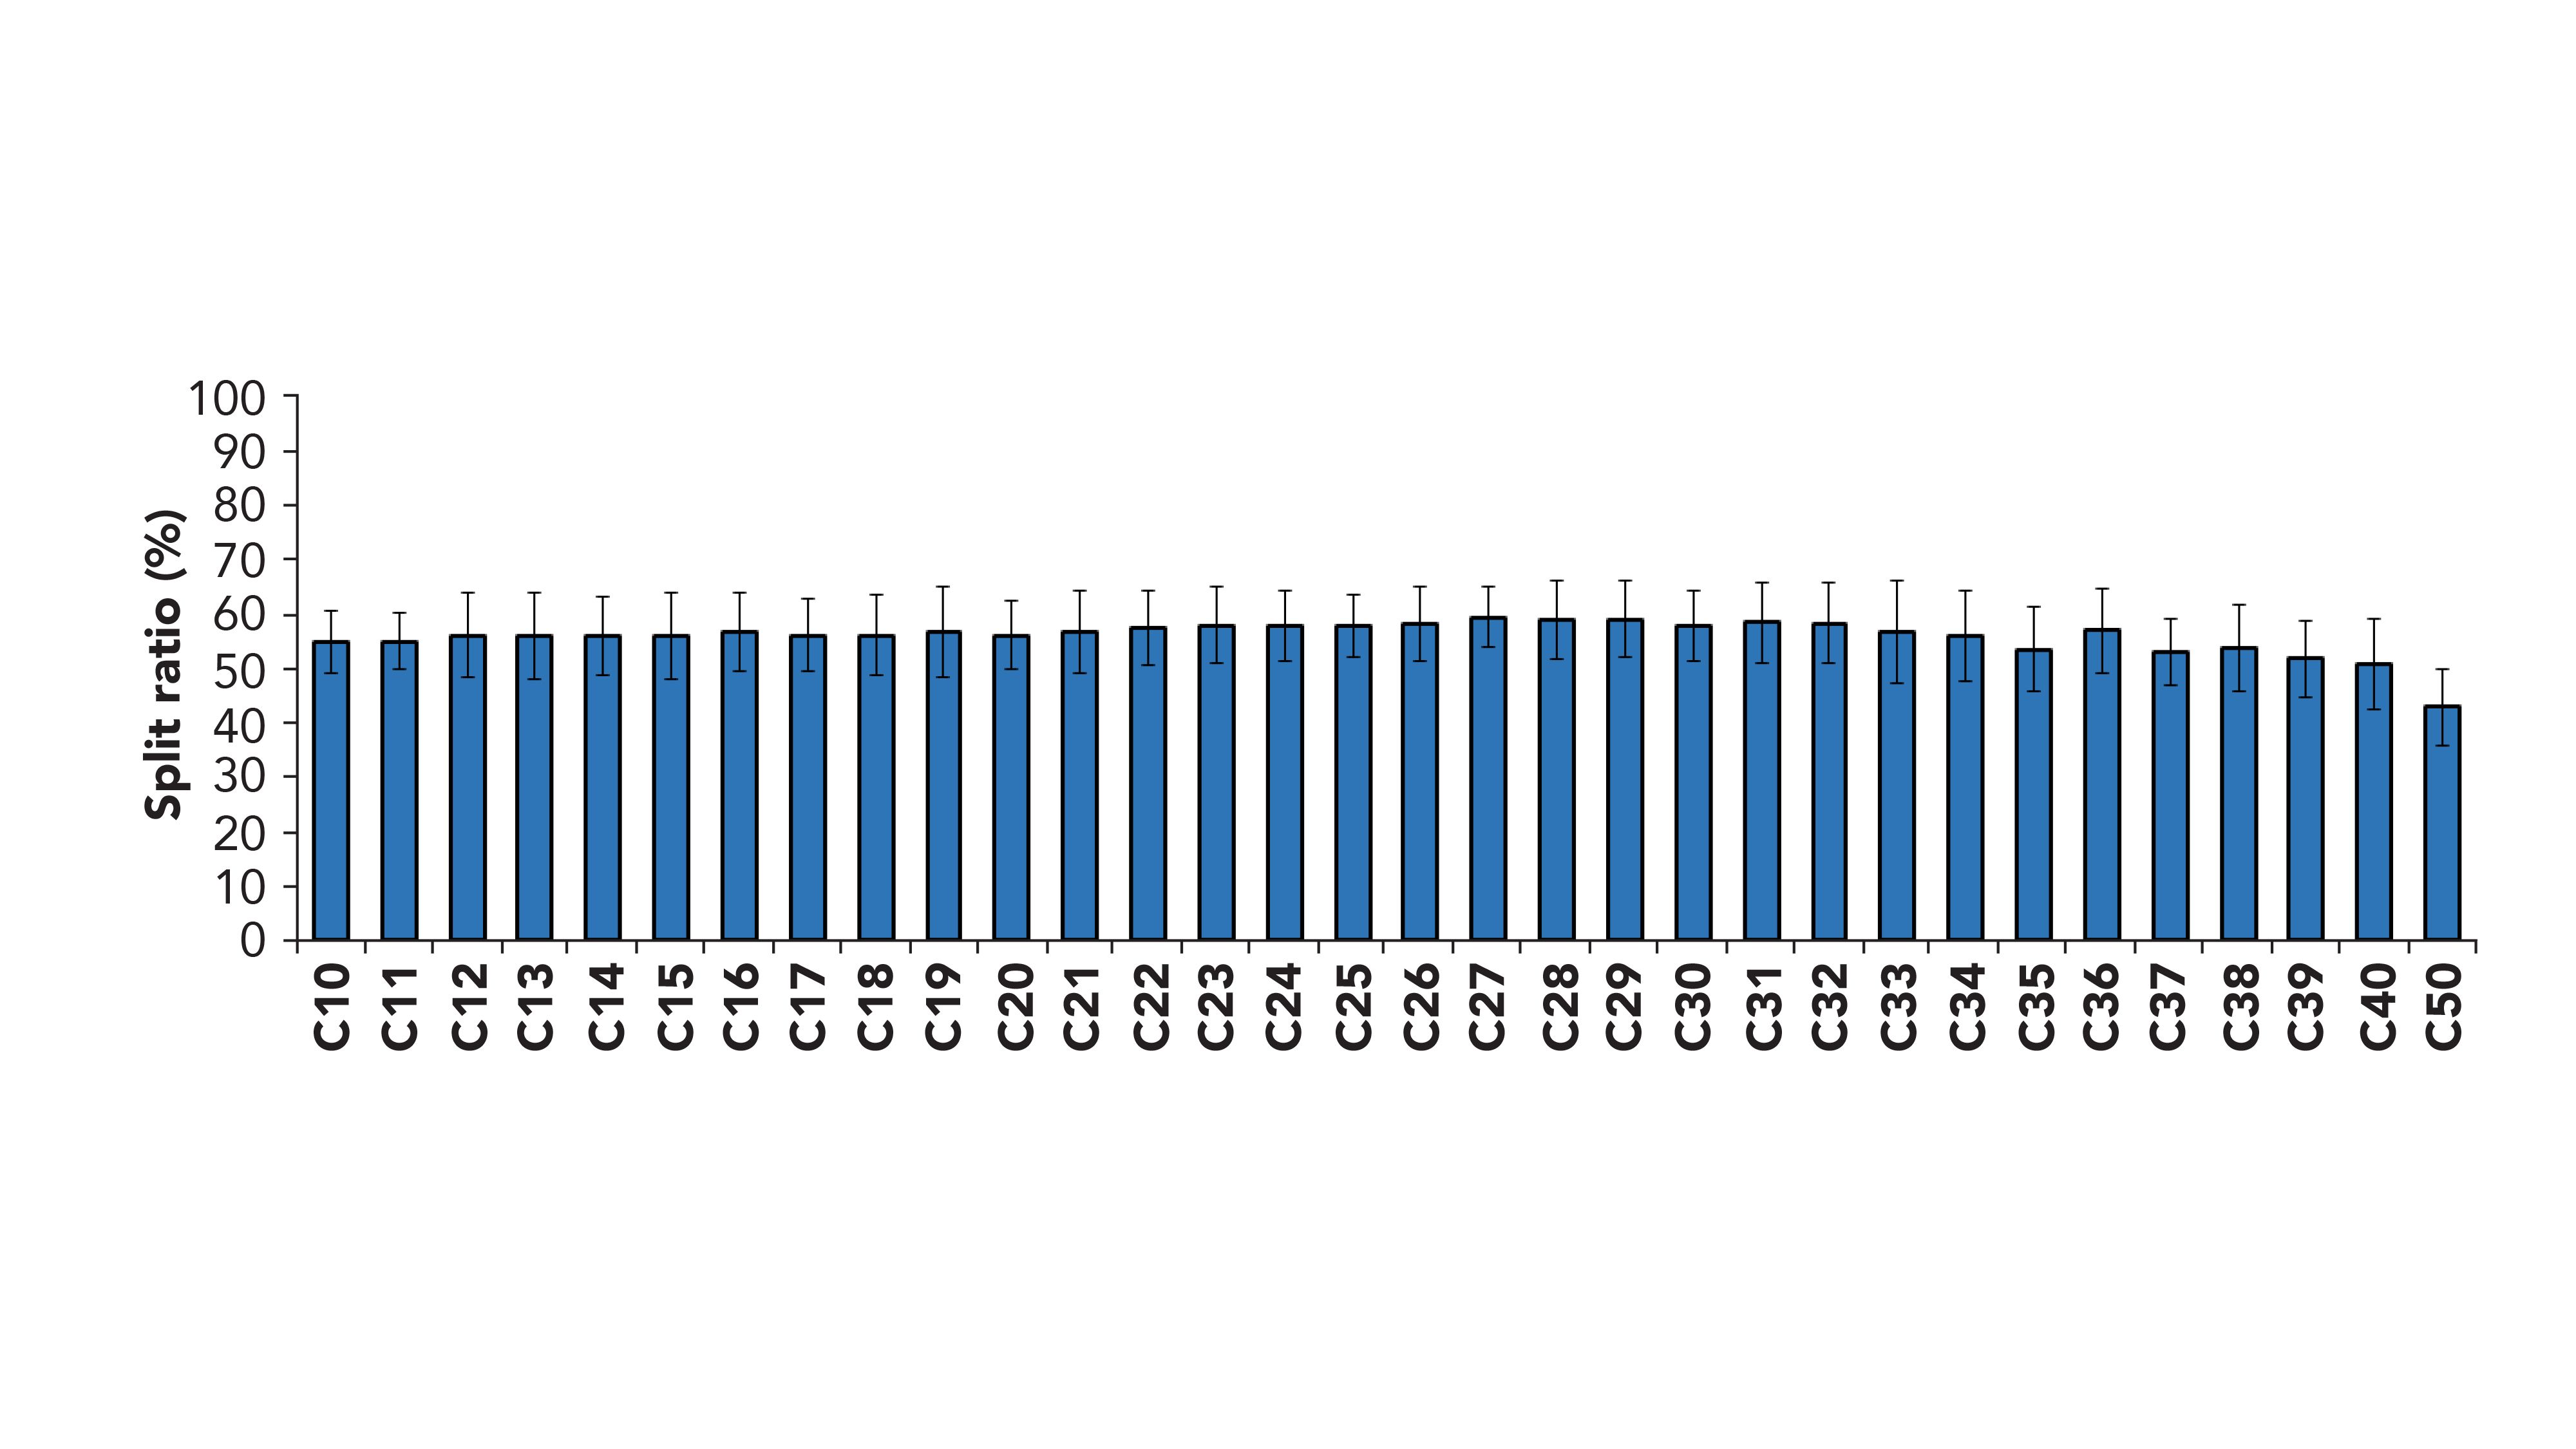
The overall separation performance of the two parallel separations was compared measuring the peak capacity (n), the net separation used (S1, S2, and SGC×GC), and the percentage of usage (25–28). The results are reported in Table I, showing that the performance of the two parallel separations is highly comparable.

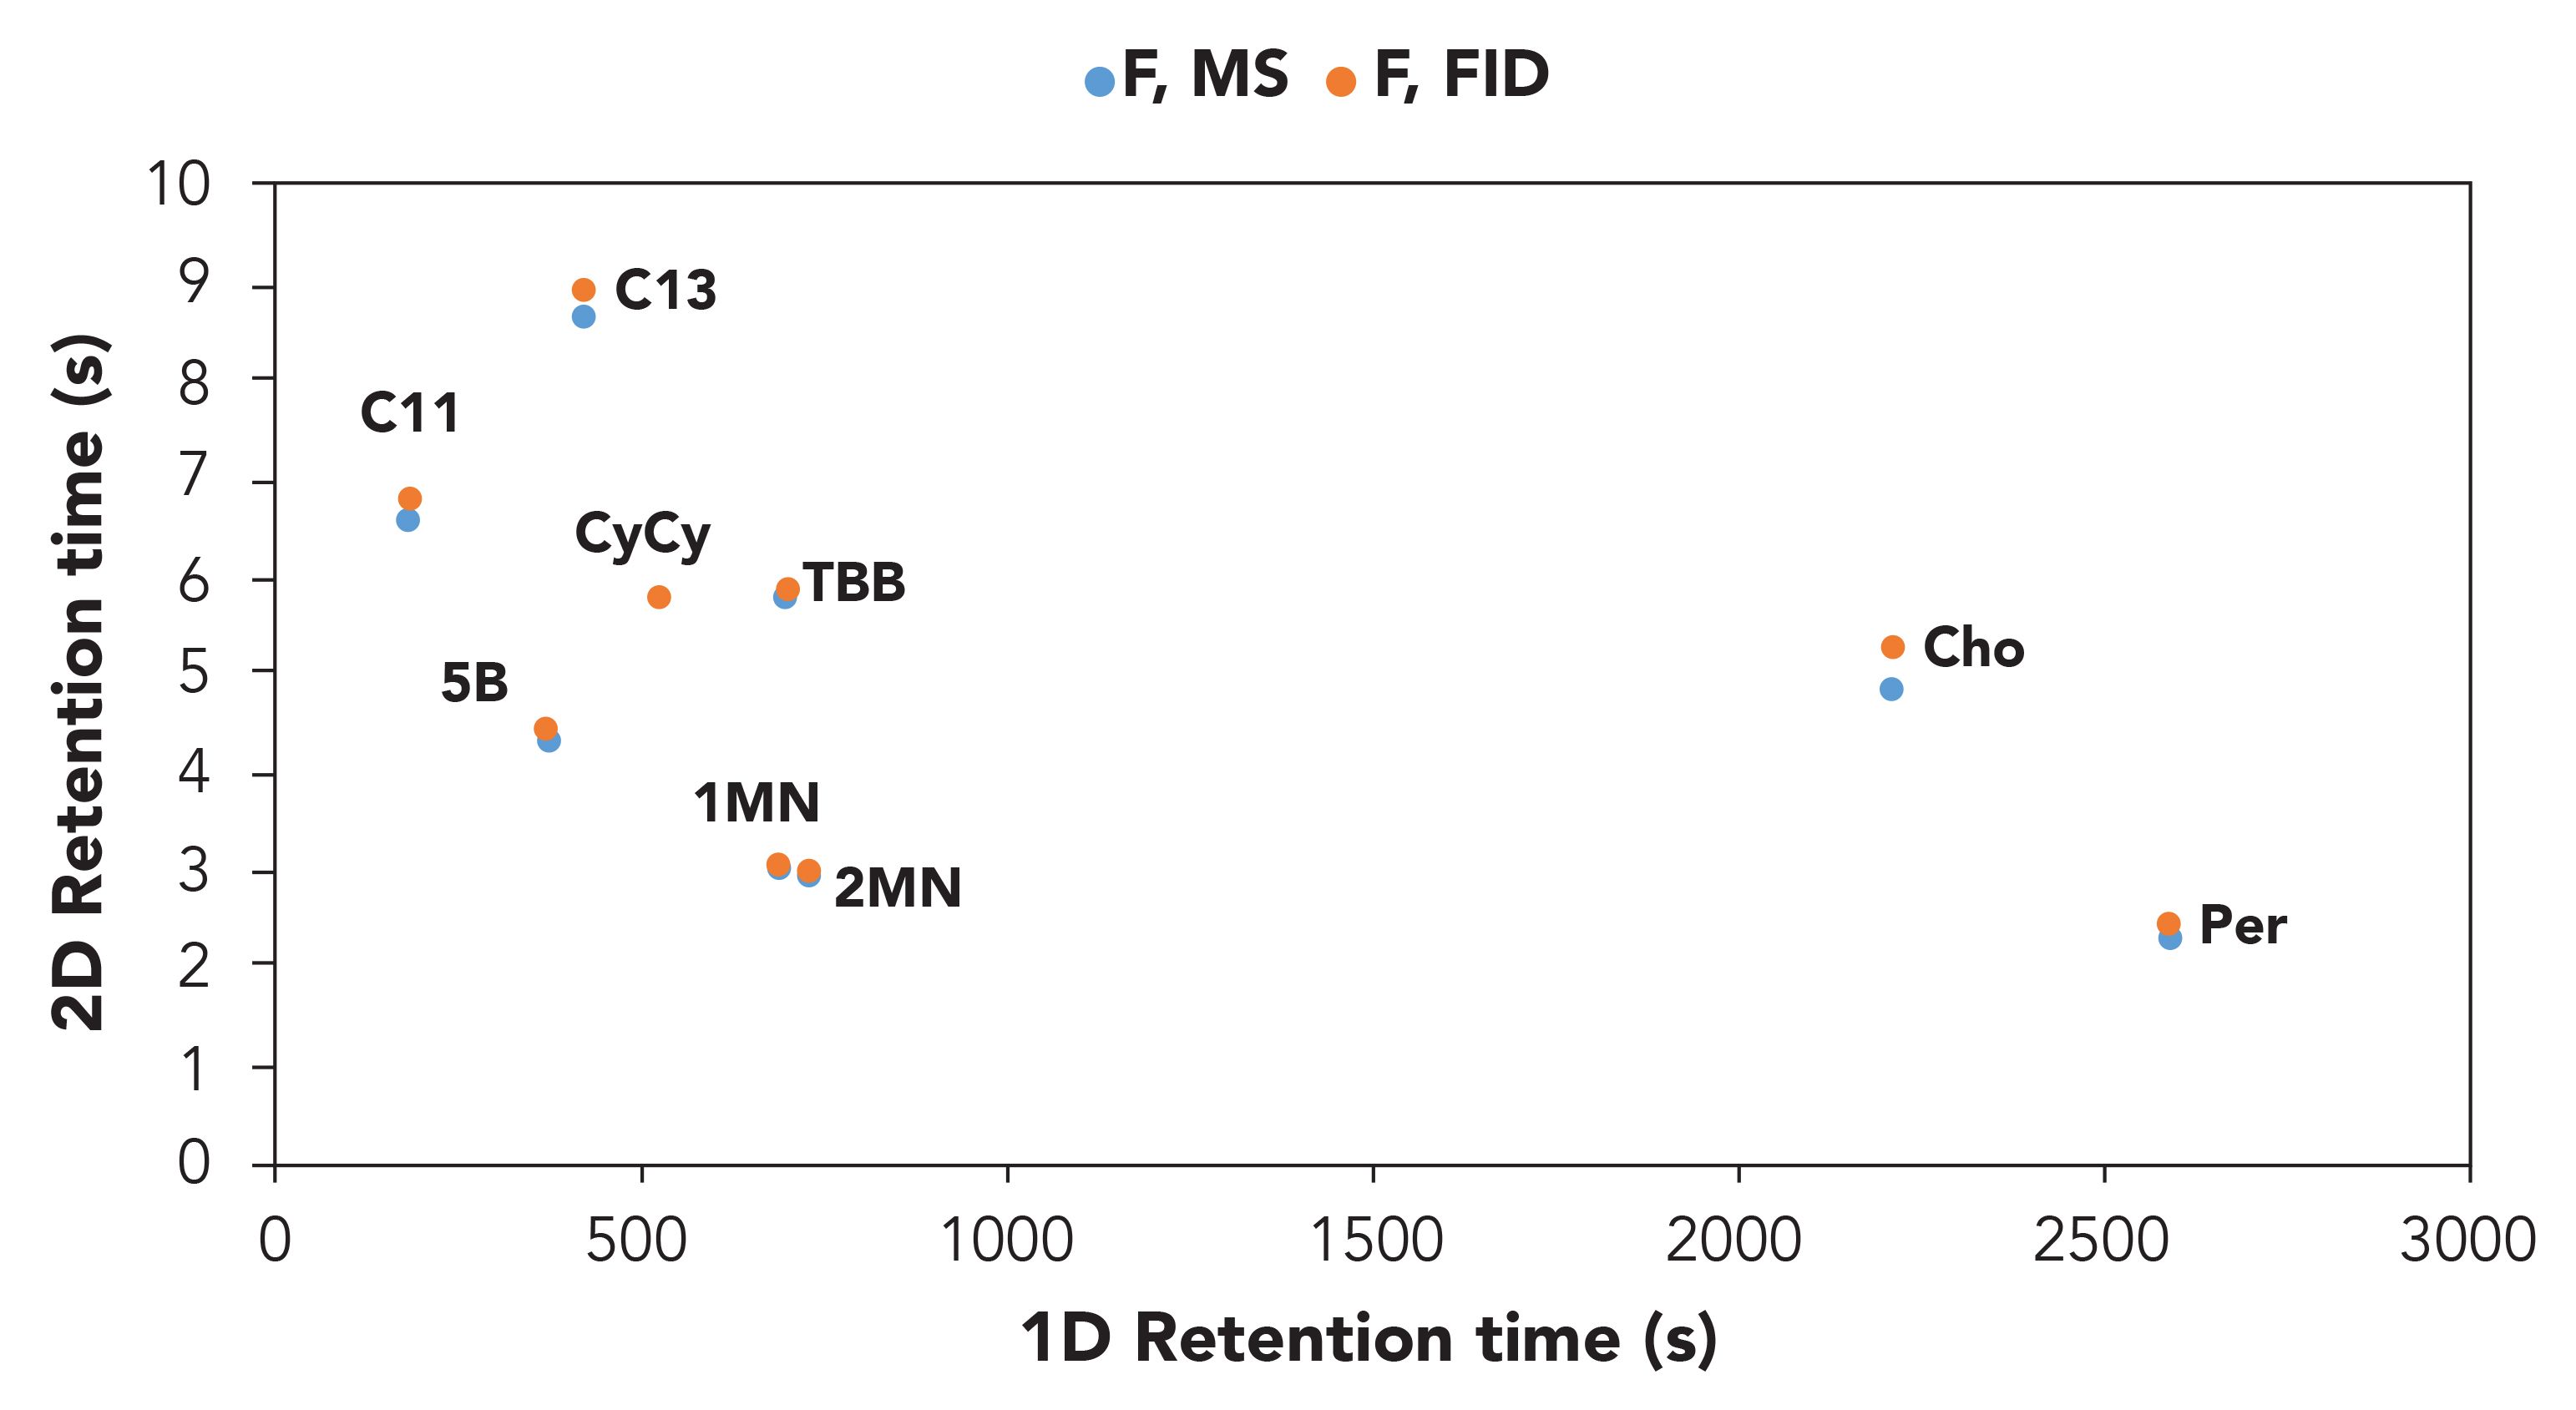
Finally, the alignment of the two plots obtained from the FID and the TOF-MS acquisition was positively confirmed on the base of 1D and 2D retention time of the MOSH and MOAH internal standards (Figure 2).
Figure 2: Reconstructed excel 2D plot on the basis of the 1D and 2D retention times of the MOSH and MOAH internal standard mixture in the FID and ToF-MS traces.
Classification and Template Match
The good retention time matches between the MS and the FID trace made it possible to create a template model based on both the enhanced separation power of the GC×GC and the reliable information obtained from the TOF-MS trace. The classification of the different chemical families (n- and i-paraffins, cycloalkanes, 1-ring, 2-ring MOAH) was created simply by drawing the edges of each class within the GC×GC-TOF-MS contour plot. The latter was then applied to the GC×GC-FID trace for quantification purposes (Figure 3).
Figure 3: Translation of the classification based on the MS trace onto the FID trace.
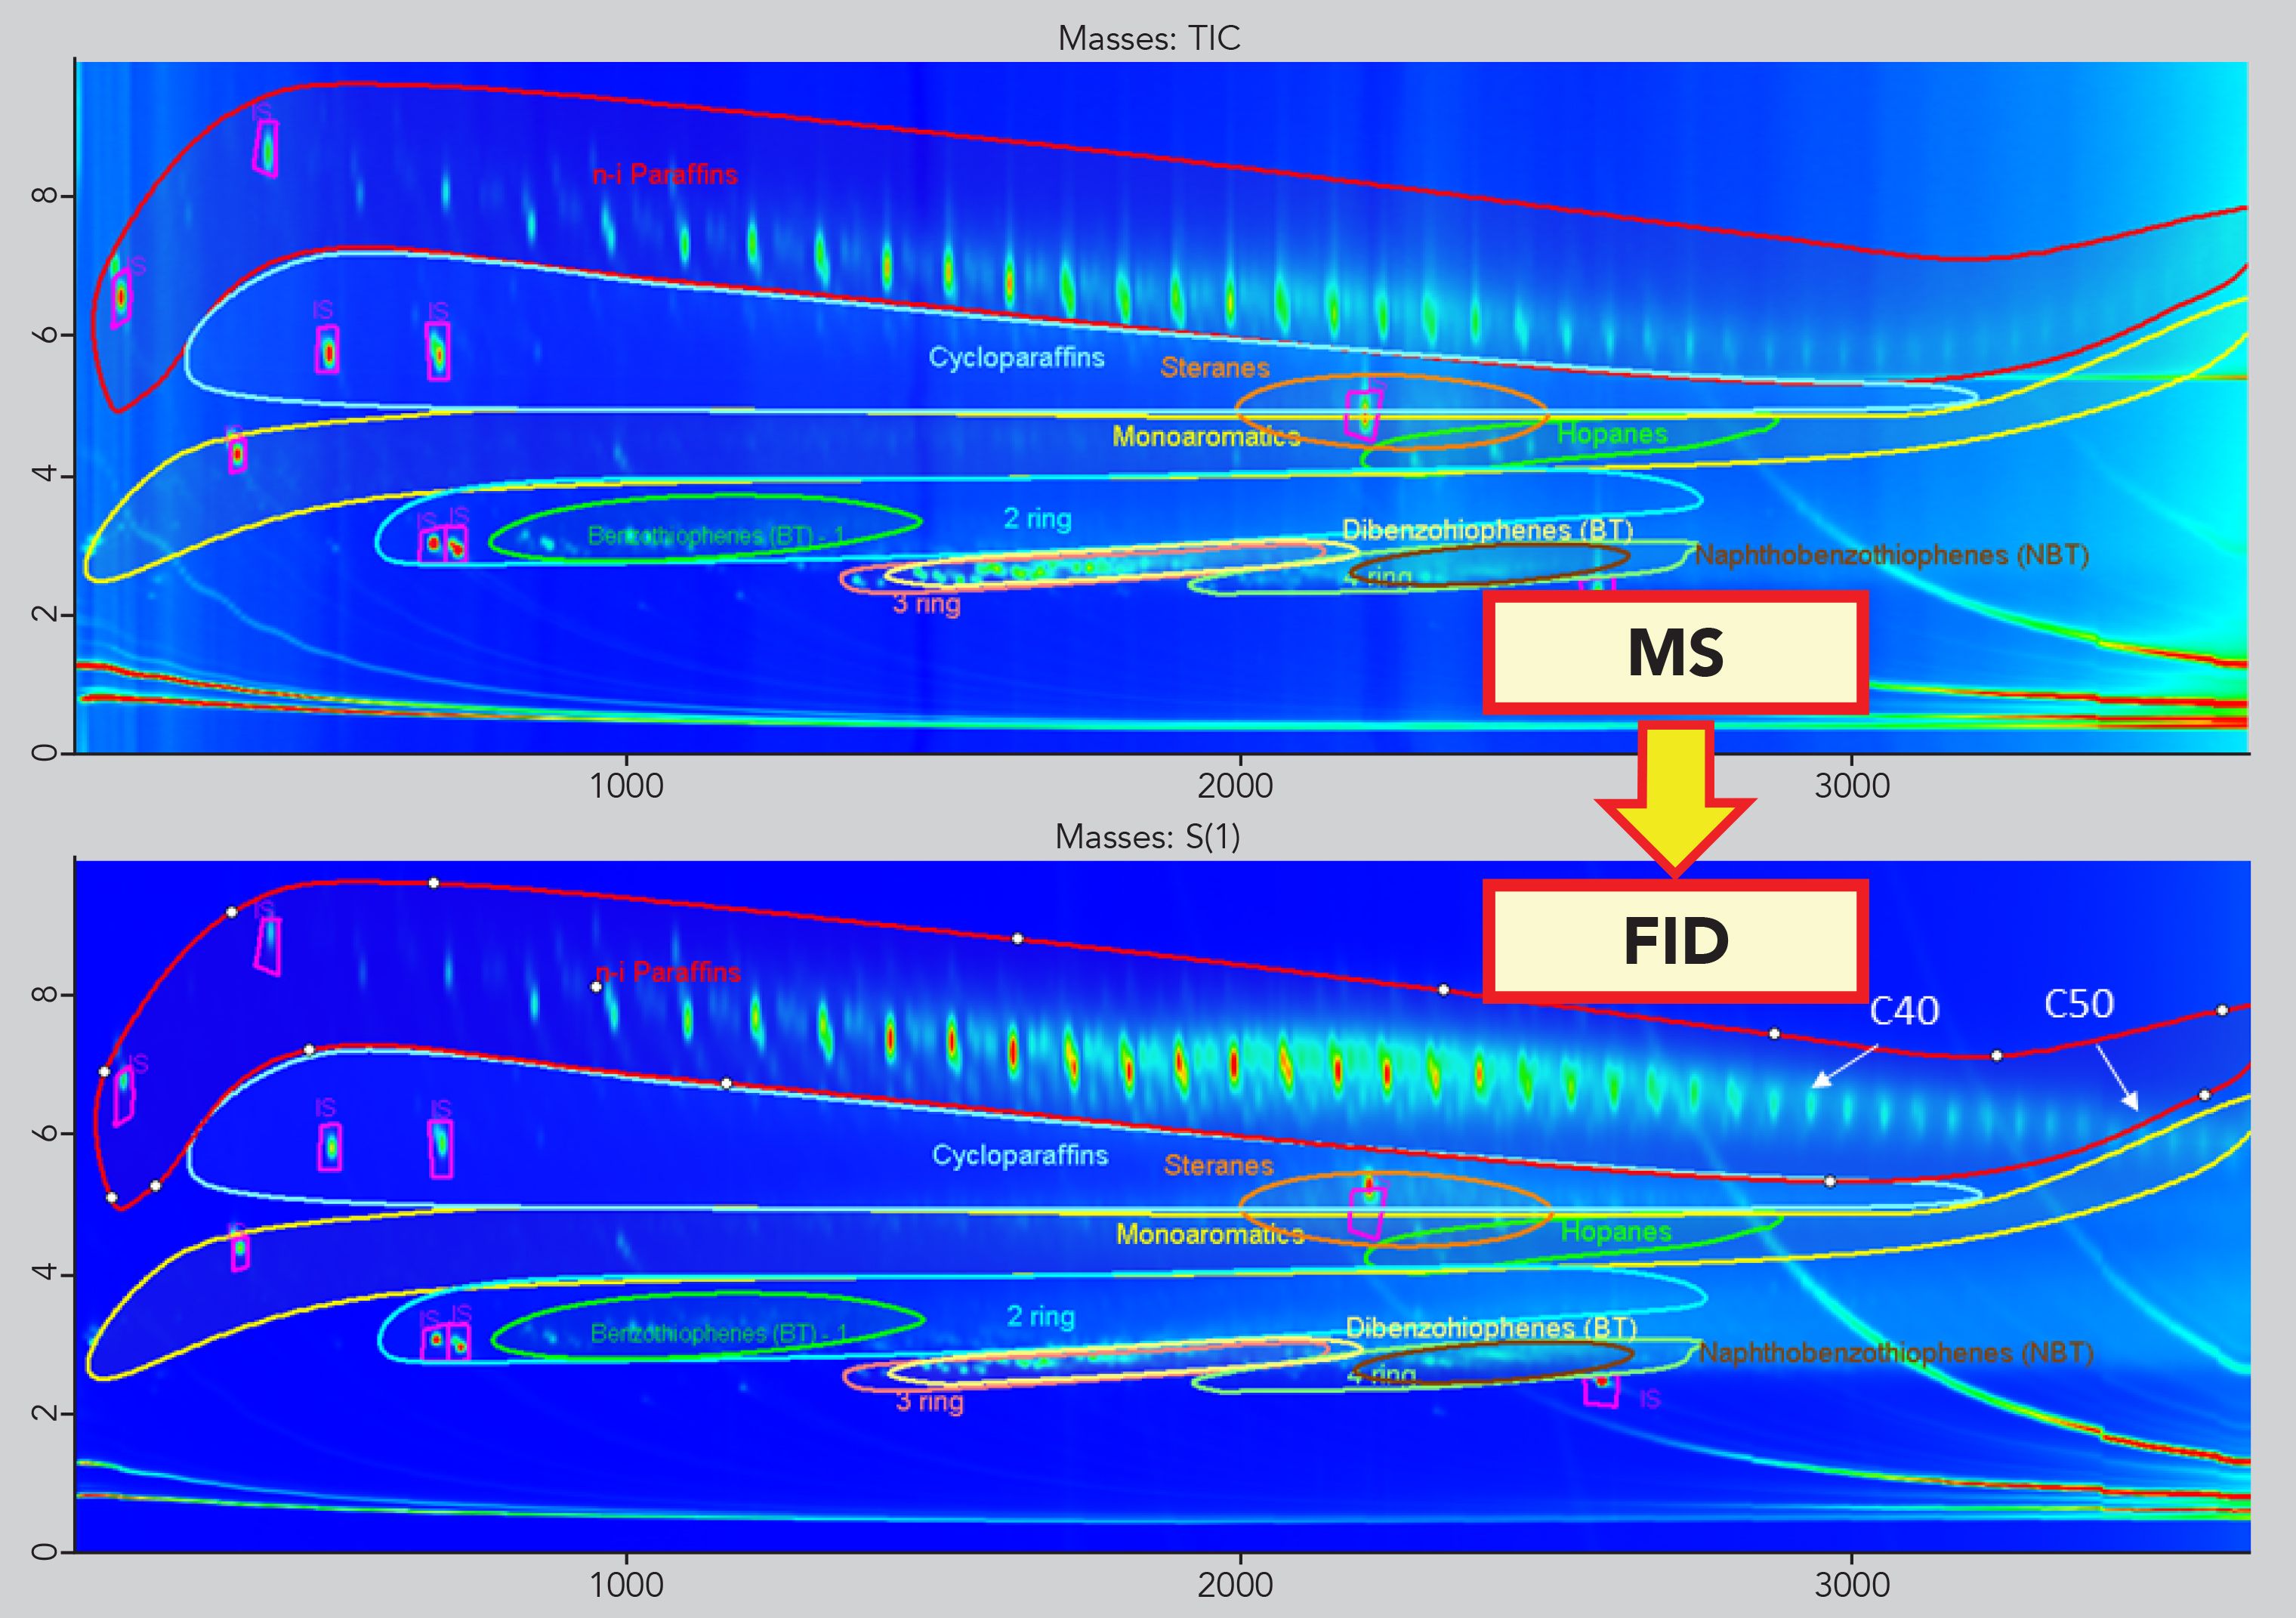
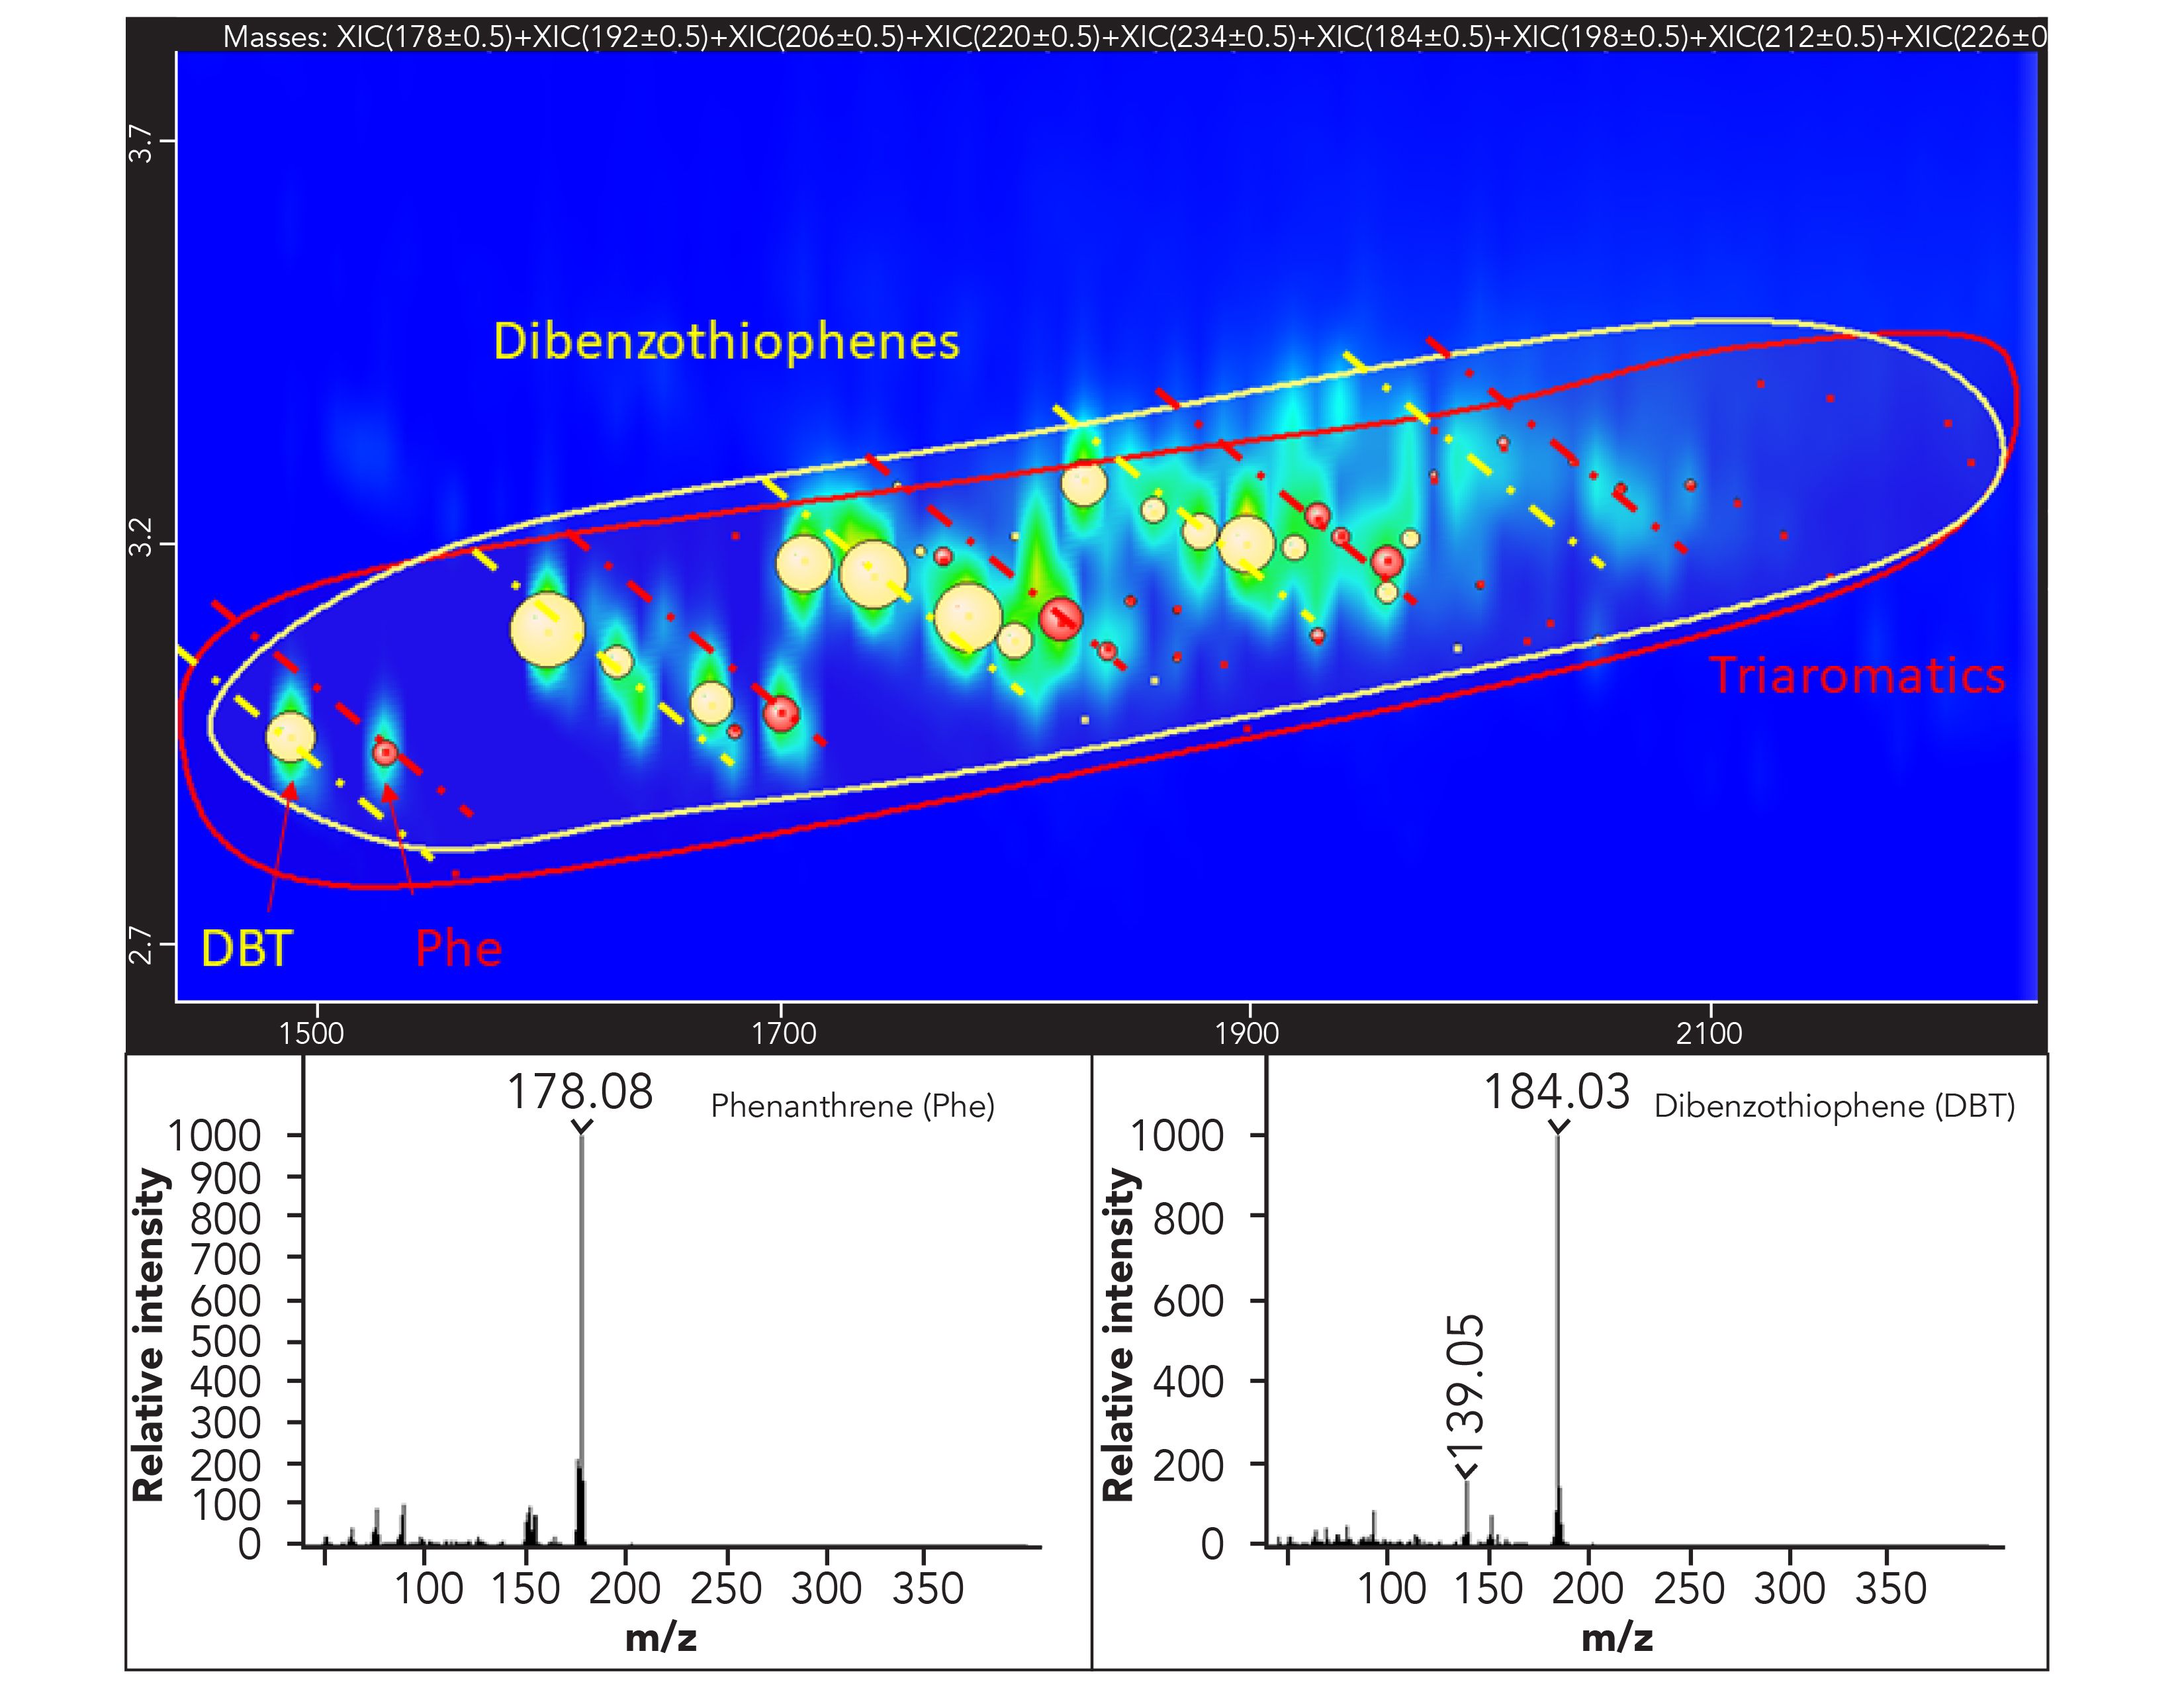
The idea behind the development of this strategy is to confirm the identity of the compounds of interest at the TOF-MS, but even more toexclude the presence of substances other than MOSH and MOAH that may lead to false positives or higher contamination values when examining the corresponding FID trace. In fact, when compounds other than the targeted ones are identified in the TOF-MS trace, the perfect retention time match with the FID trace allows to easily pick and remove them from the sum. This procedure can be simplified even more by applying an additional MS spectral filter based on custom-built spectral rules, such as the identification of a particular class of substances based on the presence of one or multiple diagnostic m/z or ion ratios. As an example, all the compounds belonging to the family of n-i-paraffins can be easily identified by their characteristic main fragments 43 m/z and 57 m/z. The same concept can be applied to as many as needed classes of components such as olefins, hopanes, steranes, dibenzothiophenes, DIPN, and terpenes. The extra filter was very useful in the case of classes of compounds eluted in the same 2D space, helping to quickly pinpoint the compounds belonging to one or the other class (Figure 4).
Figure 4: Expansion of the ion extracted 2D plot in the dibenzothiophenes (in yellow) and triaromatics (in red) area. The classification areas are depicted with the manually drawn ellipsis (yellow and red) and the class to which every single component belongs is depicted by bubbles with the corresponding color. The sub-nominal MS spectra for the two selected components are shown as well.
Application to Real-World Samples
The accurate determination of MOSH and MOAH in food is of high importance, since this contamination represents a concern from a toxicological viewpoint and an economic impact for food companies as well. Therefore, it is highly essential to avoid false positives to limit unnecessary alarmism. At the same time, as required by the EU, it would be beneficial to collect data on the occurrence of the different sub-classes within the MOSH and MOAH fractions, and to highlight the presence of possible markers of specific contamination sources to allow the stakeholders to take actions to prevent the contamination in the food chain. This last goal is challenging, because contamination may occur at different levels, from the raw materials to the final product and from primary or secondary packaging (2). The profile of the contamination may change during the processing of the food, making the identification of the source of contamination for corrective action very challenging. Moreover, a limited number of markers is known at present. Nevertheless, some consideration can be taken in this direction by carefully examining the results. For instance, the presence of POSH (deriving from plastic food contact material), as occurred in the spice sample, can be easily chromatographically separated in the GC×GC contour plot, without requiring expert evaluation of the LC–GC-FID trace and not causing possible overestimation of the amount of MOSH (Figure 5).
Figure 5: (a) LC–GC-FID and (b) GC×GC–MS traces of the MOSH fraction extracted from the spice sample.
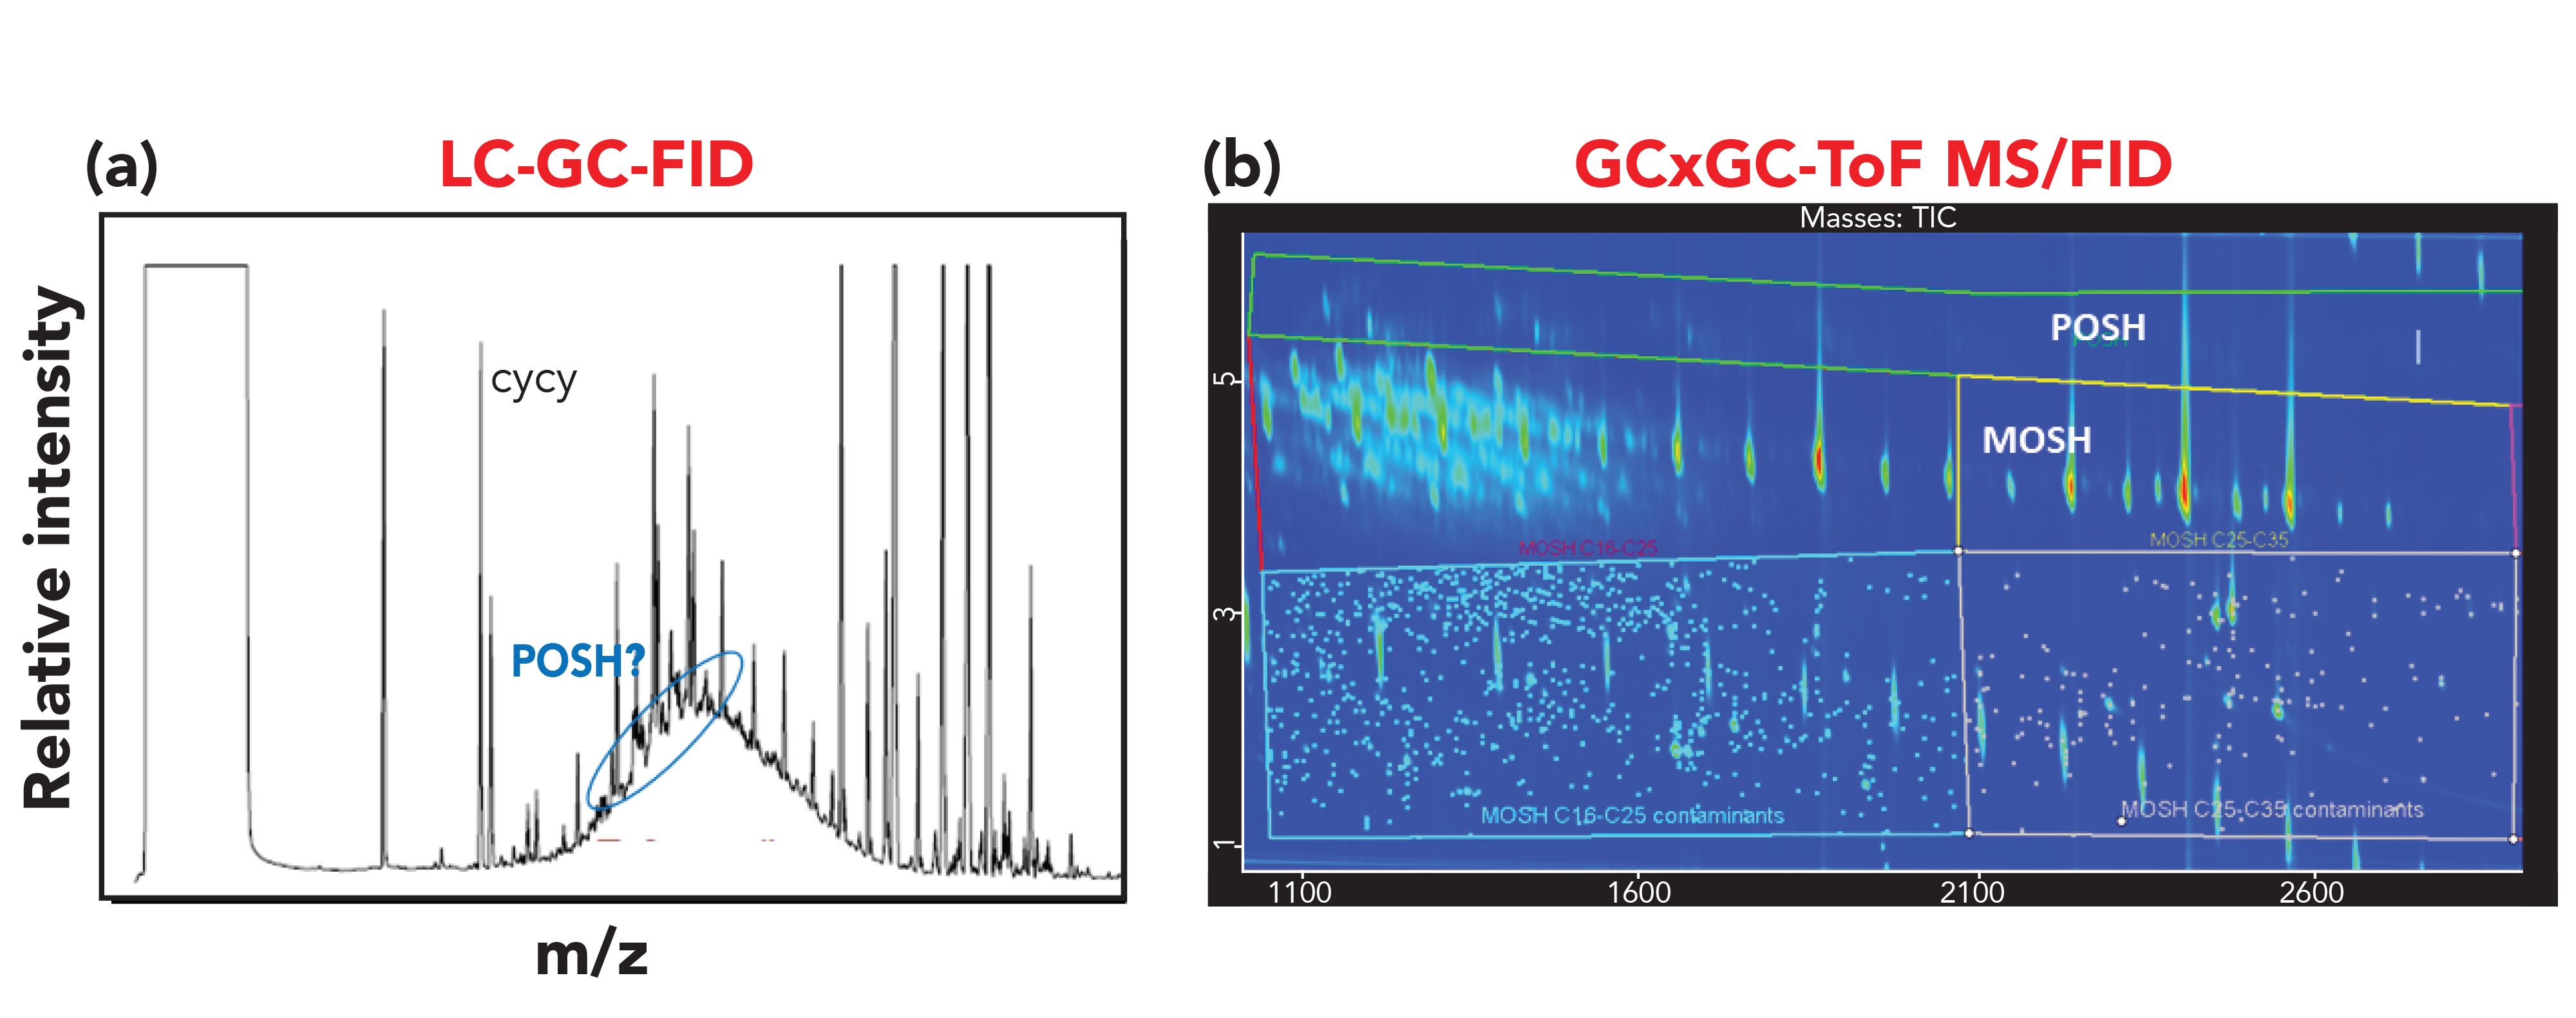
The coupling of the chromatographic separation with a sensitive MS instrument allowed us to simultaneously detect the presence of hopanes (a well-known marker of petrogenic origin [29]) in the MOSH fraction of the palm oil sample.
In the same way, analyzing the results obtained from the MOAH fractions, several factors can be considered. The presence of diisopropylnaphthalenes (DIPN, markers of contamination from recycled paperboard fiber) was easily highlighted in the LG–GC-FID trace, although no confirmation was possible. The GC×GC-TOF-MS information made it possible to confirm the identity of such markers and, moreover, the presence of sulfur compounds was detected, pointing toward jute bags as an additional source of contamination, both for the spice and the palm oil (Figure 6).
Figure 6: (a) LC-GC-FID and (b) GC×GC–MS traces of the MOAH fraction extracted from the spice sample. The presence of DIPN and sulfur compounds, markers of recycled paperboard, and jute bag contamination is highlighted in the box.
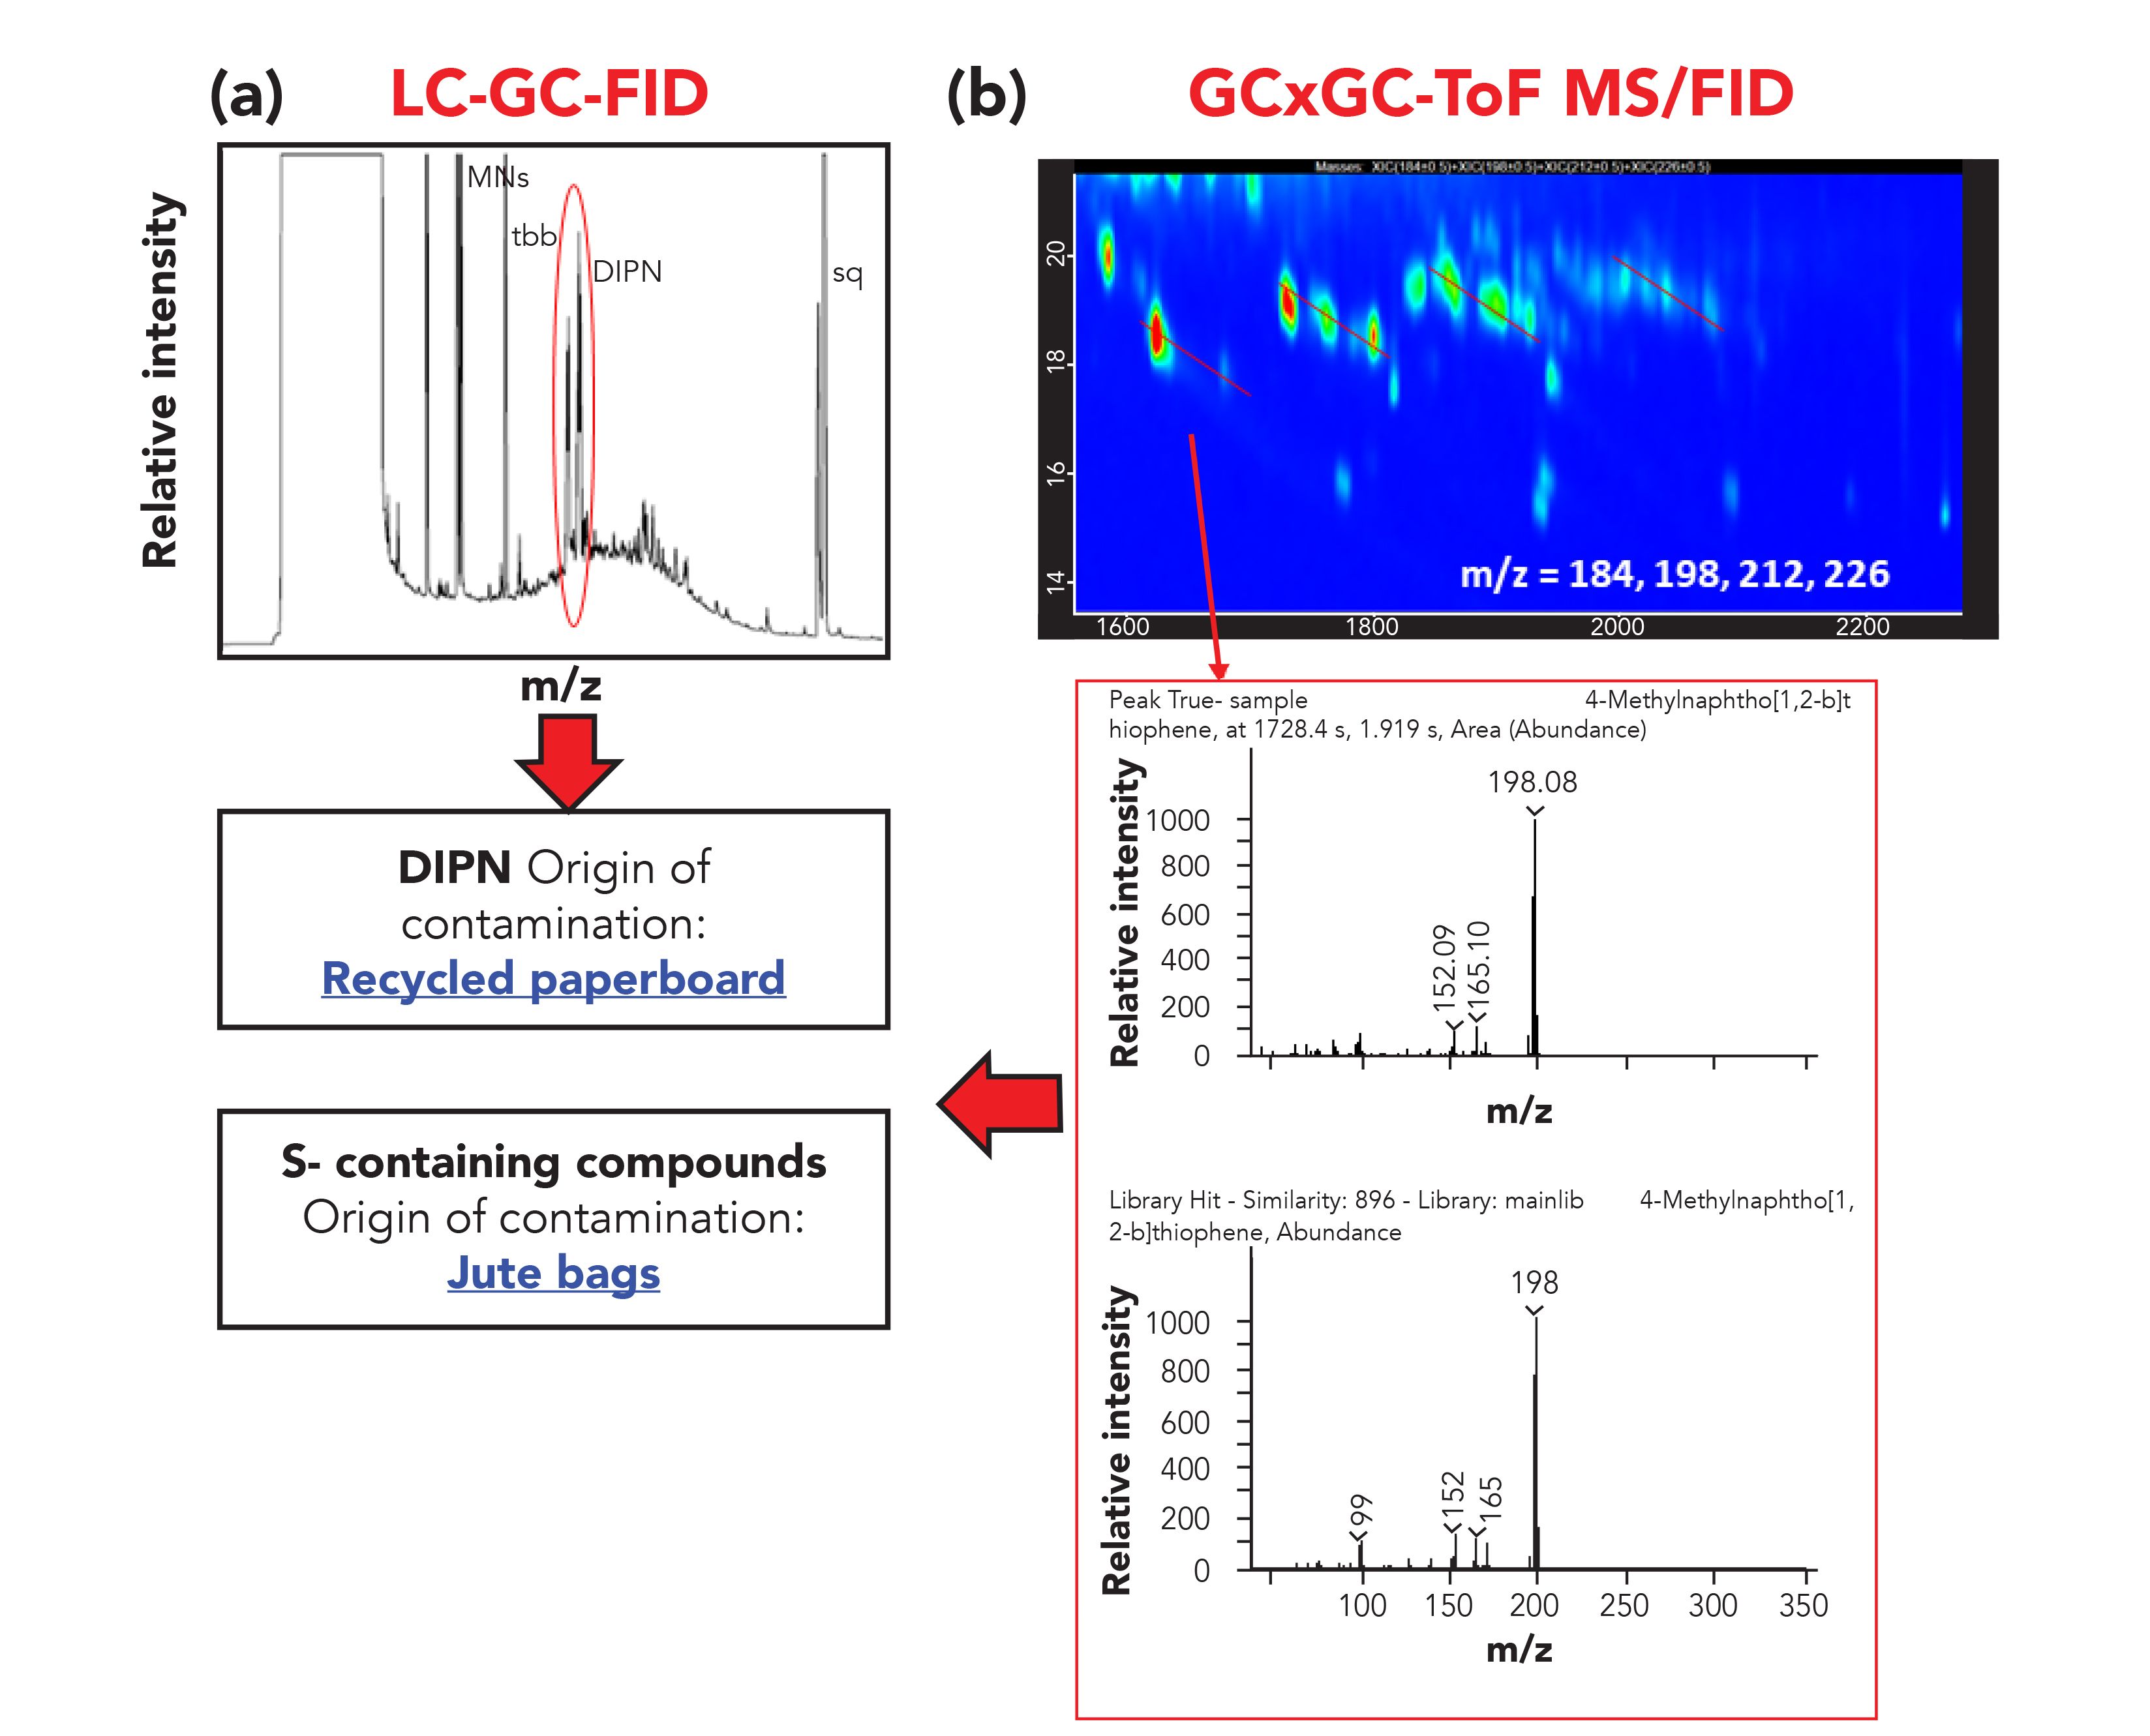
Regarding the palm oil sample, it underwent an additional purification step, namely epoxidation, to remove the presence of interferences such as carotenoids, terpenoids, and olefin, which generally sit on top of the MOAH hump. In the LC–GC-FID chromatogram, the MOAH UCM appeared smooth with a limited number of well-shaped peaks on top of the hump, leading to the conclusion that the interferences were removed and that only the remaining few peaks needed to be removed for accurate quantification of the MOAH. However, based on the information obtained from the classification and the MS spectral filter feature explained in section 3.2, few compounds were classified as diaromatic within the classification area (Figure 7). From a careful evaluation of the TOF-MS spectra of the peaks populating the 2D space in the diaromatic classification area (the most abundant class of MOAH present), although not a univocal and precise identification was possible, it was clear that the peaks were not only belonging to the MOAH fraction, but specifically to terpenoids.
Figure 7: Comparison of the LC–GC-FID chromatogram and the GC×GC-ToF-MS/FID of the MOAH fraction of the palm oil sample. The MS spectrum of a peak eluted in the diaromatic classification area of the chromatogram but not belonging to this class is highlighted in the box. Comparison of the LC–GC-FID chromatogram and the GC×GC-ToF-MS/FID of the MOAH fraction of the palm oil sample. The MS spectrum of a peak eluted in the diaromatic classification area of the chromatogram but not belonging to this class is highlighted in the box.
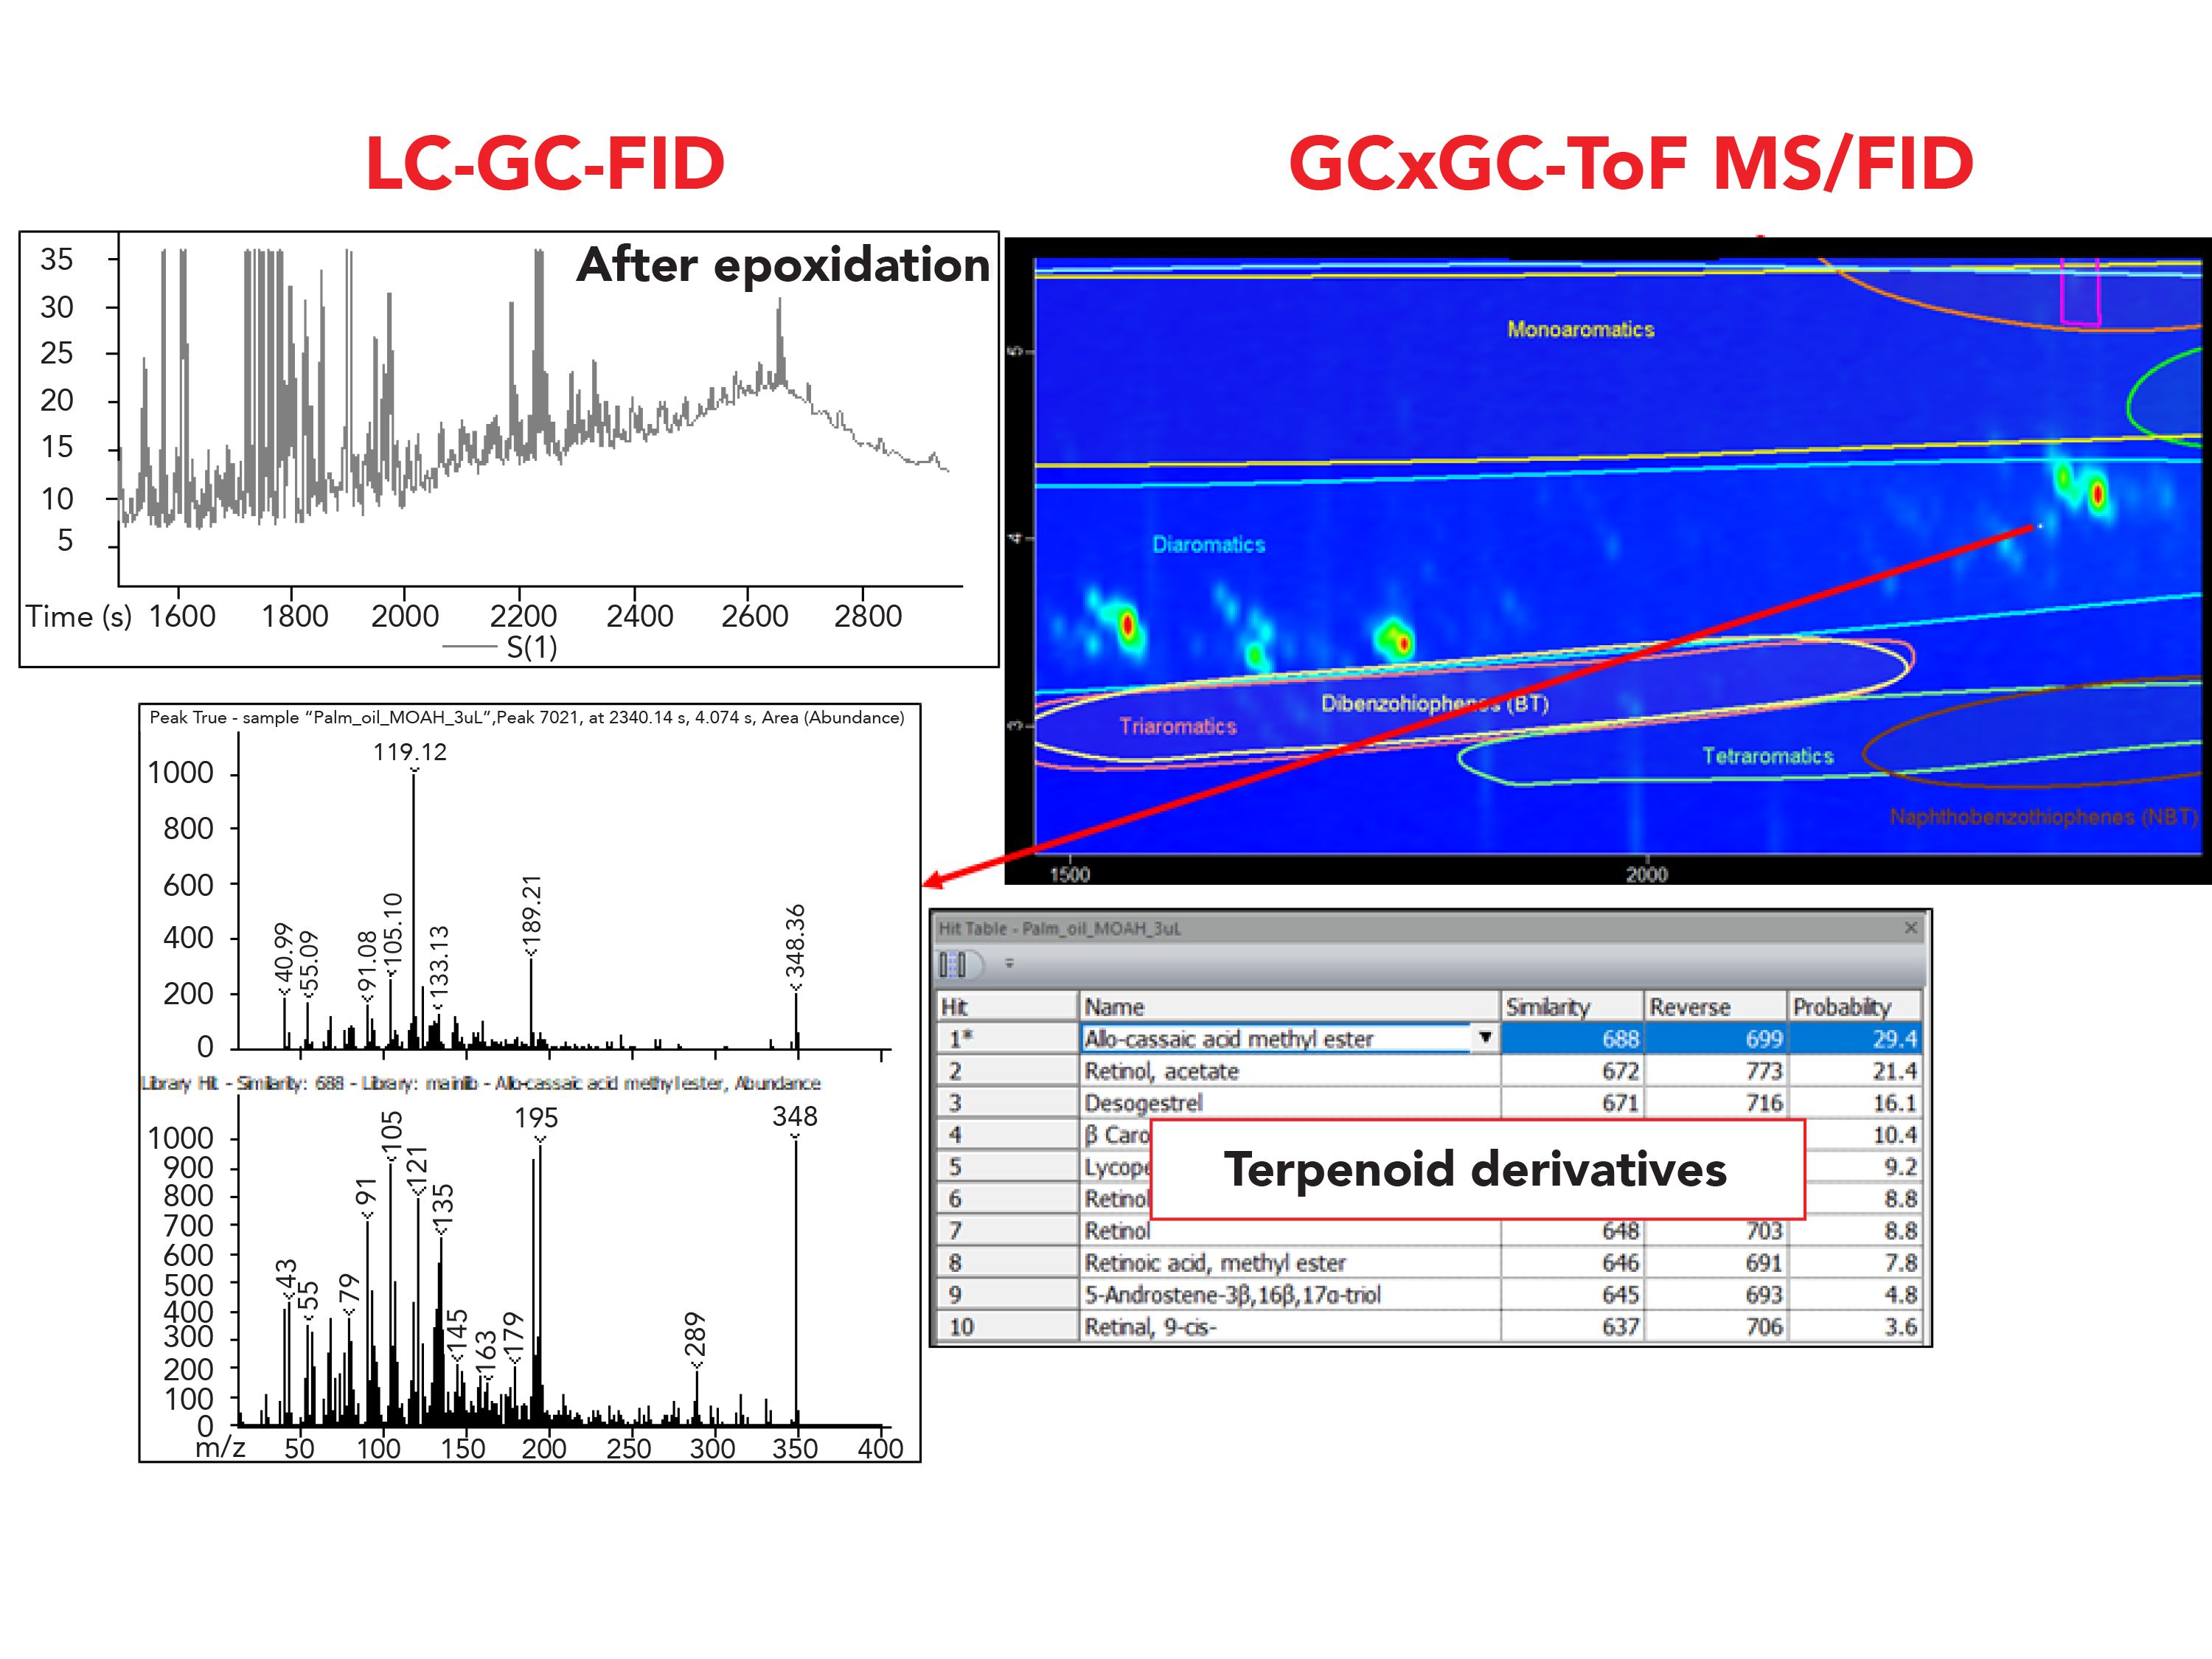
This is a particular critical finding, since it support an already open discussion on the efficiency of the epoxidation process and doubts on many possible false positives found after carrying out such an extra purification step, which is known to cause the loss of MOAH themselves at a certain extent but that seems also to not be efficient in the removal of the interferents in some specific circumstances that have not been determined yet.
Conclusion
This work is a proof-of-concept study to prove the capabilities of the use of a GC×GC-TOF-MS/FID system as a confirmatory method of the occurrence of MOSH and MOAH contamination in food. For the first time, a method able to maintain the chemical-structure of the 2D plot up to C50 was presented. Moreover, the ultimate goal will be to provide a method that can be used both for routine and confirmatory purposes. Research is ongoing to validate the quantification based on the GC×GC-FID trace, possibly corrected based on the information deriving from use of the TOF-MS instrument.
Acknowledgment
This work is partially supported by the Restek Academic Support Program (RASP) project. This article is based upon work from the Sample Preparation Task Force and Network, supported by the Division of Analytical Chemistry of the European Chemical Society.
References
- E. Panel and F. Chain, EFSA J.1 0(6) (2012).
- The German Federation of Food Law and Food Science, “Toolbox for Preventing the Transfer of Undesired Mineral Oil Hydrocarbons into Food. (2017) Retrieved from https://www.lebensmittelverband.de/de/lebensmittel/verpackung/mineraloeluebergaenge/toolbox-vermeidung-mosh-moah.
- R. Bevan, P. T. C. Harrison, B. Jeffery, and D. Mitchell, Food Chem. Toxicol.136, 110966 (2020).
- L. Barp et al., Food Chem. Toxicol. 72, 312–321 (2014).
- M. Biedermann et al., Sci. Total Environ. 506–507, 644–655 (2015).
- U. C. Nygaard et al., Food Chem. Toxicol. 123(October 2018), 431–442 (2019).
- Commission of the European Union, Off. J. Eur. Union L12(84), 95–96 (2017).
- S. Moret et al., Talanta 115, 246–252 (2013).
- G. Purcaro, L. Barp, and S. Moret, Anal. Meth. 8(29), 5755–5772 (2016).
- S. Moret, M. Scolaro, L. Barp, G. Purcaro, and L. S. Conte, Food Chem. 196, 50–57 (2016).
- S. Moret, L. Barp, G. Purcaro, and L. S. Conte, J. Chromatogr. A1243, 1–5 (2012).
- S. Moret, L. Barp, K. Grob, and L. S. Conte, Food Chem. 129(4), 1898–1903 (2011).
- K. Fiselier et al., J. Chromatogr. A1271 (1), 192–200 (2013).
- L. Barp, G. Purcaro, S. Moret, and L. S. Conte, J. Sep. Sci. 36(18), 3135–3139 (2013).
- P. Q. Tranchida et al., J. Chromatogr. A 1218(42), 7476–7480 (2011).
- G. Purcaro et al., Anal. Bioanal. Chem. 405(2–3), 1077–1084 (2013).
- European Parliament and the Council of the European Union, Off. J. Eur. Communities (L 221/8), 8–36 (2002). doi:10.1017/CBO9781107415324.004
- M. Biedermann and K. Grob, J. Chromatogr. A 1255, 56–75 (2012).
- L. W. Spack et al., Food Addit. Contam. Part A: Chem. Anal. Control. Expo. Risk Assess.34(6), 1052–1071 (2017).
- M. Biedermann et al., J. fur Verbraucherschutz und Leb. 12(4), 363–365 (2017).
- M. Biedermann and K. Grob, J. Chromatogr. A 1375, 146–153 (2015).
- G. Purcaro et al., Anal. Chim. Acta 773, 97–104 (2013).
- S. Bratinova and E. Hoekstra, Joint Research Center (JRC). Guidance on sampling, analysis and data reporting for the monitoring of mineral oil hydrocarbons in food and food contact materials. In the frame of Commission Recommendation (EU) 2017/84 (2019). doi:10.2760/208879
- L. Nicolotti et al., J. Chromatogr. A 1360, 264–274 (2014).
- D. Ryan, P. Morrison, and P. Marriott, J. Chromatogr. A 1071(1–2), 47–53 (2005).
- C. Cordero, P. Rubiolo, B. Sgorbini, M. Galli, and C. Bicchi, J. Chromatogr. A 1132(1–2), 268–279 (2006).
- G. Purcaro, C. Cordero, E. Liberto, C. Bicchi, and L. S. Conte, J. Chromatogr. A1334, 101–111 (2014).
- C. Cordero, C. Bicchi, M. Galli, S. Galli, and P. Rubiolo, J. Sep. Sci. 31(19), 3437–3450 (2008).
- M. Zoccali et al., J. Sep. Sci. 39(3), 623–631 (2016).
Sebastiano Pantòis with the LECO European Application and Technology Center (EATC), in Berlin, Germany. Maurine Collard and Giorgia Purcaro are with Gembloux Agro-Bio Tech in the University of Liege, in Gembloux, Belgium. Direct correspondence to: giopurcaro@gmail.com or gpurcaro@uliege.be

LIBS Illuminates the Hidden Health Risks of Indoor Welding and Soldering
April 23rd 2025A new dual-spectroscopy approach reveals real-time pollution threats in indoor workspaces. Chinese researchers have pioneered the use of laser-induced breakdown spectroscopy (LIBS) and aerosol mass spectrometry to uncover and monitor harmful heavy metal and dust emissions from soldering and welding in real-time. These complementary tools offer a fast, accurate means to evaluate air quality threats in industrial and indoor environments—where people spend most of their time.
NIR Spectroscopy Explored as Sustainable Approach to Detecting Bovine Mastitis
April 23rd 2025A new study published in Applied Food Research demonstrates that near-infrared spectroscopy (NIRS) can effectively detect subclinical bovine mastitis in milk, offering a fast, non-invasive method to guide targeted antibiotic treatment and support sustainable dairy practices.
Smarter Sensors, Cleaner Earth Using AI and IoT for Pollution Monitoring
April 22nd 2025A global research team has detailed how smart sensors, artificial intelligence (AI), machine learning, and Internet of Things (IoT) technologies are transforming the detection and management of environmental pollutants. Their comprehensive review highlights how spectroscopy and sensor networks are now key tools in real-time pollution tracking.