Determining Chromium, Iron, and Nickel in a Nickel-Based Alloy by X-ray Fluorescence Spectroscopy
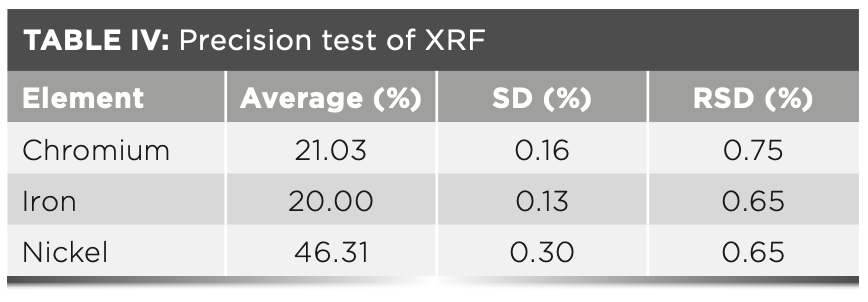
Nickel-based alloys have excellent corrosion resistance. They are also well-known for their mechanical properties, high temperature durability, and heat transfer performance. Because nickel-based alloys have these properties, they are widely used in creating nuclear safety level pressure equipment. It is the first-choice material for the heat exchanger tube plate and U-tube plate of the nuclear island steam generator, which has a profound impact on the safe operation of the reactor. Therefore, it is necessary to calibrate the main elements in nickel-based alloys. Accurate detection of the main elements in nickel-based alloys is important in ensuring the advancement of process research. A method for determining chromium, iron, and nickel in a nickel-based alloy by X-ray fluorescence spectroscopy is presented here. The detection range of chromium, iron, and nickel is 0.2–1.6 g/L, 0.2–2.3 g/L, and 0.5–3.3 g/L, respectively. After the three elements are corrected respectively, good correlation is obtained, R2 (chromium)= 0.999406, R2 (iron) = 0.999202, and R2 (nickel)= 0.999114. The relative standard deviations for chromium, iron, and nickel are 0.75%, 0.65%, and 0.65% respectively. The standard sample is tested to confirm the measured value is in agreement with the certified value.
Nickel-based alloys have high strength and oxidation resistance. At high temperatures, nickel-based alloys also have corrosion resistance. Nickel-based alloy materials are found regularly in nuclear reactor pressure vessels and steam generators. They are widely used in manufacturing reactor equipment and for building new equipment. There have been many reports on the structure and properties of chromium–iron–nickel (1–5) to understand their properties for better business production development (6–10). Accurate determination of the main elements in nickel-base alloys can provide strong data and technical support for chemical processes.
Currently, detection methods for nickel-based alloys include inductively coupled plasma–mass spectrometry (ICP-MS), graphite furnace atomic absorption spectroscopy (GFAAS), and high frequency combustion infrared (IR) absorption spectroscopy (AS). To achieve rapid and nondestructive detection, X-ray fluorescence (XRF) spectroscopy is used in a unique role to characterize the elemental composition of substances (11–16). XRF spectroscopy has become an important means of qualitative and quantitative analysis because of its simple sample preparation and its ability to analyze a wide range of elements. XRF has been widely used in many industries, such as the ore, chemistry, biology, environmental, and nuclear power fields (17–21).
The sample preparation methods of XRF mainly include three methods: powder, solid, and solution. The solution method is not limited by the shape of the sample, and can be used to determine the samples with the shapes of filaments and chips. Because the solution method is not limited by the shape of the sample, this method was used for detection in this study.
Theory
XRF spectroscopy utilizes primary X-ray photons or other excitation sources to illuminate the sample for analysis. After the inner electrons of the element in the sample are knocked out, the electrons outside transition. The transition process produces energy difference, which is released in the form of X-ray energy. The energy of electrons in each orbit is determined, so the energy difference caused by electron transition and the energy of X-ray released can also be determined. Quantitative analysis detection is the process of converting the measured intensity of the elemental analysis line of the sample into the elemental concentration. For infinitely thick samples, the analysis intensity is only related to the concentration of the analysis elements, so when the sample composition is simple, the analysis intensity and element concentration show a simple linear relationship. For complex samples, because of the existence of matrix effects, there is still a positive correlation between the elemental emission analysis intensity and the element concentration of the sample. However, the quantitative relationship is slightly more complicated and needs to be corrected.
Materials and Methods
Instrument and Working Parameters
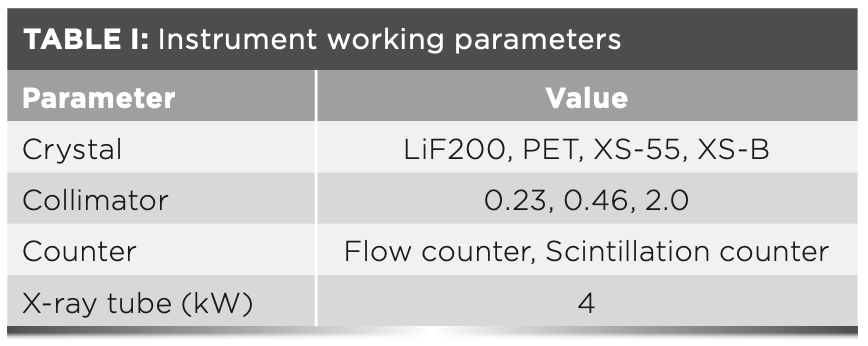
A S8 Tiger wavelength dispersive XRF spectrometer (Bruker) was used for this study. The instrument parameters are shown in Table I.
Materials
High purity iron (content >99.988%), chromium powder (purity: 99.95%), high purity nickel block (content: 99.999%), nitric acid (superior purity), hydrochloric acid (superior purity), nickel-based alloy standard samples BS H3C, IARM 53F, BS 690A, and B.S. 600-2; and ultrapure water (resistivity: 18.2 MΩ·cm) were used for this study. The above samples are national standard samples and analytical reagents.
Experimental Method
Preparation of Standard Solution Series
Because this experiment uses the solution method for detection and analysis, the nickel-based alloy can be detected only after the alloy is dissolved. Therefore, the standard curve is established with the standard solution of chromium, iron, and nickel, and the concentration range of the working curve is determined, according to the element content in the sample.
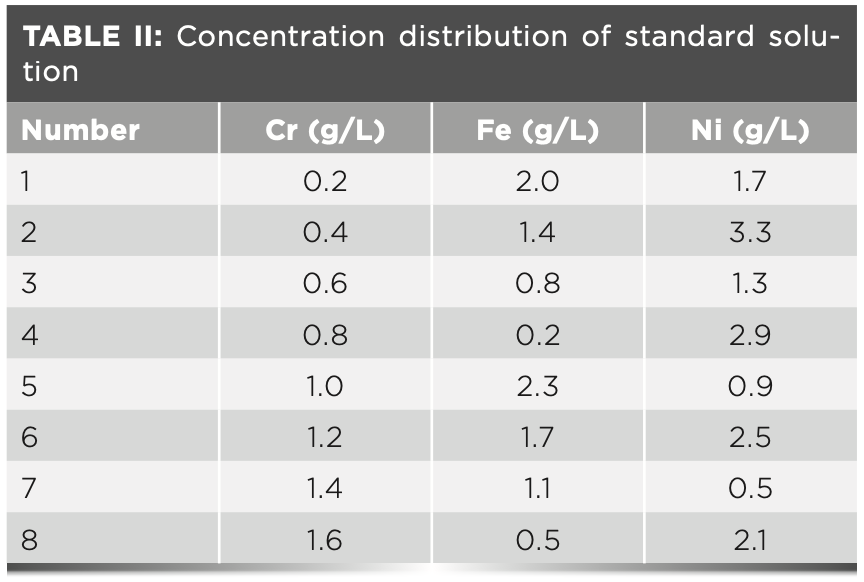
For the standard stock solution, a specific amount of chromium, iron, and nickel was weighed to prepare a 50 g/L standard stock solution. For the standard solution concentrations, the standard solution concentration of chromium is 0.2, 0.4, 0.6, 0.8, 1.0, 1.2, 1.4, and 1.6 g/L. The standard solution concentration of iron is 0.2, 0.5, 0.8, 1.1, 1.4, 1.7, 2.0, and 2.3 g/L. The standard solution concentration of nickel is 0.5, 0.9, 1.3, 1.7, 2.1, 2.5, 2.9, and 3.3 g/L.
Uniform design is an experimental design through a set of carefully designed tables. With this method, the concentration point has good dispersion. The concentration point distribution of the standard solution in columns 1, 3, and 4 (d = 0.2000) of uniform design test table U8 (85) is adopted, and the concentration distribution of the solution in the working curve is shown in Table II.
Sample Preparation
A certain amount of the nickel-based alloy standard sample is weighed and dissolved in hydrogen chloride (HCl) and nitric acid (HNO3), and the volume is fixed in a 50-mL volumetric flask. The mass concentration of ferrochromium and nickel can be calculated by mass and volume.
Sample Determination
The liquid sample was placed into the liquid cup for testing. Then, the power supply was turned on, cooling water, the P10 gas (10% CH4 and 90% argon), and helium. Next, the high-pressure generator was turned on. Once the generator was on, the instrument was measured after it was stable. The measuring conditions of the instrument are shown in Table III.

Results and Discussion
Determination of Working Curve of Chromium, Iron, and Nickel
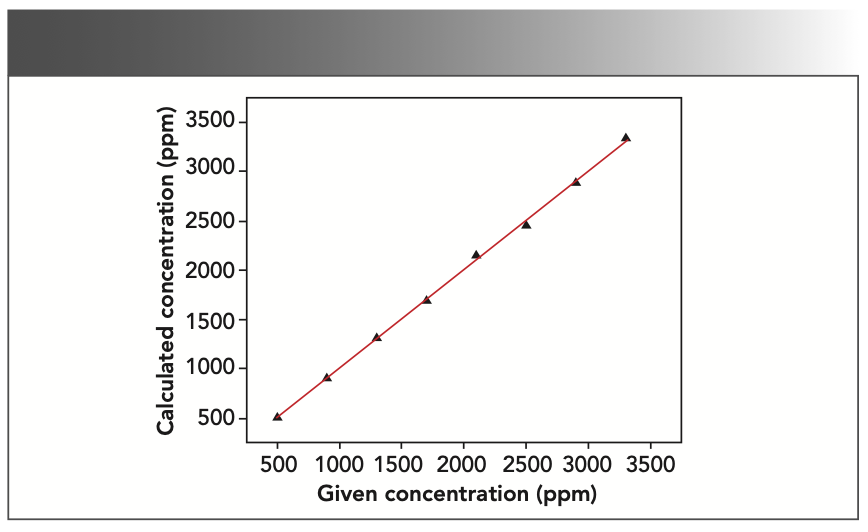
According to the properties of each element, the least absolute deviation and the best square R2 of the correlation coefficient are taken as the target to fit the data. In the chromium–iron–nickel system, there is an absorption enhancement relationship, where nickel can stimulate the signals of iron and chromium to create an enhancement effect. Chromium can absorb the signals of iron and nickel, and an absorption effect occurs when this happens. As a result, it was integral that the fitting curve was corrected so good measurement results could be achieved. The absorption enhancement effect between elements can be corrected by a coefficient correction. To get the minimum standard deviation, the appropriate correction method was selected in the SpectraPlus software. The element chromium was corrected by the fixed theoretical α coefficient, and the elements iron and nickel by the empirical α coefficient. The square of the correlation coefficient after correction is R2 (chromium)= 0.999406, R2 (iron) = 0.999202, and R2 (nickel)= 0.999114, respectively. The working curves of chromium, iron, and nickel are shown in Figures 1, 2, and 3.
FIGURE 1: Working curve of chromium (given vs. calculated concentration).
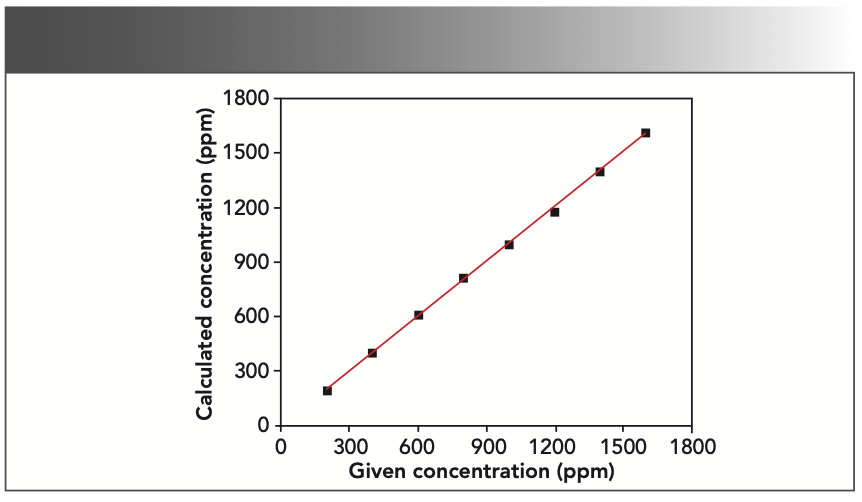
FIGURE 2: Working curve of iron (given vs. calculated concentration).
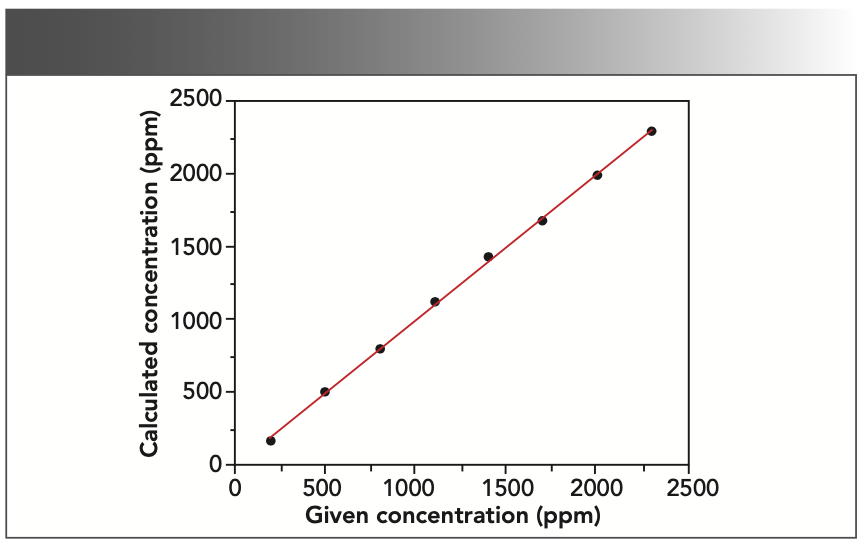
FIGURE 3: Working curve of nickel (given vs. calculated concentration).
Precision of Measurement Results
This method is used to carry out precision tests on nickel-based alloy standard samples, repeat the measurement 11 times, and produce statistics on the results. Table IV displays the results for the XRF precision test.
Accuracy of the Method
The method established by the XRF spectrometer needs to be verified for accuracy. The accuracy of the method can be verified by determining standard samples. This method analyzes the standard samples BS H3C, IARM 53F, BS 690A, and B.S. 600-2 to verify the reliability of the method. Table V shows that the measured value is similar to the certified value of the standard sample.

Conclusion
The sample prepared by solution method can be free from the limitation of sample shape. According to different elements, appropriate instrument parameters were selected to ensure accurate and stable measurement. The detection range of chromium, iron, and nickel is wide, which meets the requirements of detection and analysis. The method has good correlation. The square of correlation coefficient is R2 (chromium) = 0.999406, R2 (iron) = 0.999202, and R2 (nickel) = 0.999114, respectively. The result of precision measurement is satisfactory. The result of accuracy measurement shows that the measurement value is close to the certified value. It shows that the method has been successfully established, which lays a good foundation for future research.
References
(1) K. Leinartas, M. Samuleviien, A. Bagdonas, R. Juskenas, and E. Juzeliūnas, Surf. Coat. Technol. 168, 70–77 (2003). http://dx.doi.org/10.1016/S0257-8972(03)00003-3
(2) K. Leinartas, M. Samuleviien, A. Bagdonas, A. Sudaviius, V. Lisauskas, and E. Juzeliūnas, Electrochem. Commun. 3, 494–499 (2001). https://doi.org/10.1016/S1388-2481(01)00206-5
(3) M. Baeva, S. Neov, and R. Sonntag, Scr. Mater. 37, 1449–1452 (1997). https://doi.org/10.1016/S1359-6462(97)00322-9
(4) S. Jiang, D. Sun, Y. Zhang, and B. Yan, Metals, 8, 1–13 (2018). https://doi.org/10.3390/met8040217
(5) S. Shi, C. Chen, Z. Guo, G. Li, Y. Wu, M. Su, and H. Wang, Journal of Materials Engineering 47, 167–173 (2019). http://en.cnki.com.cn/Article_en/CJFDTotal-CLGC201904022.htm
(6) P. Yuan, F. Wei, X.Y. Chen, Y. Liu, and J.L. Tao, Chemical Engineering (China). 45, 12–16 (2017). http://en.cnki.com.cn/Article_en/CJFDTotal-IMIY201708003.htm
(7) J.L. Garin and R.L. Mannheim, Acta. Crystallogr. A. 63, S282–S283 (2007). https://journals.iucr.org/a/issues/2007/a1/00/a38160/a38160.pdf
(8) P. Liang and Y.X. Zhang, Corrosion Science and Protection Technology 23, 196–200 (2011). http://en.cnki.com.cn/Article_en/CJFDTOTAL-FSFJ201102023.htm
(9) C. Wang, J.U. Shaohua, S. Xun, J. Yan, B. Liang, and H. Chen, Materials Review. 23, 71–76 (2009). http://en.cnki.com.cn/Article_en/CJFDTOTAL-CLDB200903017.htm
(10) L.I. Ai-Lian, Z..C Guo, and G.L. Zhang, Electroplating & Pollution Control. 23, 1–7 (2003). http://en.cnki.com.cn/Article_en/CJFDTOTAL-DDHB200301000.htm
(11) D. Ren, J. Shen, S. Ren, J.H. Wang, and A.X. Lu, Spectrosc. Spect. Anal. 38, 3934–3940 (2018). http://en.cnki.com.cn/Article_en/CJFDTotal-GUAN201812053.htm
(12) C. Groskopf, S.R. Bennett, M.R. Gherase, and D.E.B. Fleming, Physiol. Meas. 38, 374–386 (2017). http://dx.doi.org/10.1088/1361-6579/aa513f
(13) F. Burille, J.J.M. Correa, P. Zambianchi, J.K. Zambianchi, and M. Antoniassi, Radiat. Phys. Chem. 167, 108374 (2020). https://doi.org/10.1016/j.radphyschem.2019.108374
(14) M. Sharkey, M.A. Abdallah, D.S. Drage, S. Harrad, and H. Berresheim, Sci. Total Environ. 639, 49–57 (2018). https://doi.org/10.1016/j.scitotenv.2018.05.132
(15) E. Kamilari, K. Farsalinos, K. Poulas, C.G. Kontoyannis, and M.G. Orkoula, Food. Chem. Toxicol. 116, 233–237 (2018). https://doi.org/10.1016/j.fct.2018.04.035
(16) A. Saha, K. Sanyal, N. Rawat, S.B. Deb, M.K. Saxena, and B.S. Tomar, Anal. Chem. 89, 10422−10430 (2017). https://doi.org/10.1021/acs.analchem.7b02427
(17) E.D. Pauw, P. Tack, M. Lindner, A. Ashauer, J. Garrevoet, B. Vekemans, G. Falkenberg, F.E. Brenker, and L. Vincze. Anal. Chem. 92, 1106–1113 (2020). https://doi.org/10.1021/acs.analchem.9b04176
(18) Y. Izumoto, T. Matsuyama, M. Mizuhira, H. Imaseki, T. Hamano, Y. Sakai, Y. Oguri, and H. Yoshii, J. Radiol. Prot. 38, 1384–1392 (2018). https://doi.org/10.1088/1361-6498/aae39b
(19) Y.N. Jolly, S. Iqbal, M.S. Rahman, J. Kabir, S. Akter, and I. Ahmad, Heliyon 3, e00403 (2017). https://doi.org/10.1016/j.heliyon.2017.e00403
(20) M.R. Gherase, R. Feng, and D.E.B. Fleming, Xray. Spectrom. 46, 537–547(2017). https://doi.org/10.1002/xrs.2792
(21) B.B.S. Jaswal, P.K. Rai, T. Singh, V. Zorba, and V.K. Singh, Xray. Spectrom. 48, 178–187 (2019). https://doi.org/10.1002/xrs.3010
Na Zheng, Zhanming Wang, Feng Zhao, Hongyu Li, Hanyi He, Guohua Wang, and Hongwu Sheng are with the Nuclear Power Institute of China, in Chengdu, China. Direct correspondence to: Zn1219@outlook.com ●
High-Speed Laser MS for Precise, Prep-Free Environmental Particle Tracking
April 21st 2025Scientists at Oak Ridge National Laboratory have demonstrated that a fast, laser-based mass spectrometry method—LA-ICP-TOF-MS—can accurately detect and identify airborne environmental particles, including toxic metal particles like ruthenium, without the need for complex sample preparation. The work offers a breakthrough in rapid, high-resolution analysis of environmental pollutants.
Advancing Corrosion Resistance in Additively Manufactured Titanium Alloys Through Heat Treatment
April 7th 2025Researchers have demonstrated that heat treatment significantly enhances the corrosion resistance of additively manufactured TC4 titanium alloy by transforming its microstructure, offering valuable insights for aerospace applications.