Determining High-Molecular-Weight Phthalates in Sediments Using GC–APCI-TOF-MS
Special Issues
Gas chromatography combined with atmospheric-pressure chemical ionization (APCI) was used to analyze high-molecular-weight phthalates.
The environmental analysis of phthalates is established and widespread with most classical methods based on gas chromatography–mass spectrometry (GC–MS). Recently, attention has turned to the analysis of di-isononylphthalate (DiNP) and di-isodecylphthalate (DiDP), but their analysis by GC results in an unresolved cluster of peaks that all predominantly fragment to the phthalic anhydride ion at m/z = 149. Consequently, quantification of DiNP and DiDP using the most abundant ion is impossible and the same sensitivity as for the single isomer phthalates cannot be reached. GC, combined with atmospheric-pressure chemical ionization (APCI), was used to analyze the high-molecular-weight phthalates. DiNP and DiDP were successfully ionized in proton transfer mode yielding spectra that contained the molecular ion as the base peak. The method was also applied to measure DiNP and DiDP in a sediment extract at relevant levels for environment samples.
The analysis of phthalates in environmental samples is an important application because some phthalates are considered to be potential endocrine-disrupting chemicals (EDCs) (1). Most classical environmental methods focus on the analysis of the dialkyl esters of phthalic acid ranging from dimethylphthalate (DMP) to dioctylphthalate (DOP) (2), among which di-isobutylphthalate (DiBP), dibutylphthalate (DBP), and bis(2-ethylhexyl)phthalate (DEHP) are the most important single isomer phthalates found in environmental samples (3,4). These solutes are single isomer compounds and relatively easy to analyze by gas chromatography–mass spectrometry (GC–MS) because only one peak for each compound is obtained by chromatographic analysis (5).
Using electron ionization (EI), the phthalic acid diesters strongly fragment, the most abundant ion being a phthalic anhydride ion at m/z = 149, common for all saturated alkyl phthalates (except DMP). This ion can be used for trace analysis in selected ion recording (SIR) mode, provided that the target solutes are well separated by GC (5).
More recently, attention has been paid to the analysis of di-isononylphthalate (DiNP) and di-isodecylphthalate (DiDP). These compounds are synthesized from phthalic acid and a mixture of C9 or C10 alcohols, respectively. Consequently, the GC analysis of these solutes results in a cluster of peaks corresponding to different branched isomers.
In the case of DiNP and DiDP determination, the C9 isomers present in commercial DiNP samples partially overlap with the C10 isomers present in DiDP. No column or temperature program conditions could be found to completely separate C9 from C10 isomers, making quantification of DiNP and DiDP using the most abundant ion at m/z =149 impossible. To differentiate DiNP and DiDP, another ion should be measured. This can be done using ions 293 and 307, respectively, corresponding to the M-alkyl ion (5). However, these ions are relatively low in abundance, and consequently, the same sensitivity as for the single isomer phthalates cannot be reached.
Possible solutions are offered by the use of soft ionization techniques, such as chemical ionization (using ammonia), or by liquid chromatography (LC)–MS. Recently, the combination of GC with atmospheric-pressure chemical ionization (APCI) became commercially available (6) and this technique was tested for the analysis of the high-molecular-weight phthalates. The method was also applied to measure DiNP and DiDP in a sediment extract from the Netherlands.
Experimental
Reference samples of DiNP (C26H42O4) and DiDP (C28H46O4) were obtained from BASF (Ludwigshafen, Germany). Individual stock solutions at 1000 ppm were prepared in cyclohexane. Calibration solutions containing DiNP and DiDP at the 1–10 ppm level were prepared by dilution in cyclohexane.
A sediment sample, obtained during an environmental study (4), was dried by lyophilization and a 10-g sample was extracted with 50 mL of cyclohexane in an ultrasonic bath. The extract was concentrated to 10 mL in a Zymark Turbovap system (Caliper Life Sciences, Teralfene, Belgium).
Analysis was performed on an Agilent 7890 GC (Palo Alto, California) coupled to a Waters Xevo QTOF MS system (Waters, Manchester, United Kingdom). Sample introduction was performed using a CTC GC-Pal autosampler (Basel, Switzerland) by means of a split–splitless injector. The MS system was operated in GC–MS mode using an atmospheric-pressure GC (APGC) source (Waters). Water was continually bled into the source during acquisition to promote proton transfer conditions.
The analysis used a 1-μL splitless injection at 300 °C with a 1.05-min purge delay. A 30 m × 0.25 mm, 0.25-μm df DB-5MS column was used (J & W Scientific, Folsom, California). The carrier gas was helium at a constant flow of 2 mL/min. The oven temperature program was as follows: 50 °C for 1 min, then 20 °C/min to 320 °C, hold for 2.5 min.
The instrument was tuned and calibrated using perfluorotripentylamine (FC 70) before acquisition, so that the resolution of the instrument was greater than 10,000 full width half maximum (FWHM). Exact-mass spectra were obtained (5 Hz) using a single-point lock mass (column bleed, m/z = 281.0517) infused into the source continuously during the temperature program.
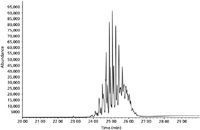
Figure 1: GCâEI-MS total ion chromatogram (TIC) obtained for a DiNP/DiDP mixture (10 ppm).
The MS system had a corona current of 4.0 μA, a sampling cone voltage of 10 V, and a source temperature of 140 °C. The cone gas was nitrogen at 30 L/h, the source auxiliary gas was nitrogen at 300 L/h, and the make-up gas was nitrogen at 300 mL/min. The GC interface temperature was 310 °C.
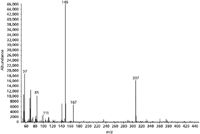
Figure 2: EI-MS spectrum of di-isodecyl phthalate (C28H46O4, MW = 446).
Results and Discussion
GC–EI-MS (Single-quadrupole system): A typical total ion chromatogram (TIC) obtained for the 10 ppm standard mixture of DiNP and DiDP using electron impact ionization (performed on a single quadrupole instrument) is shown in Figure 1. A complex cluster of DiNP and DiDP isomers is observed. The spectrum taken at 25.6 min, corresponding to the most abundant DiDP isomer, is given in Figure 2. The molecular ion at m/z = 446 (C28H46O4) cannot be detected and the main ions are at m/z =149 (phthalic anhydride, C8H5O3+) and 307 (M-C10H19).
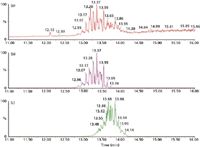
Figure 3: GCâAPCI-TOF-MS analysis of a 10-ppm standard mixture containing DiNP and DiDP. (a) TIC; (b) XIC at 419.316 (DiNP); (c) XIC at 447.347 (DiDP).
Differentiation of the two high-molecular-weight phthalates can only be completed by monitoring the ions at 293 (DiNP) and 307 (DiDP). However, because of the low abundance of these ions compared to the base peak, lower sensitivity is obtained, and, moreover, confirmation by a second ion is not possible.
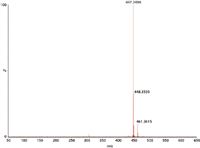
Figure 4: Proton-transfer APCI spectrum for DiDP (m/z = 447.3494 = [C28H46O4 + H]+).
GC–APCI-TOF: The analysis of the 10 ppm standard mixture was also performed using the conditions described in the experimental section. The TIC and the extracted ion chromatograms (XIC) at m/z = 419.316 (DiNP) and 447.347 (DiDP) are shown in Figure 3. The mass spectrum at 13.7 min (DiDP fraction) is shown in Figure 4. DiNP and DiDP give strong pseudomolecular ions, [M + H]+ with no fragmentation compared with EI ionization. The main ion in the spectrum of DiDP is at m/z = 447.3494, a deviation of 4.5 ppm from the theoretical value for [C28H46O4 + H]+. The XICs for DiNP and DiDP, included in Figure 3, show that partial chromatographic separation is possible between these two compounds. However, the XICs are needed to allow quantification. The exact-mass detection enhances selectivity and allows confirmation of the presence of the individual solutes. Interestingly, the spectrum for DiDP shown in Figure 4 also contains m/z = 461.3615, –3.5 ppm from the calculated mass of C29H49O4. This can probably be explained by the presence of mixed undecyl–decyl phthalates in the DiDP standard. If traces of C11 alcohols were present in the C10 alcohols used in DiDP synthesis, this would result in these impurities. Next, a sediment extract was also analyzed by GC–APCI-time of flight (TOF)-MS. The extracted ion chromatograms at 419.316 (DiNP) and 447.347 (DiDP) are given in Figure 5. Both solutes can be detected easily. It is, however, interesting to observe that the isomer distribution of DiNP and DiDP detected in the sediment sample are different from the standard mixture. Moreover, by using XICs at 433.332 and 461.363, additional phthalate solutes are detected. The masses correspond to C27H44O4 and C29H48O4, respectively, and are probably mixed C9/C10 and C10/C11 phthalates. At the end of each phthalate elution window, a single abundant peak is detected (for instance, at 13.74 min for DiNP and at 14.41 min for DiDP). These probably correspond to the linear di-C9 and di-C10 phthalates, respectively. The calculated concentrations of DiNP and DiDP in this sediment sample are 0.2 and 2 ppm, respectively.
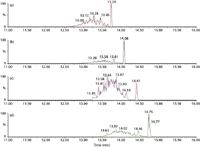
Figure 5: Detection of high-molecular-weight phthalatesin sediment sample by GCâAPCI-TOF-MS (a) XIC at 419.316 (DiNP); (b) XIC at 433.332 (C9/C10); (c) XIC at 447.347 (DiDP); (d) XIC at 461.363 (C10 /C11).
Conclusions
DiNP and DiDP were successfully ionized in proton transfer APCI, yielding spectra that contained the molecular ion as the base peak. These high-molecular-weight phthalates could be detected below 1 ppm in sediment samples using APCI by extracting exact-mass chromatograms. At least two additional phthalate moieties were also identified in the extracted sediment sample using exact-mass chromatograms. The calculated formulas C27H44O4 and C29H48O4 suggest mixed C9/C10 and C10/C11 phthalates, respectively. Good exact-mass calculation was obtained for all solutes, with mass errors less than 5 ppm. GC–APCI-TOF-MS therefore offers interesting perspectives for detailed characterization of high-molecularweight phthalates and for their sensitive and selective detection in environmental samples. The APGC source used allows all of the acquisition modes of tandem quadrupole and QTOF spectrometers to be used with a GC inlet combined with a soft ionization mechanism.
References
(1) S. Jobling et al., Environ Health Perspect. 103(6), 582–587 (1995).
(2) DIN EN ISO 18856.
(3) H. Fromme et al., Water Research 36(6), 1429–1438 (2002).
(4) W.J.G.M. Peijnenburg and J. Struijs, Ecotoxicology and Environmental Safety 63(2), 204–215 (2006).
(5) F. David et al., in Phthalate Esters, C.A. Staples, Ed. (Springer, Berlin, 2003), pp. 9–56.
(6) K. Worrall and P. Silcock, The Column 6(10), 3–6 (2010).
Frank David is R&D Manager at RIC, Kortrijk, Belgium and visiting professor at Ghent University, Belgium.
Pat Sandra is director of the Research Institute for Chromatography (RIC), Kortrijk, Belgium, professor in Separation Science at Ghent University, Belgium, and director of the Pfizer Analytical Research Centre-UGent, Belgium.
Peter Hancock is Technical Manager in the Chemical Analysis Business Operations team working for Waters Corporation, Manchester, United Kingdom, where he and his team are actively involved in developing analytical methods on new MS technologies in application areas such as food and environmental testing and chemical materials.
LIBS Illuminates the Hidden Health Risks of Indoor Welding and Soldering
April 23rd 2025A new dual-spectroscopy approach reveals real-time pollution threats in indoor workspaces. Chinese researchers have pioneered the use of laser-induced breakdown spectroscopy (LIBS) and aerosol mass spectrometry to uncover and monitor harmful heavy metal and dust emissions from soldering and welding in real-time. These complementary tools offer a fast, accurate means to evaluate air quality threats in industrial and indoor environments—where people spend most of their time.
NIR Spectroscopy Explored as Sustainable Approach to Detecting Bovine Mastitis
April 23rd 2025A new study published in Applied Food Research demonstrates that near-infrared spectroscopy (NIRS) can effectively detect subclinical bovine mastitis in milk, offering a fast, non-invasive method to guide targeted antibiotic treatment and support sustainable dairy practices.
Smarter Sensors, Cleaner Earth Using AI and IoT for Pollution Monitoring
April 22nd 2025A global research team has detailed how smart sensors, artificial intelligence (AI), machine learning, and Internet of Things (IoT) technologies are transforming the detection and management of environmental pollutants. Their comprehensive review highlights how spectroscopy and sensor networks are now key tools in real-time pollution tracking.