Differentiation Between Origins of Extra Virgin Olive Oils by GC-C-IRMS Using Principal Component Analysis, Linear Discriminant Analysis, and Hierarchical Cluster Analysis
The authors classify extra virgin olive oils from Portugal and Turkey using GC-C-IRMS to evaluate the isotope ratios of the fatty acid methyl esters (FAMEs) extracted from the oils.
Rapid and accurate chemical methods of food quality assurance are important for validation and the integrity of the products sold to consumers (1–3), Food quality standards vary internationally, thus, products shipped across international borders are particularly in need of a standardized method of quality assurance (4,5). One method to determine the origin of food products is isotope ratio mass spectrometry (IRMS). Due to isotopic fractionation, plants from different geographic regions exhibit different metabolic pathways and rates, thus, they will accumulate different isotope ratios of common elements (6). Plants have three different metabolic pathways to fix carbon during photosynthesis. We may distinguish between C3 plants, C4 plants, and CAM plants (crassulacean acid metabolism). Plants that survive solely on C3 fixation (C3 plants) tend to thrive in areas where both sunlight intensity and temperatures are moderate, carbon dioxide concentrations are around 200 ppm or higher, and ground water is plentiful. The C3 plants, which originated during Mesozoic and Paleozoic eras, predate the C4 plants and still represent approximately 95% of the Earth's plant biomass, including olive trees. C3 plants lose 97% of the water taken up through their roots to transpiration (7). The isotopic signature of C3 plants shows higher degree of 13C depletion than the C4 plants (8). CAM plants, such as cacti, can grow in dry environments and can resist little and irregular rainfall. The isotope ratio of an olive is not only influenced by metabolic pathways, but also by regional factors such as water-use efficiency.
Extra Virgin Olive Oils
The word virgin implies that the oil was produced by the use of physical, and not chemical, means. Extra-virgin olive oil (EVOO) comes from cold pressing of the olives, contains no more than 0.8% acidity (IOOC Standard), and is judged to have a superior taste. The expectation of extra-virgin and virgin olive oil is that they do not contain refined oil (9).
Chemical Composition of Olive Oils
Olive oils contain about 98–99% fatty acids, which are bonded in mono-,di-, and triesters of glycerol. Natural oils contain triglycerides as the major component (for example, 98%); trace amounts of diglycerides; and phytonutrients such as vitamins and antioxidants at 1–2% concentrations.
The most dominant fatty acids in olive oil are palmitic (16:0), palmitoleic acid (16:1), stearic (18:0), oleic (18:1), linoleic (18:2), and linolenic (18:3). These structures are given in Figure 1.
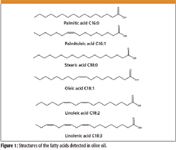
Figure 1
Because the polarity of the carboxyl group causes tailing under gas chromatographic (GC) separations with polar stationary phases, the acids usually are transformed chemically to fatty acid methyl esters (FAMEs). Therefore, the polarity and tailing is reduced and the separation can be achieved in an appropriate time window.

Figure 2
GC–C-IRMS
The differences in carbon isotopic abundances result from the different growing locales and seasons. The analyzed samples representing the different olive oils cannot be distinguished to the point of geographical origin by GC analysis itself. According to the results, the FAME profiles of the two oils were not distinguishable by their chromatograms. Therefore, IRMS was used to distinguish between the olive oils by measuring isotope ratio differences that arise from different regional influences for each FAME (for example, different atmospheric carbon dioxide concentrations and water-use efficiency). The FAMEs from the oils were evaluated with respect to their isotope ratios, and then statistically compared using two-way analysis of variance (ANOVA).
The isotope ratio δ is usually measured relative to a standard reference material. For this study, values were normalized to the carbon from carbonate in the shells obtained from Vienna Pee Dee Belemnite (VPDB). The δ is calculated as

for which RSample is the abundance ratio of the heavier isotope to the lighter isotope (for example, 13C/12C). The RStandard values usually are selected because they represent a stable material that is highly enriched in the heavier isotope. Most substances are depleted with respect to the heavy isotope in comparison to the standard, and therefore δ values less than zero are expected (10).
Experimental
Materials
Six bottles of commercial extra virgin olive oils (New Market, Athens, Ohio) were purchased: three bottles of "Azeite de Oliveira Virgem Extra" (origin: Portugal) and three bottles of "Sultan 100% Extra Virgin" (origin: Turkey). The color of the Portuguese oils varied noticeably. The first bottle (A1) was yellow-clear while the other bottles (A2 and A3) could be described as yellow-green. Oil from each bottle was analyzed as a separate sample. A Triglyceride C16-C22 Standard Mix (LA83308, Supelco, Bellefonte, Pennsylvania) was used to help identify the fatty acids.
Sample preparation
For the preparation of the FAMEs, the AOAC method (11) was modified as follows: 0.5 g of the oil sample was weighed into a 30-mL vial; 5 mL of 0.5 M methanolic sodium hydroxide solution was added for saponification and heated to 60–70 °C for 10 min. Then 4 mL of 14% BF3 in methanol was carefully added to the vials (attention: strong bubbling occurs!) and heated at the same temperature for another 10 min.
The solutions were stirred periodically with a glass rod. After cooling to room temperature, the oily drops in the solution disappeared. The FAMEs were extracted three days later. The samples were stored in glass screw cap vials and secured with Parafilm.
For the extraction 10 mL of saturated sodium chloride solution and 5 mL of n-hexane (reagent grade) were added to the sample vials. The organic phase was separated from the aqueous and transferred to another 5-mL vial. A spatula of anhydrous sodium sulfate was added to the vial to remove any residual water. The organic phase was then decanted into a new 5-mL vial, sealed with a screw-cap, wrapped with Parafilm, and stored in a freezer.
GC–C-IRMS
GC–MS analyses were performed using a GC system (Trace GC, Thermo Finnigan, Waltham, Massachusetts) with an IRMS detector (Delta plus Advantage, Thermo Finnigan, Waltham, Massachusetts). The GC effluent was split using a low-dead-volume X-connector so that approximately 10% of the effluent flowed to the single quadrupole mass spectrometer for structural elucidation and 90% to the IRMS system for isotopic analysis. The GC effluent was directed into a combustion oven to convert the organic materials to carbon dioxide before ionization. In GC–IRMS with combustion (GC–C-IRMS), ion chromatograms of three isotopic peaks are collected by three individual ion collectors with different sensitivities — that is, m/z 44 (12C16O2), the isobaric ions m/z 45 (13C16O2 and 12C16O17O), and m/z 46 (12C16O18O). Samples were injected using an autosampler (AS3000, Thermo Finnigan, Waltham, Massachusetts). The data acquisition was accomplished with the standard software of the instrument Isodat 2.0 (Thermo Finnigan, Waltham, Massachusetts). Table I shows the parameters used in the GC analyses.
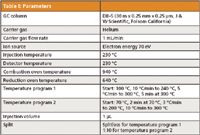
Table l: Parameters
Different temperature programs were used to achieve the best separation results. While the chromatographic peaks of methyl palmitoleate and methyl palmitate could be measured with good resolution (Rs = 1.9) by applying temperature program 1 and splitless injection, methyl linoleate, methyl oleate, and methyl stearate could not be resolved at these conditions. To achieve separation for those substances, temperature program 2 and a split ratio of 1:10 was used.
Due to a high concentration of methyl oleate, the combustion chamber was flushed with He for 830 s after the injection while using temperature program 1 to reduce the concentration of CO2 entering the reduction oven. The flush was turned off after 1820 s for the remaining duration of the run. When applying temperature program 2, the combustion chamber did not need to be flushed to limit the CO2 from entering into the reduction oven because the injection was split with a 1:10 ratio.
Results
Quantitative determination of major components
The contents of the olive oils were quantified relatively using the peak areas. These results are reported in Table II.

Table ll: Average relative quantities of olive oil components with 95% confidence intervals
Two-way analysis of variance
A total of four FAME Peaks were observed. Unfortunately, only three peaks gave reproducible isotope ratios. The three peaks correspond to the FAMEs methyl palmitoleate, methyl palmitate, and methyl oleate.
The first evaluation compared the isotope ratios of the three FAME peaks. If the peaks do not vary significantly they would not be useful for multivariate methods like PCA or LDA.
The other factor that was studied was whether the oils from two different origins had different or similar isotope ratios. Two-way ANOVA was applied to investigate the differences among the three FAME peaks and two geographical sources. The results were calculated by MS Excel and are presented in Table III.

Table lll: Two-way ANOVA for peaks, geographic origin (oils), and interaction
The factors of peaks and origins were significantly different at a 95% level of significance. Interaction between these two factors was insignificant.
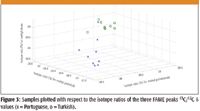
Figure 3
Principal component analysis
Figure 3 gives the distribution of olive oil samples with respect to the isotope ratios of the three FAMES. One can see from this figure that by using only a single isotope ratio that the two geographic regions cannot be resolved. Figure 4 is a plot of the principal component scores. The scores can be understood as a linear combination of the pretreated isotope ratios, while the loadings express the relative weighting of the isotope ratio. Before PCA, the data were normalized to unit vector and mean-centered. The scores of the Portuguese oils formed a larger cluster than the Turkish oils. The Portuguese oils varied with respect to color as well, and their isotope ratios were less precise, as presented in Table IV.
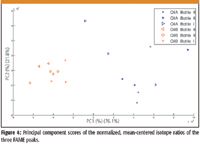
Figure 4
Additionally, the Turkish oil isotope ratios clustered by bottle, whereas the Portuguese oils did not. ANOVA was used with one factor as the geographic region and the other factor was the three different GC peaks. In Table III, the results indicate that each GC peak and corresponding FAME gave a different isotope ratio. Interaction was not significant, so the isotope ratios for each peak and oil combination did not vary significantly.

Table lV: Average δ values of methyl ester peaks and 95% confidence intervals.
Hierarchical cluster analysis
The measured isotope rations were now used to calculate the Euclidean distance matrix. A MATLAB script was written to draw a dendrogram using an average linkage algorithm. The dendrogram is given in Figure 5.
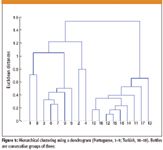
Figure 5
Good clustering is achieved from the isotope ratios among the two olive oils. The isotope ratios were not distinct for each bottle.
Linear discriminant analysis
Linear discriminant analysis calculates a linear function of the variables D, which maximizes the ratio of the between-group variance to the within-group variance. Geometrically, the discriminant is a line through the clusters of points, such that the projections of the points of the two groups are separated as much as possible (Figure 6) (13).

Figure 6
LDA (14) was used to establish collected classifier for the olive oils. The following model (15) was applied to discriminate between the two geographic origins of the oils:
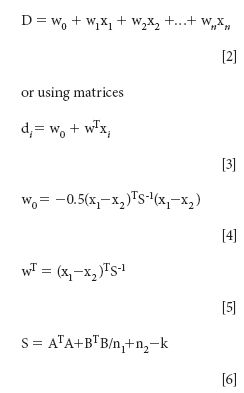
X: Training set matrix (isotope ratios of FAMEs)
w: Weights of the variables
w0: Bias value (should equal zero for standardized data)
x: Sample mean vectors, that describe the location of the centroids in
m: Dimensional space of each class
S: Pooled variance-covariance matrix
n1: Number of objects in class A
n2: Number of objects in class B
A: Data matrix of A isotope ratios
B: Data matrix of B isotope ratios
k: Number of classes
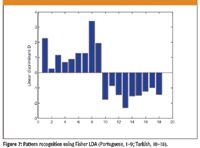
Figure 7
This leads to the following linear discriminant function (7), where x1, x2 and x3 represent the standardized 13C/12C isotope ratios from each FAME peak (w0 = 0). If di is greater than zero, the sample belongs to the class A, while a smaller linear discriminant than zero indicates membership of class B (Figure 7).

Conclusion
The results show that classification between extra virgin olive oils of different origins is possible and applicable by isotope ratio mass spectrometry of the FAMEs. It was shown that by modeling three different FAME peaks, enhanced resolution of the geographic origin was obtained relative to using the total isotope ratio of the oil.
The major component, oleic acid, was so large relative to the other fatty acids, that it sometimes caused problems with the reduction oven. Selective extraction methods of the FAME headspace might prevent this FAME from saturating the reduction oven.
Acknowledgment
The study was supported by Ohio University, The Center for Intelligent Chemical Instrumentation, and NSF grant number 0745590 (GPJ). A.B. is thankful for the ISAP exchange program (DAAD, Germany) between Leipzig University, Germany and Ohio University, which together funded a travel abroad program.
Andreas Baum, Yao Lu, Zeland Muccio, Glen P. Jackson, and Peter B. Harrington are with the Department of Chemistry and Biochemistry, Ohio University, Athens, Ohio.
References
(1) M. Jalali-Heravi, J. Chromatogr., A, 1114, 154–163 (2006).
(2) T. Galeano Diaz, Food Control 16, 339–347 (2005).
(3) D.-S. Lee, Anal. Chim. Acta 429, 321–330 (2001).
(4) B. Ozen, Food Chemistry 116, 519–525 (2009).
(5) O. Galtier, Anal. Chim. Acta 595, 136–144 (2007).
(6) F. Camin et al., Food Chemistry doi:10.1016/j.foodchem.2008.04.059 (2008).
(7) J.A. Raven and D. Edwards, J. Experimental Botany 52, 90001 (2001).
(8) S.A. Macko, Chemical Geology 152 151–161 (1998).
(9) http://en.wikipedia.org/wiki/Extra_Virgin_Olive_Oil, accessed 08/11/08
(10) J.E. Spangenberg, S.A. Macko, and J. Hunziker, J. Agric. Food Chem. 46(10), 4179–4184 (1998).
(11) M. Tsimidou and D. Boskou, "Adulteration," in Encyclopedia of Analytical. Science, Vol. 1, A. Townshend, Ed. (Academic Press, London, United Kingdom, 1995).
(12) B.G.M. Vandeginste, D.L. Massart, and L.M.C. Buydens, Handbook of Chemometrics and Qualimetrics: Part A (Elsevier Science B.V., 1998).
(13) B.G.M. Vandeginste, D.L. Massart, and L.M.C. Buydens, Handbook of Chemometrics and Qualimetrics: Part B (Elsevier Science B.V., 1998).
(14) D. Coomans, M. Jonckheer, D.L. Massart, I. Broeckaert, and P. Blockx, Anal. Chim. Acta, 103 (1978).
(15) G. McLachlan, Discriminant Analysis and Statistical Pattern Recognition (Wiley, New York, 1992).
(16) J.E. Spangenberg and N. Ogrinc, J. Agric. Food Chem. 49(3), 1534–1540 2001.

LIBS Illuminates the Hidden Health Risks of Indoor Welding and Soldering
April 23rd 2025A new dual-spectroscopy approach reveals real-time pollution threats in indoor workspaces. Chinese researchers have pioneered the use of laser-induced breakdown spectroscopy (LIBS) and aerosol mass spectrometry to uncover and monitor harmful heavy metal and dust emissions from soldering and welding in real-time. These complementary tools offer a fast, accurate means to evaluate air quality threats in industrial and indoor environments—where people spend most of their time.
NIR Spectroscopy Explored as Sustainable Approach to Detecting Bovine Mastitis
April 23rd 2025A new study published in Applied Food Research demonstrates that near-infrared spectroscopy (NIRS) can effectively detect subclinical bovine mastitis in milk, offering a fast, non-invasive method to guide targeted antibiotic treatment and support sustainable dairy practices.
Smarter Sensors, Cleaner Earth Using AI and IoT for Pollution Monitoring
April 22nd 2025A global research team has detailed how smart sensors, artificial intelligence (AI), machine learning, and Internet of Things (IoT) technologies are transforming the detection and management of environmental pollutants. Their comprehensive review highlights how spectroscopy and sensor networks are now key tools in real-time pollution tracking.