Direct Insertion Probe – Mass Spectrometry (DIP-MS) in the Characterization of Opportunity Crudes
Special Issues
DIP–MS is a fast and easy tool that can identify classes of compounds in opportunity crudes (heavy and ultraheavy crude oils, asphaltenes, and tar sands) in the field, without prior separation or treatment. It may enable fast screening of real samples to make a rough evaluation of the potential of reservoirs and oil fields.
The evaluation of opportunity crudes (heavy and ultraheavy crude oils, asphaltenes, and tar sands) has economical and technical importance because of the shortage of conventional oil reserves and the exploitation of new potential reservoirs. Direct insertion probe–mass spectrometry (DIP-MS) is a new application that can characterize fuels, from crude oils to tar sands, without previous separation or treatment. It is based on the introduction of samples directly into the ionization chamber, followed by vaporization, and eventually ionization by electronic impact. The single components present in the mixture are detected up to masses of 950 m/z, as a function of their boiling point and volatility, by programming the probe temperature ramp. The temperature ramp behaves as a fractional distillation without the limitations of chromatographic methods. DIP-MS offers a fast and direct evaluation of opportunity crudes through characteristic fingerprint maps, without the need to draw an exhaustive and comprehensive map of all the components of the organic matter. It is proposed for an on-field application for fast screening of real samples to acquire information about the most relevant organic species and characteristics for comparative purposes and for a rough evaluation of the potential of reservoirs and oil fields.
The growth in the economy of any country is connected to a strong increase in the energy demand that now combines with the decline of conventional oil reserves. The shortage of oil or known petroleum reserves makes less attended energy resources more attractive, especially considering that their availability ratio to conventional crude oils is 5:1. Processing unconventional or opportunity crudes (that is, heavy and extra-heavy oil, tar sands, bitumen, high total acid number [TAN] crudes, and oil shale) is considered a huge potential resource to fulfill energy requirements and is the most viable option during a time of rising oil prices and disproportionate demand for light sweet crudes (1).
Comprehension of the dependence of the macro physical properties of crudes from their major chemical characteristics is fundamental to both upstream (for example, reservoir evaluation, migration and maturity, and degradation processes) and downstream operations (processing, tightening of refinery specifications, and environmental impact). Concerning the upstream approach, the physical properties of these crudes (American Petroleum Institute gravity [°API] and viscosity) represent the fingerprint of the mixture of thousands of different compounds and determine reservoir potentiality. As far as the downstream operations are concerned, the need for a more efficient exploitation of heavier or poorly known feedstocks has led to an increased interest in elucidating the molecular nature of oil components, to understand their behavior in thermal and catalytic processes.
In recent years, the study of opportunity crudes has rapidly become more important, requiring the combination of several techniques (for example, vibrational spectroscopies, nuclear magnetic resonance [NMR] spectroscopy, chromatographic methods, and high resolution mass spectrometry [MS]) or very complex and time-consuming pretreatment or separation procedures (2,3). The accurate map of the oil components is the subject of updated petroleomic research (4–7).
The direct insertion probe–mass spectrometry (DIP-MS) technique has been applied for the analysis of samples for more than 30 years (8) and has only recently been used to analyze insoluble or solid organic species (9). The technique is based on the introduction of the samples directly into the ionization chamber, followed by their vaporization and eventual ionization by electronic impact. Because it is often mentioned as a fast alternative for polar or thermally labile samples (for example, aromas) that do not require gas chromatographic separation, this technique has been considered a poor alternative for analyzing solid and insoluble samples characterized by high boiling points or hindrances that prohibit or limit their analysis by chromatographic methods. DIP-MS is shown here as a fast and easy tool that is able to identify classes of compounds in opportunity crudes and relate them with some physical properties of interest in complex organic mixtures.
Principle and Potential Applications of DIP-MS
In DIP-MS, the solid sample is introduced into a quartz cup located on the tip of the probe (Figure 1), which enters the vacuum chamber through an inlet. The tip of the probe is directly introduced into the ionization chamber, close to the ionization source (the distance is less than 5 mm). The inner diameter of the cup is 1 mm, the length is 7 mm, and the sample amount that can be introduced is about 0.2 mg. In the presence of light samples, the heat of the filament under vacuum conditions is enough to vaporize the components and the detection of the signal begins immediately.
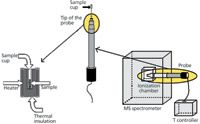
Figure 1: Schematic of a DIP-MS apparatus.
The high-boiling components of opportunity crudes need more heat to vaporize. Therefore, the tip of the probe must be heated in a temperature-programmed mode to detect the different components of the sample with a procedure similar to fractional distillation, but with the separation enhanced by the combined effect of vacuum and heat.
The heating rate is chosen to avoid a too-rapid vaporization of the sample and the saturation of the signal. Eventually, these species are ionized by electronic impact and monitored. A turbomolecular pump system coupled to the mass spectrometer creates a dynamic vacuum in the ionization chamber to maintain high vacuum conditions (7 × 10⁻⁵ mbar). The very short distance between the ionization source and the vaporized molecules coming from the tip of the probe, the small amount of molecules undergoing the collision with the electron flux, and the dynamic vacuum prevent the permanence of the molecules near the source zone with consequent molecule collision and recombination, and guarantee rapid ionization before thermolytic degradation.
It is important to note that vacuum dramatically decreases the boiling temperature of the compounds, allowing the vaporization of high-boiling-point species even when not very high temperatures are applied. By thermodynamic calculations we were able to determine the change of boiling point of some representative polyaromatic hydrocarbons from the atmospheric to the pressure value of 7 × 10⁻⁵ mbar (that is, the maximum vacuum level present in the mass spectrometer). For example, the boiling point of benzocoronene is 566 °C at atmospheric pressure and decreases to 303 °C at 10 mbar and 48 °C at 7 × 10⁻⁵ mbar.
The versatility of DIP-MS analysis with a temperature-programmed probe extends itself to data analysis because both traditional mass spectra and contour maps can be obtained, graphically displayed selecting different vaporization temperatures, and analyzed with different approaches.
The total ion current (TIC) profile plots the sum of the intensity of all masses vs. the time of analysis. It does not identify the single compounds present in the sample, although it provides some information about their vaporization process. For example, in the case of a bitumen sample (Figure 2, top), low and intermediate temperature ranges and the final isotherm at 340 °C can be defined by plotting the temperature profile against the time of the analysis. The relative intensity of the different areas can be used as a sort of fingerprint of the sample and to separate them into light, medium, or heavy species.
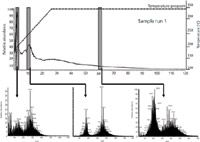
Figure 2: DIP-MS analysis of a bitumen sample. Total ion current (TIC) profile (top) and the corresponding mass profiles (bottom) at three selected ranges of vaporization temperature (120â220 °C, 240â260 °C, and 340 °C, from left to right, respectively).
At each point of the TIC profile (that is, at a chosen temperature of the probe) a conventional mass spectrum is registered that describes the species able to vaporize at that temperature. The melted mixture creates a "vapor" phase at every single instant (that is, temperature) and the presence of a dynamic vacuum prevents secondary reactions among the different components.
This mass spectrum does not correspond to the fragmentation pattern of a single compound and consequently cannot be used to accurately identify the compound, but it represents the sum of the fragmentation pattern of all the species vaporized at that moment (Figure 2, bottom). In this way, general information can be obtained on the nature (aliphatic or aromatic) of the species, the presence of homologous sequences, and the molecular ions, when stable polyaromatic compounds are vaporized. Because this approach is not focused on identifying single compounds, it does not require the application of highly sophisticated and expensive high-resolution mass spectrometers.
A more performance-based representation of DIP-MS data is obtained with the contour map. In the mass spectrometer, the magnitude I (dependent variable) of the ion flux is recorded as a function of the mass-to-charge ratio, m/z (independent variable). In DIP-MS analysis with a temperature-programmed probe, I can therefore be plotted as a function of m/z and T (temperature of the probe), t (time of the temperature program), or n (scan number linearly related to t) simultaneously. This plot can be displayed as a contour-line map (Figure 3), where m/z and n are assigned to the x- and y-axes, respectively, and I values (from 2 × 10³ up to 2 × 10⁷ MS counts) are shown by contour lines and different colors from the black of the background to the top of the most intense peaks in the pale blue, green, yellow, brown, and red color ranges.
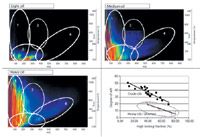
Figure 3: Representative contour maps of different types of crude oils and a plot of the high-boiling fraction (% mol) as obtained from DIP-MS intensity vs. American Petroleum Institute gravity (°API).
Instrumentation
DIP-MS analyses were performed with a Trace DSQ Thermo system equipped with a quadrupole mass spectrometer detector with electron-impact ionization and a direct insertion probe module. The probe temperature program follows: 120 °C for 10 s; 60 °C/min up to 200 °C; 50 °C/min up to 340 °C; 340 °C for 15 min, which was maintained up to 240 min, only in some selected experiments. The analyses were performed with an ionization voltage of 70 eV, a source temperature of 270 °C, a mass range between 33–1000 m/z, a scan rate of 2.14 scan/s, and a vacuum of less than 7 × 10⁻⁵ mbar.
Application of DIP-MS to Opportunity Crudes
Crude Oil Fingerprinting
The three contour plots obtained from DIP-MS experiments (Figure 3) represent a schematic and simple approach to analyze crude oils. Because each crude oil gives rise to a specific mass evolution during the sample heating, the contour plot can be applied as a fingerprint to distinguish the samples. Their similarities and differences because of different chemical compositions find a parallelism with the physical properties of the oils (2,3). For example, the presence in the plot of large and intense splashes of color is peculiar of a large amount of species (population) with high mass (x-axis) and temperature values (y-axis), characteristic of dense and viscous heavy oils (Figure 3, bottom left). Every plot can be roughly divided into four areas, in which the population grows on the basis of the oil type. In the first type of contour plot (Figure 3, top left), which is considered a fingerprint of light oils (for example, with a degree of API around 50 and kinematic viscosity of 0.7 mm2 /s), only areas 1 and 2 are populated. Area 1 includes signals of light aliphatic fragments, while area 2 is related to species up to 400 m/z, which includes both heavier mass fragments and molecular ions. The oils represented by this contour plot are characterized by light (mass range: 30–600 m/z) and low-boiling components (vaporization temperature: 120–240 °C).
In the second type of contour plot (that is, the fingerprint of medium-gravity oils), areas 1 and 2 are more intensely populated than in the previous case (Figure 3, top right), and an extra partial cloud, constituted by medium boiling-point species in the 300–700 m/z mass range, begins to appear in areas 3 and 4. This is in agreement with °API of approximately 30 and kinematic viscosity of 9 mm2 /s.
In the third contour plot, characteristic of heavy oils (that is, oils with approximately 20 wt% of asphaltenes and API gravity lower than 20), the distinguishing mark is an evident and sometimes very intense cloud in areas 3 and 4, in addition to those in areas 1 and 2 (Figure 3, bottom left). This means that these kinds of oils are constituted by a heterogeneous series of chemical components, among which also high-boiling species with molecular weight beyond 900 m/z are present, which is in agreement with their high density and viscosity values.
The amount of signals in areas 3 and 4 approximately corresponds to the fraction of the crude oil vaporized at higher temperatures and can be used to create correlations with properties of great importance in crude oil characterization, such as API gravity and kinematic viscosity. The data are distributed in two different series (Figure 3, bottom right) as a function of the nature of the crude and independently from where they came from: Light and medium-gravity crude oils are placed according to a relationship in which the higher the high-boiling fraction, the lower is the API gravity, and heavy oils and bitumens are located in an underlying area defined by lower values of API gravity.
Vaporization Sequence of Heavy Oils
In a conventional mass spectrum (for example, Figure 2 bottom), all the fragments and molecular ions ionized from the crude components are summed and, consequently, a detailed investigation is constricted by overlapping the species vaporized in different events during the whole experiment. When the mass profile is monitored at a defined time (that is, at a defined vaporization temperature), a sequence of pictures is obtained that more clearly describes the evolution of homologous series and compound classes at decreasing volatility. For example, from a medium-gravity crude oil at least two homologous series (denoted by crosses and a triangle in Figure 4) of stable molecular ions (even m/z values) can be separated at a vaporization temperature of 91.5 °C starting from 170 m/z (mass value and boiling point compatible with trimethylnaphthalene isomers) and 176 m/z (compatible with three trimethylbenzo[b]thiophene isomers), respectively. At 151 °C only one series (cross-marked) survives and lasts up to 170 °C. Meanwhile other species, starting with the ion of 262 m/z (diamond-marked, isomers of dimethylbenzo[b]naphtho[2,3-d]thiophene), grow up to 200 °C and then decrease, as another series (hexagon-marked, starting molecular ion at 286 m/z; for example, dinaphthothiophene or styrylnaphthothiophene derivatives) appears, disappearing at 225 °C. The cross-marked species are isobaric with paraffins, but their mass spectra with intense and stable molecular ions and no fragmentation do not match with the typical paraffin mass spectra and appear more consistent with those of stable polyaromatics. Additional high-temperature gas chromatography–mass spectrometry (GC–MS) experiments confirmed the presence of these proposed polyaromatic structures.
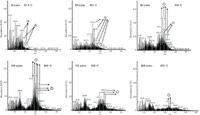
Figure 4: Sequence of mass spectra registered at different times (expressed in s) and temperatures during the DIP-MS analysis.
Similarly, the vaporization sequence is applied to heavy oil fractions to acquire information about the nature of their asphaltenes (Figures 5 and 6). Each spectrum is constituted by the species volatized during a time range of 120 s and confirms the different behavior between two heavy crude oils.

Figure 5: Sequence of mass spectra of a heavy oil collected in a time range of 120 s during DIP-MS analysis.
In the first example (Figure 5), the mass spectra can be divided into two parts: the area preferentially populated by fragments (odd mass values) and the area preferentially covered by molecular ions (even mass values). The molecular ions, characterized by very intense signals, move to higher mass values during the experiment and achieve the top of intensity in the time range 120–240 s (that is, 225–335 °C). The fragment area is populated by intense peaks differing by 14 m/z, related to "heavy fragments" (200–400 m/z in the second spectrum and 200–600 m/z in the last one), whereas light aliphatic fragments are minor components. This suggests the presence of a heavy fraction made of "aromatic cores" in the oil linked by –(CH2)n – bridges (with n < 4) and with few and short aliphatic branches. These molecules do not fragment easily, and this explains the unusually high intensity of the molecular ions. In fact, the breaking of a C-C bond in a bridge between aromatic cores produces high-molecular-weight fragments and not light aliphatic ones. These findings agree with those obtained by conventional GC–MS experiments, characterized by only a few weak peaks because of light aliphatic (n- and iso-) compounds up to C18 and aromatics (C0–C4 benzenes, C0–C2 naphthalenes, and C1–C2 benzothiophenes). This means that the heavier species present in the crude (and deeply contributing to its physical properties) cannot be detected after conventional GC separation.
The mass spectra of the second crude oil (Figure 6) show hardly any visible peaks in the molecular ions area, agreeing with a molecular model with branched molecules with long aliphatic bridges among small aromatic cores that are more easily fragmented. Furthermore, according to this hypothetic molecular model, the fragments area shows intense peaks in the range of the light aliphatic fragments. In the conventional GC–MS analysis it gives rise to a very complex total ion current (TIC) profile, crowded with n-, iso- and cycloaliphatic species up to C30 and aromatics (from C0–C16 benzenes up to C1–C2 phenanthrenes), as well as biomarkers such as pristane, phytane, chlolestane, and baccharane.
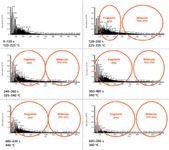
Figure 6: Sequence of mass spectra of a heavy oil collected in a time range of 120 s during DIP-MS analysis.
Asphaltene and Bitumen Study
Another field of application for the DIP-MS technique is the mapping of polyaromatics in asphaltenes. The comprehension of the asphaltenes composition was the subject of several studies, developed with the contribution of several techniques (10–21). Because of the very low volatility of these materials, the temperature program must be prolonged up to 240 min isotherm at 340 °C in a high vacuum environment. This treatment allows the heaviest polycyclic aromatic hydrocarbon (PAH) to be vaporized and made clearly visible by the mass spectrometer.
For example, the contour plot of one asphaltene obtained after thermal treatment of crude residue (Figure 7, left) presents three main regions along the y-axis (m/z) separated by different temperature ranges of vaporization and two main regions along the x-axis corresponding to medium-light and heavy molecular weights. The species in the low m/z region (50–250 m/z) are developed at all temperatures, their origin changing from fragments and light species vaporized at low temperatures to double-charge species formed by vaporization of very stable polyaromatic compounds at the highest temperatures. The species at high molecular weight (250–550 m/z) show an intense development at the beginning of the isotherm at 340 °C and continue their vaporization along the whole isotherm, forming separated blobs, whose nature can be easily evaluated with point-by-point mass analysis. In fact, the mass spectrum (Figure 7, right) of the high-molecular-weight fraction shows a different homologous series when analyzed at increasing times. Homologous series with parent structures of 350, 374, 398, 424, and 448 m/z (corresponding to 8–9 polyaromatic condensed rings with ordered addition of 14 m/z in the alkyl chains) are visible in the latest part of the experiment (Figure 7, left top), while homologous series with parent structures of 252, 276, and 300 m/z (corresponding to 5–6 polyaromatic condensed rings) are identified at the beginning of the experiment (Figure 7, left bottom). Obviously, the chemical structures related to the mass peaks are representative of a class of molecules including the isomers and cannot be ascribed with confidence to one specific structure.
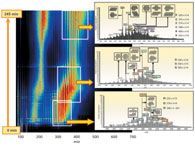
Figure 7: Contour plot (left side) and average DIP-MS spectrum (right side) of one asphaltene; polyaromatics are labeled by indicative structures and alkyl-aromatics by colored boxes.
Tar Sand Analysis
In the case of the analysis of bitumen from tar sands, it is important to point out that its characterization by conventional analytical methods is possible only after a time- and solvent-consuming extraction procedure (22,23), which is not necessary in the case of the direct analysis of tar sand. DIP-MS analysis performed on tar sand, directly from the inorganic matrix essentially composed of quartz and clay minerals, evaluates the tar without previous extraction procedures. Similar mass profiles appear for tar sand and extracted bitumen and confirm the applicability of the approach to this kind of material. A complex organic composition is present: beside aliphatic fragments in the 41–123 m/z range, intense fragments (at 161, 175, 191, and 203 m/z) grow in the 150–300 m/z range, although fragments or molecular ions are present in the whole range of masses (up to 900 m/z). The presence of aliphatic and light (2–4 condensed rings) aromatic compounds is suggested by the fragmentation pattern at low vaporization temperatures. The general behavior of the molecules that constitute the more aromatic fraction may be evaluated from the evolution of the first even molecular ion at high vaporization temperature ranges. In Figure 8, the trend of the molecular weight of the first even molecular ions agrees with the molecular weight obtained from gel permeation chromatography (GPC) with a series of tar sands. Although the bitumens contain a large fraction of heavy molecules or nanoaggregates that clearly cannot be vaporized under the experimental conditions applied in DIP-MS analysis, the "light" portion (<1000 m/z) of bitumen may be considered as a continuum in the nature with the heavy one (24) and therefore may be taken as a probe of the whole composition.
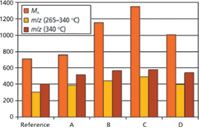
Figure 8: Comparison between the mass values (m/z) of the first even molecular ions present at the high vaporization temperature ranges and the number-average molecular weight (Mn, expressed as Da) from gel permeation chromatography for a series of tar sands.
As a general matter, the information collected by the DIP-MS analysis alone directly from tar sands agrees well with the physicochemical properties of the bitumens obtained by several techniques.
Furthermore, the modes of data evaluation previously shown can also be applied in the case of tar sands without any limitation caused by the inorganic matrix.
Conclusions
The DIP-MS technique is based on the introduction of samples directly into the ionization chamber, followed by their vaporization, and eventual ionization by electronic impact. A new application of this technique is used for the analysis of opportunity crudes, such as heavy crude oils, asphaltenes, or tar sands. By programming a suitable probe temperature ramp that behaves as a fractional distillation, analysts can detect opportunity crudes as a function of their boiling point and volatility without previous separation or limitations of the most-used chromatographic methods. The data processing offers a large variety of options and allows a deeper evaluation of the mass spectra according to the vaporization propensity of the single compounds. Differences are evidenced between the samples on the basis of the evolution of their mass spectra, and some physical properties can be anticipated by their comparison.
The DIP-MS analytical approach allows users to simply and rapidly predict the nature of opportunity crudes and is therefore proposed for an on-field application for fast screening of real samples to acquire information on the most relevant organic species for comparative purposes and rough evaluation of the potential of oil fields.
Cristina Flego and Carla Zannoni are with eni r&m, Research Center, CHIF, in S. Donato, Milanese, Italy. They work in the Physical Chemistry Department. They are specialists in the application of chromatographic separation (gas, liquid, and gel permeation) and mass spectrometry to the comprehension of complex mixtures, developing specialized expertise in the application of a multidisciplinary approach to the study of heavy crude oils and bitumens. Direct correspondence to: Cristina.Flego@eni.com.
References
(1) Opportunity Crudes Report II: Technologies & Strategiesfor Meeting Evolving Market & Environmental Challenges (Hydrocarbon Publishing Co. Ed., Southereastern, Pennsylvania, 2011).
(2) Analytical Advances for Hydrocarbon Research, C.S. Hsu, Ed. (Kluwer Academic/Plenum Publ., New York, New York, 2003).
(3) Handbook of Petroleum Analysis, J.G. Speight, Ed. (Wiley Interscience, Toronto, Canada, 2001).
(4) D.F. Smith, P. Rahimi, A. Teclemariam, R.P. Rodgers, and A.G. Marshall, Energy Fuels 22, 3118–3125 (2008).
(5) R.P. Rodgers and A.G. Marshall in Asphaltenes, Heavy Oils and Petroleomics, O.C. Mullins, E.Y. Sheu, A. Hammami, and A.G. Marshall, Eds. (Springer, New York, New York, 2007), chap. 3.
(6) A.G. Marshall and R.P. Rodgers, PNAS 105, 18090 (2008).
(7) A.E. Pomerantz, O. C. Mullins, G. Paul, J. Ruzicka, and M. Sanders, Energy Fuels 25, 3077 (2011).
(8) F. Trejo, J. Ancheyta, T.J. Morgan, A.A. Herod, and R. Kandiyoti, Energy Fuels 21, 2121–2128 (2007).
(9) C. Flego and C. Zannoni, Energy Fuels 24, 6041–6053 (2010).
(10) R.R. Coelho, I. Hovell, M.B. de Mello Monte, A. Middea, and A.L. de Sousa, Fuel Process. Technol. 87, 325–333 (2006).
(11) R.Z. Syunyaev, R.M. Balbin, I.S. Akhatov, and J.O. Safieva, Energy Fuel 23, 1230–1236 (2009).
(12) S. Xuguang, Spectrochim Acta A 62, 557–564 (2005).
(13) J. Christopher, A.S. Sarpal, G.S. Kapur, A. Krishna, B.R. Tyagi, M.C. Jain, S.K. Jain, and A.K. Bhatnagar, Fuel 75, 999–1008 (1996).
(14) A.K. Ghosh, S.K. Srivastava, and S. Bagchi, Fuel 86, 2528–2534 (2007).
(15) A.R. Hortel, P. Hurtado, B. Martinez-Haya, and O.C. Mullins, Energy Fuel 21, 2863–2868 (2007).
(16) A. Smaniotto, C. Flego, L. Montanari, G. Guglielmetti, R. Seraglia, and P. Traldi, Rapid Commun. Mass Spectrom. 23, 725–728 (2009).
(17) A. Rizzi, P. Cosmina, C. Flego, L. Montanari, R. Seraglia, and P. Traldi, J. Mass Spectrom. 41, 1232–1241 (2006).
(18) C.A. Islas-Flores, E. Buenrostro-Gonzalez, and C. Lira-Galeana, Fuel 85, 1842–1850 (2006).
(19) H.E. Schwartz, R.G. Brownlee, M.M. Boduszynski, and F. Su, Anal. Chem. 59, 1393–1401 (1987).
(20) L. Przybilla, J.D. Brand, K. Yoshimura, H.J. Räder, and K. Müllen, Anal. Chem. 72, 4591–4597 (2000).
(21) A.A. Herod, K.D. Bartle, and R. Kandiyoti, Energy Fuels 21, 2176–2203 (2007).
(22) D.L. Mitchell and J.G. Speight, Fuel 52, 149–152 (1973).
(23) J.W. Bunger, K.P. Thomas, and S.M. Dorrence, Fuel 58, 183–195 (1979).
(24) A.M. McKenna, J.M. Purcell, R.P. Rodgers, and A.G. Marshall, Energy Fuels 24, 2929–2938 (2010).

Mass Spectrometry for Forensic Analysis: An Interview with Glen Jackson
November 27th 2024As part of “The Future of Forensic Analysis” content series, Spectroscopy sat down with Glen P. Jackson of West Virginia University to talk about the historical development of mass spectrometry in forensic analysis.
Detecting Cancer Biomarkers in Canines: An Interview with Landulfo Silveira Jr.
November 5th 2024Spectroscopy sat down with Landulfo Silveira Jr. of Universidade Anhembi Morumbi-UAM and Center for Innovation, Technology and Education-CITÉ (São Paulo, Brazil) to talk about his team’s latest research using Raman spectroscopy to detect biomarkers of cancer in canine sera.