The Effect of High Pressure on Ascorbic Acid Structure
A Raman study of vitamin C, also known as ascorbic acid, is conducted at high pressure to determine phase changes and crystal symmetry through spectral interpretation.
In situ high-pressure Raman measurement of ascorbic acid has been conducted in the pressure range of ambient pressure to 14 GPa. A phase transition occurs at 3.8G Pa, and, at the pressure of 3.8 GPa, a small C=O band appears at 1767 cm-1, and the intensity increased with further compression. Furthermore, as the pressure increases, the crystal symmetry of ascorbic acid becomes lower.
Ascorbic acid, also known as vitamin C, is an acidic and strongly reducing polyol containing six carbon atoms. It is a colorless and odorless flake crystal, soluble in water, but insoluble in fat solvents (1,2). Ascorbic acid is easily oxidized to dehydrogenated vitamin C, but it is stable in an acidic environment. It is easily oxidized by oxygen, and is susceptible to temperature, pH, copper ions, iron ions, and light (3). Ascorbic acid is widely found in fresh vegetables and fruits, as well as in other foods. It is one of the important nutrients for human nutrition. If the body lacks ascorbic acid, it can cause scurvy, characterized by bleeding in the skin and gums (4,5). In addition, it is a neuromodulator, and is used by neurons in many different functions and enzymatic reactions (6–8). Due to its high reactivity to oxygen, ascorbic acid has received extensive attention related to the prevention and treatment of cancer (9–13).
In the past two decades, high-pressure in situ Raman spectroscopy, using diamond anvil cell technology, has become one of the important means to study molecular structure and properties under high pressure (14–20). We can study the changes in material structure and electron orbital changes through Raman spectroscopy (21–26).
Pressure is an effective thermodynamic parameter, and is considered a powerful tool for studying the detailed structure and physical and chemical properties of matter. Pressure can effectively change the lattice structure, and therefore shorten the distance between atoms-this affects the nature of chemical bonds between molecules, molecular conformation, crystal structure, and solid stability (27–30). Pressure-induced phase transition is a common phenomenon in high-pressure science. To date, a high-pressure Raman study of ascorbic acid has not been reported.
Experiment
The ascorbic acid used in this experiment was purchased from Sigma Aldrich, and was used without purification. The high-pressure cell used in the experiment is a symmetric diamond anvil cell (DAC). The DAC has two diamonds with 500 μm culet size. A T301 (thickness 250 μm) steel gasket was used as a sealing device for generating high-pressure. Ruby powder, having a diameter of about 12 μm, was used as an internal standard to calibrate and convey the pressure in the cavity. The ruby fluorescent line R1 (at a wavelength of 694.2 nm) linearly moves as the pressure increases (31). No additional pressure-transmitting medium was used in this experiment.
Raman spectra were measured using a Renishaw instrument via confocal Raman spectroscopy. The excitation source was a 514.5 nm Argon Particle Laser (Spectra Physics 160M). Backward Raman scattering was measured with a 50× objective lens. The laser power used was 10 mW. The accumulation time for the measurement was typically 60 s. All of the experiments were carried out at constant room temperature (~21 oC).
Results and Discussion
Raman Spectra of Ascorbic Acid
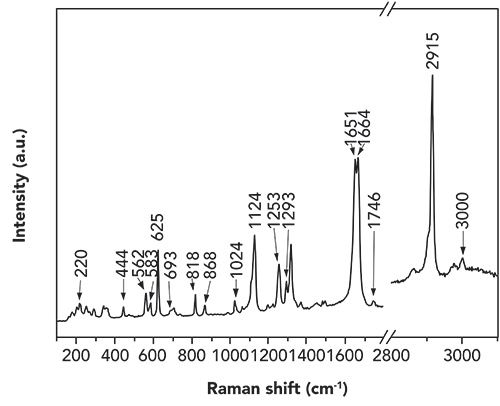
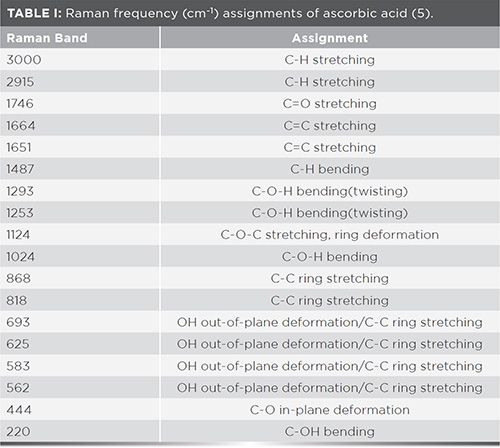
Ascorbic acid crystal belongs to the monoclinic crystal system, and its space group is P21 (32,33). Figures 1 and 2 show the crystal structure and Raman spectrum of ascorbic acid, respectively, in a normal-pressure environment. The Raman spectrum of ascorbic acid is consistent with what Singh and associates have reported (8). The strong Raman scattering lines located at 1124, 1651, 1664, and 2915 cm–1 are assigned to C-O bending, C=C stretching, and C-H stretching, respectively. Peaks at 562 and 583 cm-1 are attributed to be OH out-of-plane deformation and C=C ring stretching mode, respectively. Detailed Raman vibrational assignments are given in Table I.
Figure 1: Crystal structure of ascorbic acid.
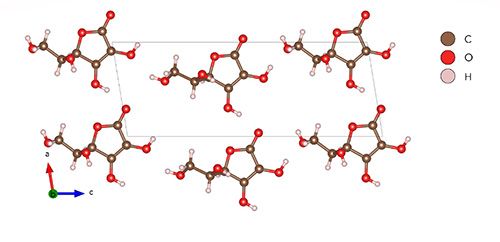
Figure 2: Raman spectrum of ascorbic acid at ambient conditions.
High-Pressure Raman Spectroscopy of Ascorbic Acid
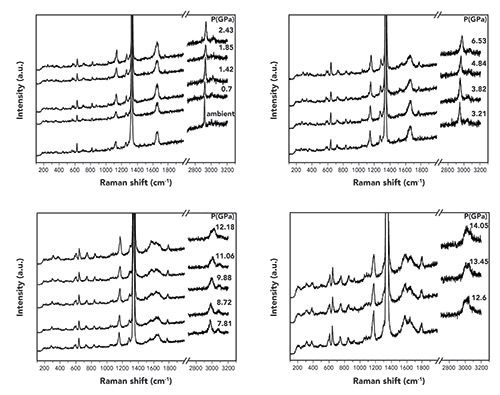
Figure 3 shows the high-pressure Raman spectra of ascorbic acid. It can be seen that as the pressure increases the bandwidth of most Raman bands will gradually widen. The Raman peaks shift to a higher wavenumber region. This is because, as the pressure is gradually increased, the distance between atoms decreases, and the force constant of the valence bonds increases, so that the vibration frequency increases. Figure 3 shows the Raman spectra of ascorbic acid recorded at selected pressure for the 100–3200 cm-1 spectral region. Raman spectra below 100 cm-1 cannot be observed, due to the notch filter in use. In addition, it is difficult to identify the Raman peaks at around 1340 cm-1, due to the first-order Raman peaks of the diamond cell. Furthermore, as can be seen from Figure 3, with the increase of pressure, the vibration intensity of the Raman band at 583 is enhanced. This may be due to the compression of the C=C ring, and the change in the dihedral angle of the OH outside the ring. And at the pressure of about 3.8 GPa, a weak C=O stretching band appears at 1767 cm-1. Further compression will result in a gradual increase in the intensity of this band-possibly the result of the activation of the silent mode, due to changes in molecular symmetry (23).
Figure 3: Selected high-pressure Raman spectra of ascorbic acid from ambient pressure to 14.05 GPa.
Frequency–Pressure Relationship of Ascorbic Acid
In general, the Raman frequency pressure relationship can provide useful information about the crystal structure at high pressure. In addition to the disappearance of the original peaks and the appearance of new peaks, the frequency–pressure relationship is also an important indicator of the pressure-induced phase transition (34–35). As can be seen in Figure 4, with an increase of pressure, the relationship between frequency and pressure is basically linear. However, at about 3.8 GPa, the frequency–pressure slope of the Raman peaks of ascorbic acid changes significantly. The four linear equations at 562, 624, 693, and 3000 cm-1 are changed from y = 3.2708x+563.19, y = 2.377x+625.15, y = 7.3727x+695.54, and y = 9 .85x+3004.54 to y = 1.84702x+565.392, y = 1.3612x+626.75, y = 3.285x+700.8, and y = 6.545x+3022.8287, respectively (x represents pressure [GPa], and y represents Raman shift [cm-1]). The sudden changes in the frequency-pressure relationship should correlate with the material phase transition. Therefore, we believe that a first-order phase transition of ascorbic acid occurs at approximately 3.8 GPa. We define the phase under pressure of 3.8 GPa as phase I, and when the pressure is higher than 3.8 GPa as phase II. The change in the molecular properties of ascorbic acid caused by phase transition remains a subject to be studied.
Figure 4: The frequency–pressure relationship of ascorbic acid.
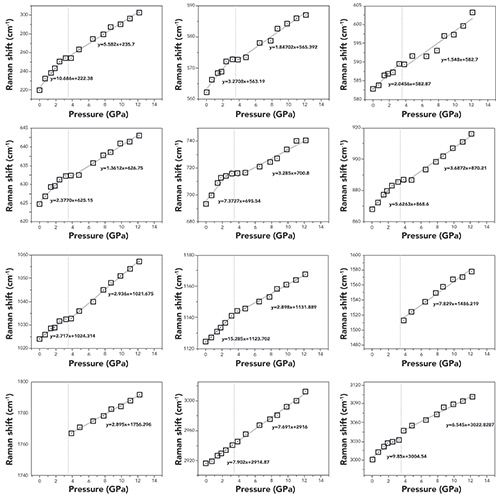
Additionally, a change in the symmetry of the molecular point group in ascorbic acid appears to accompany the phase change at 3.8 GPa. New bands at 1510 and 1767 cm-1 appear in phase II, indicating that the symmetry of ascorbic acid in phase II is lower than phase I. This also may be related to the fracture and rearrangement of the H-bond structure. Due to the effect of high pressure, most of the frequency–pressure Raman peaks of ascorbic acid become smaller. We also believe that the bonds in the crystal become more rigid after the phase transition.
Conclusion
In this work, we used high–pressure Raman spectroscopy (~14 GPa) to study the structure and Raman spectra of ascorbic acid. By observing changes in peak positions and intensities at approximately 583, 693, and 1746 cm-1, it is shown that the internal and side chains of the ascorbic acid ring are changed under high pressure. Furthermore, we analyzed the frequency–pressure relationship of ascorbic acid, and found that ascorbic acid undergoes a phase transition at 3.8 GPa, and the symmetry of the crystal structure also changes. We hope that the results of this study can provide some insights into the study of the structure of ascorbic acid under high pressure.
Acknowledgments
This work was supported by the Jilin Provincial Research Foundation for International Scientific and Technological Cooperation Projects (Grant No.20170414026GH), and the Jilin Provincial Science Foundation (Grant No.20180101219JC).
References
- R.W. Berg, Appl. Spectrosc. Rev. 50(3), 193–239 (2015).
- B.M. Tolbert, M. Downing, R.W. Carlson, et al., Ann. N. Y. Acad. Sci. 258(1), 48–69 (1975).
- W. Haijia, Study on the Stability of Vitamin C and the Determination of the Content of Fruits, Vegetables and Fruit Juice by Ultraviolet Spectrophotometry, Shanxi Medical University (2015).
- E. Cadenas and Lester Packer, Eds. Handbook of Antioxidants, Vol. 712 (Marcel Dekker, New York, New York, 2002).
- C.Y. Panicker, H.T. Varghese, and D. Philip, Spectrochim. Acta, Part A 65(3–4), 802–804 (2006).
- L. Packer, Vitamin C in Health and Disease (Marcel Dekker, New York, New York, 1997).
- O. Arrigoni and M.C. De Tullio, Biochim. Biophys. Acta, Gen. Subj. 1569(1–3), 1–9 (2002).
- G. Singh, B.P. Mohanty, and G.S.S. Saini, Spectrochim. Acta, Part A155, 61–74 (2016).
- I.M. Lee, Proc. Assoc. Am. Physicians111(1), 10–15 (1999).
- A.C. Carr and B. Frei, J. Am. Coll. Nutr.69(6), 1086–1107 (1999).
- R.E. Patterson , E. White, A.R. Kristal, et al., Cancer, Causes Control, Pap. Symp. 8(5), 786–802 (1997).
- K.A. Head, Altern. Med. Rev. 3(3), 174–186 (1998).
- K.N. Prasad, A. Kumar, V. Kochupillai V, et al., J. Am. Coll. Nutr. 18(1), 13–25 (1999).
- L. Beer, J.L. Brusso, R.C. Haddon, et al., J. Am. Chem. Soc. 127(51), 18159–18170 (2005).
- K.W. Chapman, G.J. Halder and P.J. Chupas, J. Am. Chem. Soc. 131(48), 17546–17547 (2009).
- F.J. Lamelas, Z.A. Dreger, and Y.M. Gupta, J. Phys. Chem. B 109(16), 8206–8215 (2005).
- A. Olejniczak, K. Ostrowska, and A. Katrusiak, J. Phys. Chem. C 113(35), 15761–15767 (2009).
- I. Hernandez and W.P. Gillin, J. Phys. Chem. B 113(43), 14079–14086 (2009).
- R.O. Goncalves, P.T.C. Freire, H.N. Bordallo H N, et al., J. Raman Spectrosc.40(8), 958–963 (2009).
- M. Zhou, Z. Li, Z. Men, et al.,J. Phys. Chem. B116(8), 2414–2419 (2012).
- L. Sun, Y. Zhao, Y. Shang, et al., Chem. Phys. Lett. 689, 56–61 (2017).
- S. Meijiao, W. Kai, X. Shengnan, et al., Spectroscopy and Spectral Analysis34(5), 1302–1305 (2014).
- Z. Ma Z, J. Li, C. Liu, et al., Sci. Rep.7(1), 4677 (2017).
- P.F. McMillan, in High-Pressure Crystallography, A. Katrusiak and P.F. McMillan, Eds. (Kluwer, Dodrecht, The Netherlands, 2004), pp. 367–392.
- V.L. Solozhenko, in High-Pressure Crystallography, A. Katrusiak and P.F. McMillan, Eds. (Kluwer, Dodrecht, The Netherlands, 2004), pp. 411–428.
- P.F. McMillan, Nat. Mater. 1(1), 19 (2002).
- W.L. Liu, Z.R. Zheng, R.B. Zhu, et al., J. Phys. Chem. A111(40), 10044–10049 (2007).
- C. Sun, H. Zhao, C. Liu, et al., J. Raman Spectrosc.48(8), 1127–1131 (2017).
- V.V. Mozhaev, K. Heremans, J. Frank, et al., Proteins: Struct., Funct., Bioinf. 24(1), 81–91 (1996).
- R.J.C. Lima, A.M.R. Teixeira, P.T.C. Freire, et al., J. Raman Spectrosc.32(1), 27–32 (2001).
- H.K. Mao, P.M. Bell, J.W.Shaner, et al., J. Appl. Phys.49(6), 3276–3283 (1978).
- J. Hvoslef, Acta Crystallogr., Sect. B: Struct. Crystallogr. Cryst. Chem.24(1), 23–35 (1968).
- J. Hvoslef, Acta Crystallogr., Sect. B: Struct. Crystallogr. Cryst. Chem.24(11), 1431–1440 (1968).
- C. Mitterdorfer, J. Bernard, F. Klauser, et al., J. Raman Spectrosc. 43(1), 108-115 (2012).
- Q. Li, S. Li, K. Wang, et al., J. Chem. Phys.138(21), 214505 (2013).
Jingkai Bi, Yujie Shang, Yue Zhao, and Mi Zhou are with the Key Laboratory of Physics and Technology for Advanced Batteries (Ministry of Education) at the College of Physics of Jilin University, in Changchun in the People’s Republic of China.Dongfei Li is with the Key Laboratory of Functional Materials Physics and Chemistry of the Ministry of Education at Jilin Normal University, in Changchun in the People’s Republic of China. Direct correspondence to: mzhou@jlu.edu.cn
Newsletter
Get essential updates on the latest spectroscopy technologies, regulatory standards, and best practices—subscribe today to Spectroscopy.
Best of the Week: The Emerging Leader in Molecular Spectroscopy, Big Pharma’s Manufacturing Shift
July 25th 2025Top articles published this week include a feature article about big pharma’s investments in U.S.-based manufacturing, an article about the 2025 Emerging Leader in Molecular Spectroscopy Lingyan Shi, and some news items detailing the winners of the Coblentz Society’s student awards.
Nanometer-Scale Studies Using Tip Enhanced Raman Spectroscopy
February 8th 2013Volker Deckert, the winner of the 2013 Charles Mann Award, is advancing the use of tip enhanced Raman spectroscopy (TERS) to push the lateral resolution of vibrational spectroscopy well below the Abbe limit, to achieve single-molecule sensitivity. Because the tip can be moved with sub-nanometer precision, structural information with unmatched spatial resolution can be achieved without the need of specific labels.