The Electromagnetic Spectrum: A History
David Ball discusses how the electromagnetic spectrum was originally mapped out and what this means for spectroscopy.

When a person says the word "light," a listener — even a spectroscopist — usually interprets that as meaning "visible light." That's not unexpected, because throughout most of recorded history the only light that we recognized was light that we could see. However, that changed in the 1800s when it was finally realized that light was a more general phenomenon. Although currently the term "light" refers to a lot more than just visible light, it's more common to use the phrase "electromagnetic radiation" when referring to any form of light. The collective range of possible lights is called the electromagnetic spectrum.

David W. Ball
Properties of Light — A Quick Review
Light has both particle and wave properties, as has been discussed in a recent column (1). Because a photon of light has a certain energy E and momentum p, it acts as a particle:

Because light's properties can be described by values of wavelength λ, frequency υ, and wavenumber υ tilde (see Figure 1), it acts as a wave. As with any wave, the velocity of light is equal to the product of its frequency and wavelength:

Unlike that of other waves, the speed of light is a constant for a given medium. In a vacuum, the speed of light is approximately 3.00 × 10⁸ m/s — about seven and a half times around the Earth every second. (See Figure 2 for an example of the speed of light.)
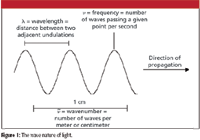
Figure 1
Because the speed of light is a constant, there is a simple relationship between the wavelength of a light and its frequency. For visible light, wavelengths range from 400 to 700 nm, which correspond to frequencies of 7.5 × 10¹⁴ to 4.3 × 10¹⁴ waves per second. The energy and momentum of each photon of visible light can be calculated from the earlier equations.

Figure 2
Other Than Visible Light
In 1800, British astronomer William Herschel was measuring the effect of various colors of light on a thermometer, using a prism to disperse light from the sun. Upon putting the thermometer past the red light, he noted an even larger increase in temperature than when the thermometer was bathed in visible light. It was obvious that there was "light" beyond the color red; this light was eventually termed "infrared" light — literally, "below red" light.
Experiments with light showed that some colors could darken certain silver salts — indeed, this is the basis of photographic film. In 1801, German scientist Johann Ritter noted that the region of the spectrum just beyond the violet edge of visible light was more effective at turning silver halides dark. He reasoned that there was an invisible form of light beyond violet, which he named "deoxidizing rays," later known as "chemical rays." Once the nature of light was better established in the late 19th century, the term "ultraviolet" — beyond violet — light was adopted.
Maxwell's Laws
The mention of magnets in ancient literature goes back to the 4th century B.C., while constructive use of electricity dates to 1800 with the invention of the voltaic pile, the first crude battery. (Previous experiments involving electricity largely involved static electricity or, as with Benjamin Franklin and the kite, lightning.) In 1820, Danish scientist Hans Orsted noticed that the needle on a nearby compass deflected when he turned the current on and off a voltaic cell. This suggested that there was a connection between electricity and magnetism, and inspired additional work by scientists such as Faraday, Ampère, Volta, and Ohm (all of whom now have electricity-related units named after them). Many of the theoretical advances involving electricity and magnetism were summarized by James Clerk Maxwell in 1864. The four fundamental equations are called Maxwell's equations, and in a space where there is no current or charge, they are
• E = 0 (Gauss' law)
• B = 0 (Gauss' law for magnetism)

(Faraday's law of induction)

(Ampère's law)
Here, E is the electric field, B is the magnetic flux density, • is the divergence operator, and × is the curl operator. (Both the divergence and curl operators are partial differential operators. For additional information on these operators, consult a calculus text.) The constants μ0 and 0 are permeability of free space and the permittivity of free space, respectively, both of which are universal constants. In these forms, E and B are related to each other because two of the equations contain them both; they are referred to as coupled differential equations. They can be decoupled by applying the curl operator a second time to the third and fourth equation (see reference 2, chapter 8). The results are
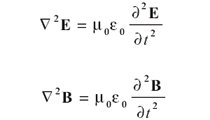
The equation has the same form for each quantity. This form is a second-order differential equation whose solution is the classic wave equation: a sine or cosine function (which are similarly behaved functions that differ mainly in phase) whose velocity is the reciprocal square root of the constants multiplying the second derivative on the right side; that is,

The numerical value of this equation is about 3.00 × 10⁸ m/s, which was very close to the experimentally measured speed of light, so Maxwell made the following statement (3):
This velocity is so nearly that of light, that it seems we have strong reason to conclude that light itself (including radiant heat, and other radiations if any) is an electromagnetic disturbance in the form of waves propagated through the electromagnetic field according to electromagnetic laws.
Indeed, this is how light currently is perceived, which is why light is synonymous with the term electromagnetic radiation. This also means that the velocity of light c is given by

Because μ0 and 0 are universal constants, it stands that c, the speed of light, is a universal constant, an idea that forms the basis of Einstein's theory of relativity.
Notice that nothing in Maxwell's equations restricts the possible values of the wavelength/frequency of electromagnetic radiation; they only restrict its velocity. Infrared light, visible light, and ultraviolet light are all the same phenomenon, but with different values of wavelength and frequency (and the same velocity). What Maxwell's equations imply is that there exist other ranges of wavelength/frequency for electromagnetic radiation. The entire range of possible wavelengths and frequencies for electromagnetic radiation makes up the electromagnetic spectrum.
The Rest of the Spectrum
Figure 3 shows a diagram of the electromagnetic spectrum. The cutoffs for each region are approximate and can vary somewhat, depending upon the reference. Some older references also can show cosmic rays on the far end next to gamma rays; though once thought to be very high-frequency radiation, cosmic rays are now known to be composed of particles, not electromagnetic radiation.
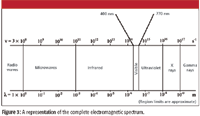
Figure 3
Maxwell died in 1879, at age 48. In 1887–1888, German physicist Heinrich Hertz (who himself died at age 37 in 1894) was the first to create electromagnetic radiation intentionally in a different region of the spectrum. Using a transmitter, Hertz generated radio waves and detected them by using a loop of wire that had a small gap between the ends. A spark would be generated upon receipt of radio waves by the loop, which was acting as an antenna. By setting a curved zinc plate some distance away from the generator to reflect the waves (a precursor to radar) and by varying the distance between the generator and the antenna, Hertz was able to determine the wavelength of the radiation (about 4 m) and determine its other properties, like velocity. In measuring this last quantity, Hertz confirmed that the radiation being given off was a form of light, verifying the applicability of Maxwell's equations. Hertz also generated microwave radiation in a similar fashion. Modern methods of generating microwave radiation use solid-state semiconductor devices or vacuum tube-based instruments.
The infrared portion of the spectrum commonly is divided into sections, although the number of sections and their limits varies. One common set of divisions lists the far infrared (wavelength range 0.75–5 μm), the mid infrared (5–30 μm), and the near infrared (30–1000 μm). The near-infrared region is adjacent to the visible portion of the spectrum.
Let us turn to the other side of the spectrum. The ultraviolet region of the electromagnetic spectrum can be separated in several ways. Ultraviolet A radiation (abbreviated UVA), also called long-wave UV light, has a wavelength range of 400–315 nm. Ultraviolet B radiation (UVB, or medium-wave UV) has a wavelength range of 315–280 nm, while ultraviolet C (UVC, short-wave UV, or germicidal UV) has a wavelength of less than 280 nm. Scientists also speak of near UV (380–200 nm, or NUV), far or vacuum UV (200–10 nm, FUV or VUV), and extreme UV (31–1 nm, EUV or XUV). For spectroscopists, the term vacuum UV means wavelengths of UV light that air absorbs significantly, so that any spectroscopy using light of this wavelength range typically must be performed in a vacuum.
Because the energy of a light photon is inversely proportional to its wavelength, electromagnetic radiation in the UV range or shorter wavelength can have severe physiological consequences, as the energy of the photon is similar to that of an average chemical bond. Solar radiation contains significant amounts of UV radiation, exposure to which causes skin tanning and, if in excess, sunburn. Long-term exposure to solar UV radiation damages skin and can lead to cancer.
X-rays were first studied systematically by Prussian (now part of Germany) scientist Wilhelm Röntgen in 1895. Using a partially evacuated discharge tube called a cathode ray tube, Röntgen noticed that his detector, a fluorescent screen of barium platino-cyanide, glowed when a discharge was passed through the tube even though the window of the tube was covered. Convinced that he had discovered a new form of radiation, he named it "X-rays" after the common algebraic variable for an unknown quantity. In his initial experiments, Röntgen noted the differential passage of X-rays through matter of differing compositions; less than a week later, he took the first X-ray of the human body, that of his wife's hand (see Figure 4). Röntgen's work was first announced in January 1896, and the medical applications of X-rays were almost immediate. X-ray spectroscopy came a bit later, developed most notably by Karl Manne Siegbahn, a Swedish physicist who won the 1924 Nobel Prize in Physics for his work in developing X-ray fluorescence spectroscopy.
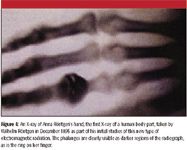
Figure 4
X-rays are a type of ionizing radiation, so-called because X-ray photons have enough energy to eject an electron from an atom, creating ions. (Indeed, this can be used as a form of spectroscopy, which was discussed previously in this column [4].) The production of ions in this fashion typically is not good, and people usually have to take safety precautions when working with X-rays or electromagnetic radiation of smaller wavelength.
Gamma rays were discovered by French scientist Paul Villard in 1900 during some of the initial investigations into the properties of radioactivity. They were first thought to be particles emitted during the course of radioactivity; hence their name, following the identification of alpha particles and beta particles. William Bragg showed that they ionized gas in 1910, and Ernest Rutherford measured their wavelengths by diffracting them with crystals, demonstrating that they were indeed electromagnetic radiation. Gamma rays are the shortest wavelength, highest frequency, and highest energy form of electromagnetic radiation.
All regions of the electromagnetic spectrum are used in spectroscopy. Figure 5 shows how each region contributes to a form of spectroscopy, many of which have been addressed in previous columns.
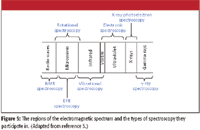
Figure 5
David W. Ball is a professor of chemistry at Cleveland State University in Ohio. Many of his “Baseline” columns have been reprinted in book form by SPIE Press as The Basics of Spectroscopy, available through the SPIE Web Bookstore at www.spie.org. His most recent book, Field Guide to Spectroscopy (published in May 2006), is available from SPIE Press. He can be reached at d.ball@csuohio.edu his website is academic.csuohio.edu/ball
References
(1) D.W. Ball, Spectroscopy 21(6), 30 (2006).
(2) D.J. Griffiths, Introduction to Electrodynamics (Prentice-Hall, Englewood Cliffs, New Jersey, 1981).
(3) J.C. Maxwell, Phil. Trans. 155, 459 (1865).
(4) D.W. Ball, Spectroscopy 18(11), 36 (2003).
(5) D.W. Ball, Field Guide to Spectroscopy (SPIE Press, Bellingham, Washington, 2006).
Smarter Sensors, Cleaner Earth Using AI and IoT for Pollution Monitoring
April 22nd 2025A global research team has detailed how smart sensors, artificial intelligence (AI), machine learning, and Internet of Things (IoT) technologies are transforming the detection and management of environmental pollutants. Their comprehensive review highlights how spectroscopy and sensor networks are now key tools in real-time pollution tracking.
