Exploring the Next Generation of Mass Spectrometer for Metal Analysis: Time-of-Flight
Although inductively coupled plasma–mass spectrometry (ICP-MS) has rapidly attained acceptance as the choice in trace metal analysis, most commercially available instruments are equipped with quadrupole-based mass analyzers. Quadrupole mass spectrometers have been available commercially for ICP since the early 1980s. Modifications and advances in these types of instruments predominantly have been in the sample introduction and ion optic areas, leaving the quadrupole mass spectrometer untouched.

The major appeal of the ICP-MS technique is the speed of analysis and low-level detection capabilities compared with other spectroscopic techniques. However, the basic quadrupole operation depends upon scanning applied voltages to create a path for ions of specific mass-to-charge ratio (m/z) to reach a detector. The applied voltages can be changed continuously to obtain the mass spectrum or rapidly changed between discrete values (peak hopping) for the selected masses of interest. It is this fundamental characteristic that causes limitations in the speed of analysis and low sample throughput for low-level, full-mass scans, limited precision at high speed for full scan, and limited capability for processing transient samples for multielement scans.
Interest in using a time-of-flight (TOF) mass spectrometer to further advance the ICP-MS technique and expand the capabilities has grown in recent years. The greatest advantage of a TOF mass spectrometer is simultaneous sampling mass analysis. The simultaneity allows for the most precise internal standard and isotope ratio correction, transient signal multielement analysis, elemental fingerprinting, and advanced retrospective analysis techniques.
TOF: How Does It Work?
In a TOF mass analyzer, all ions that contribute to the mass spectrum are accelerated into a flight tube at the same time. The flight tube is usually a vacuum enclosure, free of electrical fields, between the ion source and the detector. This is sometimes referred to as a "field free drift region" (1). The mass is related to the time taken to reach the detector. The relationship between mass and time is as follows:

where t is the time taken to reach the detector, K is a constant, and M is the mass. The flight tube usually does not interact with the ion packets along their flight path. Because the ion source must be at ground, or a different potential from the flight tube, a shield tube is used to protect the ion packets from the electrical field of the flight tube. This tube often is called a liner (1).
There are two general geometries of TOF mass analyzers: on-axis and orthogonal acceleration. In on-axis design modulation of the ion beam, the extraction and accelerating potentials are applied axially (or coaxially) to the beam. Beam-forming optics for the on-axis design are operated at low voltages to trap the ions between the grids at an energy of just several volts. As a result, space charge effects caused by high Ar+ current are much more severe. The resulting ion packets are broad in the spatial focus point affecting resolution, mass response, and detection limits.
A general schematic of the orthogonal acceleration TOF mass analyzer is shown in Figure 1.
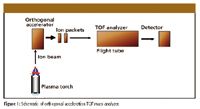
Figure 1
Using orthogonal acceleration geometry, a push-out pulse supply is coupled to the accelerator, which provides repetitive push-out voltages at a 30-kHz frequency. The ion packets are sliced from the beam and travel within the field free space toward the detector. In this basic description, all m/z values would reach the detector, including the isotopic masses for argon that will overlap those isotopes of interest. With this design, high voltages in the ion beam focus can be used to minimize space charge effects caused by high argon ions present. The high duty cycle of the orthogonal acceleration scheme is achieved by extracting a long portion of the continuous ion beam for TOF analysis.
Furthermore, compared with the on-axis geometry, the orthogonal acceleration design leads to superior resolution. Using the high-voltage ion beam mentioned earlier, the ion packet broadening is reduced greatly. Aberrations common in on-axis systems are minimized, and resolution is superior at the first spatial focus point and the detector. Background levels are automatically reduced to only 1–3 counts/s across all mass channels due to the impossibility of neutrals entering the analyzer.
A schematic of GBC Scientific Equipment's (Hampshire, Illinois) orthogonal acceleration TOF instrument, the OptiMass 9500 ICP-TOFMS, is shown in Figure 2.
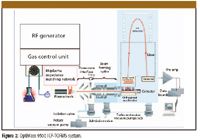
Figure 2
Notice the presence of an ion blanker (SMARTGATE) situated just before the flight tube. Orthogonal accelerator parameters are set to enable temporal-spatial focusing at the ion blanker so that the isomass ion packets are resolved in time. Any ion packets of unwanted species are ejected from the direction of travel by using voltages on the deflection plates of the ion blanker.
The ions of interest are let through the ion blanker and travel down the field free space to the ion reflectron. The ion reflectron increases the resolution of the mass spectrometer by means of temporal-energy focusing. After reflection, the ions travel within the field free space toward the discrete-dynode detector.
Figure 3 illustrates a full mass spectrum with the ion blanker off.
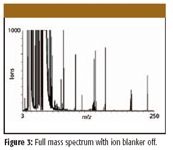
Figure 3
Figure 4 shows the effect of having the ion blanker on with the contribution of argon minimized to ~2 ppb background equivalent concentration.
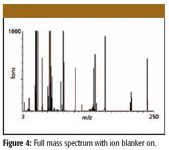
Figure 4
The ion blanker can be used to blank high concentrations of known analytes from some samples. For example, forensic scientists might want to quantify the small amount of magnesium in glass. Figure 5 illustrates the power of the ion blanker for this example. Using the ion blanker, the 23 Na contribution to 24 Mg isotope is eliminated. This allows information from all three magnesium isotopes to be collected and used.
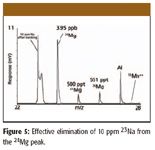
Figure 5
TOF — Why Use It?
Because the quadrupole mass analyzer is well understood, it is difficult to imagine why there is a need to replace it with TOF. The advantage of the TOF approach is the high speed and simultaneous sampling mass analysis. The entire mass spectrum can be collected in less than 30 μs, which equates to 30,000 full mass spectrum. All ions detected during this time are sampled from the source simultaneously. Therefore, there is no time skew between masses during plasma sampling. The high rate of spectral acquisition and simultaneous sample inherently overcome a majority of the limitations of a quadrupole mass analyzer.
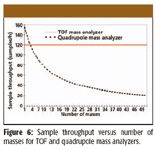
Figure 6
Detection limits are equivalent to those achievable with a quadrupole instrument for the entire mass range. A typical quadrupole takes 2–3 min to achieve parts-per-trillion detection limits for the entire mass spectrum. The TOF can achieve parts-per-trillion detection limits in less than 1 min. High sample throughput of the OptiMass 9500 system compared with a quadrupole system is shown in Figure 6. In this plot of sample throughput versus the number of elements measured, the TOF measurement time is 10 s, while the quadrupole measurement time is 3 s. These measurement times are indicative of those required to measure concentration levels approaching the lower working limit.
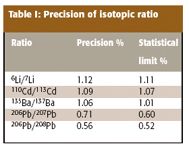
Table I: Precision of isotopic ratio
Although speed is a critical component of sample analysis, long-term stability of the instrument is imperative for extended sample runs. Figure 7 shows the stability of a few elements over 14 running hours, which equated to 500 samples analyzed.

Figure 7
The simultaneous nature of the instrument eliminates noise associated with instrumental drift and plasma flicker. As a result, very precise isotopic ratio data can be obtained. Table I shows the isotopic data for common isotope ratios.
The ability for retrospective analysis is readily available because complete spectral information is stored for each solution measured. This is a great asset for deconvolution for spectral interferences. Peak hopping is not necessary, because a full peak shape is measured for each mass across the spectrum. By using relative sensitivity factors (RSF) to define detector response to an unknown concentration, a retrospective semiquantitative analysis can be performed. Therefore, all data from mass 1 through 260 amu are available for future examination and quantification for masses not previously calibrated.
The simultaneity of the TOF guarantees each m/z value at a fixed time. By applying a statistical algorithm, an elemental fingerprint can be determined. For example, a forensic standard with known elemental content can be prepared, analyzed, and the spectrum stored. Subsequent unknown samples can be analyzed as needed and compared to the stored spectrum. A matching figure will be calculated. If the resulting number is close to 1, the unknown is said to match the known. If the number is approaching 0, the unknown is said not to match. The technician can then make an educated decision on proceeding with sample analysis.
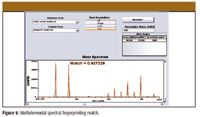
Figure 8
The fingerprint capability also has many other useful options. The two spectra to be compared can be normalized to one particular mass before the comparison. This can take into account any daily drifts in sensitivity; it is essentially a fingerprint internal standard correction. The fingerprint feature also has the capability to select only portions of the spectra that represent elements of interest in the sample. In this way, a known contaminant to the sample can be avoided and comparison can be made of the true characteristics of the sample.
Examples of multielement spectral fingerprinting are shown in Figures 8 and 9. The match number is 0.927229, which indicates a match of suspects 1 unknown sample with the crime scene swab. Figure 9 shows no match, because the match number is 0.073442.
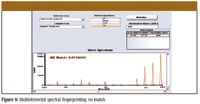
Figure 9
Finally, multielement analysis using a TOF system from a transient signal allows for the best precision and accuracy for the entire mass spectrum. Figure 10 shows mass spectrum data using electrothermo vaporization (graphite furnace) as the source. A 10-μL injection of a 5-ppb standard was dried, ashed, and atomized in the graphite furnace. The resulting vapor was swept into the mass spectrometer for a full mass spectrum analysis.
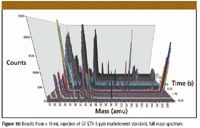
Figure 10
Another example of transient signal is laser ablation. Laser ablation is appealing for undigestable samples. Perhaps fear of contamination of the sample precludes digestion or the sample's integrity must be maintained. Museums and universities do not want to destroy one-of-a-kind or rare objects but would like to have a mass scan. Often there is only one attempt for analysis on these types of rare samples. Precision and accuracy are very important. Figure 11 is a graph of typical precision from a quadrupole mass analyzer and laser ablation determination of the same sample over time. Figure 12 is the same sample analysis on the TOF system. The TOF system has six times greater stability than the quadrupole system.

Figure 11
Conclusion
The use of a TOF mass analyzer offers significant benefits as a result of the simultaneous sampling of the plasma source over traditional quadrupole mass analyzers. The use of orthogonal accelerated TOF-MS reduces the ion packet broadening while eliminating the chances for neutrals to enter the mass spectrometer. The ion blanker masks the unwanted masses so that very low concentrations can be quantified in the presence of high concentrations at adjacent isotopes.
The well-defined spectrum from the TOF can be used for a variety of applications, from rapid prescreening of samples to determine if analysis is necessary to retrospective isotopic recall to preclude additional analysis of the same sample. Industrial, agricultural, and environmental laboratories can use the advantages of speed and versatility without compromising detection limit, sensitivity, or linear range.

Figure 12
References and Further Reading
(1) TOF Fundamentals Tutorial, Jordan TOF Products, Inc., http://www.rmjordan.com/tt1.html, 990 Golden Gate Terrace, Grass Valley, CA 95945
S. Willie, Z. Mester, and R.E. Sturgeon, J. Anal. At. Spectrom. JAAS 20, 1358–1364 (2005).
G. Ertas and J.A. Holcombe, J. Anal. At. Spectrom. JAAS 20, 687–695 (2005).
L. Yang, S. Willie, and R.E. Sturgeon, J. Anal. At. Spectrom. JAAS 20, 1226–1231 (2005).
http://www.ornl.gov/sci/csd/Research_areas/cims_rd_EMS_TOF_MS.htm
Christine Rivera is with Miben Technology, Waukegan, Illinois. Andrew "Flynn" Saint and William Balsanek are with GBC Scientific Equipment, Hampshire, Illinois

High-Speed Laser MS for Precise, Prep-Free Environmental Particle Tracking
April 21st 2025Scientists at Oak Ridge National Laboratory have demonstrated that a fast, laser-based mass spectrometry method—LA-ICP-TOF-MS—can accurately detect and identify airborne environmental particles, including toxic metal particles like ruthenium, without the need for complex sample preparation. The work offers a breakthrough in rapid, high-resolution analysis of environmental pollutants.
Trending on Spectroscopy: The Top Content of 2024
December 30th 2024In 2024, we launched multiple content series, covered major conferences, presented two awards, and continued our monthly Analytically Speaking episodes. Below, you'll find a selection of the most popular content from Spectroscopy over the past year.