H-Classic Papers in Atomic Spectroscopy: An Integrative Literature Review
In this study, we present a methodical qualitative and quantitative analysis of H-Classic publications that have made key contributions and identify intensive mainstream research areas in atomic spectroscopy. The main objective of this study is to determine which publications are cited the most and who contributed to those publications. This study also provides an insight into recent historical developments in atomic spectroscopy, which can be valuable to academic organizations and editorial staff in determining areas and fields of research. This study also creates awareness about the research trends in atomic spectroscopy among research communities, government organizations, and funding bodies.
During the last decade, there has been immense research activity in atomic spectroscopy. However, there is no methodical analysis currently available in the literature that examines the most cited publications, their trends, and their characteristics. Studies such as this one identify and document the articles that are most cited by researchers and have made key contributions. For the set of identified publications, data are extracted to obtain the number of publications appearing in each year as well as their citation characteristics, which helps determine the evolution of any particular research field.
Bibliometric studies have been conducted in many fields, including the internet of things (1), cybernetics (2), cloud computing (3), software engineering (4), intelligent transportation systems (5), soft computing (6), enterprise architecture research (7), big data for medical research, supply chain management, business intelligence, (8–12), fuzzy decision research, (13–15), 5G (16), limb prosthetics (17), cleft lip and palate (18), hypospadiology (19), craniofacial surgery (20), neuroscience (21), pelvic floor physiotherapy (22), orthopedic elbow surgery (23), rheumatology (24), craniofacial anomalies and craniofacial surgery (20), insular cortex brain (25), osteoporosis (26), health care disparities (27), regenerative endodontics (28), and telemedicine (29).
The main aim and objective of this study is to determine who contributed to the most highly cited publications in the field of atomic spectroscopy. Along with identifying contributors, the study also analyzes factors, such as citation counts and publication dates. These research insights and trends can assist researchers in looking at the current ranking of scientific contributions to refine their research plans and focus on a particular research area. These research insights also help determine potential project funding, assess research proposals, decide promotion cases of researchers to higher ranks, and create awareness among research communities, government organizations, and funding bodies. The outcome of this study answers the following research questions:
- the volume, scope, and spatial distribution of research productivity in the literature
- statistical analysis of H-Classics papers published with impact factors
- most prolific authors, institutes, funding agencies, and countries in terms of quantity and total citations of publications
- analysis of top research topics and keywords
- research collaborations among authors, countries, institutions, and journals
- future trends and prospects of research.
Introduction
Electromagnetic radiation carries energy in waves. When these waves strike any material or particle, they produce a change in the wave, the particle, or both. The study of the effects of interaction between electromagnetic radiation and matter is called spectroscopy. Atomic spectroscopy is a quantitative analysis method for measuring the elemental composition of matter at low levels and with high accuracy. The detection limit varies from 100 to less than 0.001 parts per billion (ppb, μg/L), for multiple elements, depending on the atomic spectroscopy method applied.
Atomic spectroscopy is extensively used to study the internal structure of matter, especially molecules of complex organic or inorganic compounds. Atomic spectroscopy helps determine the level of micronutrients in plants and animals. It also traces elements in soil, polluted water, and living things. Deficiency or increase levels of essential trace elements in our diets has led to severe health problems. As an example, metals, such as mercury, lead, and cadmium, are toxic to the human body (30). As a result, relevant applications for atomic spectroscopy include food and water analysis for element quantity, pharmaceuticals (for the remain catalyst in final products), and biological tissues (blood, liver, and brain muscle tissues) for elemental composition.
With each passing day, demand for atomic spectroscopy systems is increasing because of more stringent industry requirements. To ensure safety and quality regulations, industries demand that before their products are launched into the market, that their products comply with all safety and quality standards. Key driving factors include drug safety, fluorescence, and food safety. In terms of global market trends and investments, atomic spectroscopy as a field is projected to substantially increase as an industry to above the $6.5 billion mark by the year 2024 (31).
Using citation analysis, the study of atomic spectroscopy provides an insight into the recent historical developments of highly cited papers in the field through the use of H-Classics, which can be valuable to any academic organization and publications editorial staff in understanding the scientific structure and determining subfields of research. Citation analysis helps look at the structure, dynamics, and hierarchy of research, and it is a measure of influence, effect, and impact, irrespective of publication counts. Citations reveal useful information about scientific progress in the field. They are used to determine publication’s quality, their impact, and emerging research fronts in the subject area.
The next section of this article elaborates on the approach used to analyze the data. The section following that provides a detailed analysis and result outcomes before finally drawing conclusions on the research that has been compiled.
Materials, Method, and Procedure
Bibliometric Analysis
Bibliometric analysis is used to analyze and manage citations of research trends for any particular research field (32). As with any statistical data, bibliometric analysis is most effective when analyzed properly. Bibliometric analysis helps determine which papers are most popular in the academic community. It also helps in determining which research is having an influence in its field. The immense breadth and depth of data lead to certain challenges as publishing and citation data vary across categories and publications, which eventually results in getting a broader picture of performances in relevant fields.
As a rule of thumb, publications in different disciplines are cited at a different pace or have different citation behavior. Consider the life sciences field. In life sciences, papers initially may garner a lot of citations, but will quickly taper off, whereas in mathematics, by comparison, the citation counts are lower, but the same papers will continue to gain new citations for years after publication. Based on these trends, it would be unfair to expect a mathematics department to achieve the same rate of citation as a biology department.
Therefore, institutions must find a way to fairly measure the performance of different disciplines. Older material tends to be more highly cited because it simply had more opportunity (time) to be cited. The age of publications complicates the process of comparing publications to one another. Researchers who have been publishing for a long time are more likely to have a greater number of publications and more citations than an author who is new; a direct comparison of the two would be biased in favor of the earlier researcher in this case. Citation distribution tends to be quite uneven, with only a small number of publications attaining the most cited status. Many publications have few or no citations. Citation count also does not indicate anything about the quality of the research that was published. Researchers might be citing the work because they disagree with it. Therefore, it is more suitable to mitigate these challenges by using relative measures.
Citation Classics was introduced by Eugene Garfield in 1964 (33). It was designed for information retrieval to help researchers find what they need in the literature. In the scientific community, Citation Classics is a common practice that is employed to determine the quality of a publication, its impact, and the emerging research fronts in a particular subject area. Tracking and examining the number of citations an article receives helps establish links to other research works. Some use it as a quantitative measure, related to research quality and quantity. Citation Classics helps in looking at the structure, dynamics, and hierarchy of research and is a measure of influence, effect, and impact, irrespective of publication counts. When publications are frequently cited, it is an indication that they withstand the test of time and are particularly noteworthy in their field. This concept of identifying citation classics had selection criteria with two approaches: The first approach is setting thresholds of citation rates (to put it simply, authors set X number of citations without any significant scientific backing), and the second approach is setting a threshold value from the list of published papers sorted (in descending order) by the number of citations that are received.
The second approach had a limitation of not taking into consideration the scientific progress of research areas or their citation pattern. A new concept of H-Classic was presented (34) to address this issue, where variable or adaptable thresholds are used for each of the different research areas. This approach provides an unbiased criterion for identifying citation classics based on the systematic and scientific methods in any field of research. H-Classics is based on the famous H-Index, proposed by George Hirsh in 2005. H-Index measures how consistently a work is cited. It is an index that aims to measure both the productivity and impact of a set of publications. It is the most widely used quantitative measure of productivity (from number of publications), citation-based impacts, and number of citations simultaneously. By combining them into a single number, this reduces the artificial influence of citation counts (one or two highly cited papers). H-Index is commonly associated with a set of publications. The H-Index is determined by finding out the X number of articles in a set of publications that have been cited X or more times, where X is the largest possible number for the set of publications. The details of H- Index is discussed further in this article.
Impact Factor (IF)
The impact factor (IF) of a journal is a well-known measure of how often the articles in journals are cited by later articles. IF considers articles published in a journal over the previous two years. One classic definition of IF is the ratio of citations received by all items published in that journal during the last two-year period to the number of articles published in the last k year period. The impact factor score indicates how highly cited an average article published in a particular journal is relative to other articles in its field or discipline. Comparing IFs of journals in the same field gives a rough indication of which journals are more influential. However, IF is not an indicator of the quality of the journal. Journal Citation Reports (JCR) is a resource, which is released annually by Clarivate Analytics, for understanding the citation patterns in different subject categories. It helps in evaluating journal quality based on impact factor.
Different scientific fields have different patterns of citation activity. It is important to note that if one journal scores high in one subject category, it might differ from what would be considered a high score in another subject category. In other words, the range of possible values varies by subject categories. In addition to impact factor score, JCR also publishes quartile rankings that are derived for each journal in each of its subject categories based on the IF distribution such as Q1 (top 25%), Q2 (between top 50% to top 25%), Q3 (top 75% to top 50%), and Q4 (bottom 25%).
Identification of H-Classis
The identification of classic articles, from any of the research area, through H-Classis is carried as follows.
Data Sources - Bibliographic Database for Study
Web of Science (WOS), Scopus, and Google Scholar are available and popular databases. These are widely used to search and study scholarly work in relevant fields. However, Scopus analyzes data primarily only from 1996 onwards. Google Scholar has larger citations indexed, which include peer-reviewed journals, and also books, monographs, thesis dissertations, and technical reports. Because grey literature is also included, Google Scholar citation information may not be considered to be very accurate or reliable. Therefore, in our study, we chose to use WOS because it is the most effective, adequate, and comprehensive multidisciplinary database. It has strong coverage and maintains records from 1900 onwards. WOS is renowned as one of the largest citation index databases, with over 90 million records in over 55 disciplines and over 800 million cited references, maintained by Clarivate Analytics. The database includes the Science Citation Index Expanded (1900–present), Social Sciences Citation Index (1900–present), Arts & Humanities Citation Index (1975–present), Conference Proceedings Citation Index – Science (1998–present), and Conference Proceedings Citation Index – Social Science & Humanities (1998–present).
For such bibliometric studies, only articles and review papers are considered “certified knowledge” (35), apart from books, thesis, discussions, news items, meeting abstracts, and notes. Therefore, in our study of citation classics, we selected papers only of two document types—articles and reviews. In the case of WOS, research areas are already mapped and matched with areas of JCR, so the effort for retrieving relevant documents individually is reduced.
Computing the H-Index of Research Area
Tools are available to facilitate the computation of H-Index automatically, but H-Index can also be computed manually. In order to compute H-Index, the available dataset should be listed, ranked, and sorted in descending order by the number of citations received. This process brings the paper with the highest numbers of citations to the top. The H-Index is the paper order, immediately above the first paper whose order is just below its citation count.
Computing the H-Core of Research Area
The top highly cited papers would be included in the H-Core of research area. H-Core of research area consists of H-Classics, so the H-index of a research area symbolizes the cardinality of the H-core of the research area. The H-Core of the research area includes the first highly cited papers from the previous ranking, meaning the H-Classics and thus the H-Index of a research area is the ranked H-Core.
Setting of Research Data Under Study & Sample Size
The source of data presented in this study was collected in April 2020, from the Science Citation Index – Expanded (SCI-Expanded). In WOS, the field tag “TS” finds records containing the specific “term” in abstracts, titles, and keywords fields. The following advanced search query was used, which includes name variations in spellings or abbreviations to retrieve and extract papers from WOS (by Clarivate). Such data adequately reflects the literature in the field. A query below was executed to retrieve all necessary detailed information from bibliographic database to analyze the data.
TS = Atomic Spectroscopy
The search query resulted in 1214 documents. Out these, 801 were articles and 111 were reviews, which were considered. All papers were in the English language. Documents were sorted in descending order based on citation counts. The H-Index, for the available dataset, was found to be 64. Therefore, the first 64 documents were classified as highly cited papers based on the H-Classic definition were considered for further analysis. The year-wise distribution ranged from 1968 to 2015.
Analysis and Results
This section discusses the results and outcomes of the study. We begin by identifying H-Classic highly cited papers with the year of publication, impact factor, quartile rankings, and total and average citations. This step is followed by co-citation analysis and network visualization. Finally, the contributions of authors, organizations, and countries (or territories) are presented.
H-Classics – Highly Cited Papers Details
As mentioned earlier, 64 highly cited papers, based on the concept of H-Classics, were investigated. These 64 H-Classics publications were contributed by 249 authors from 110 institutions and distributed among 25 countries or territories.
The earliest H-Classic article, “Some Applications of Microwave-Excited Electrodeless Discharge Tubes in Atomic Spectroscopy”, was published in 1968 in Applied Optics.
Figure 1 illustrates the distribution of H-Classics publications per year between 1968 and 2015. It shows the overall trend according to the annual number of H-Classic papers in atomic spectroscopy. Starting in the year 1968 with one paper, followed by three papers between 1980–1984, five papers between 1985–1989, 10 papers between 1990–1994, nine papers between 1995–1999, 15 papers between 2000–2004, 12 papers between 2005–2009, seven papers between 2009–2010, and two papers in 2015. It is interesting to note that none of the H-Classic papers were published before 1968 and no publications have yet been classified as H-Classic since 2015. Year 1990 to 2009 had a large number of publications, and the year 2005 had the most with six papers. Since 2005, the number of H-Classics publications has decreased.
FIGURE 1: Publication trend of H-classics per year; abscissa is the year and ordinate is the number of publications.
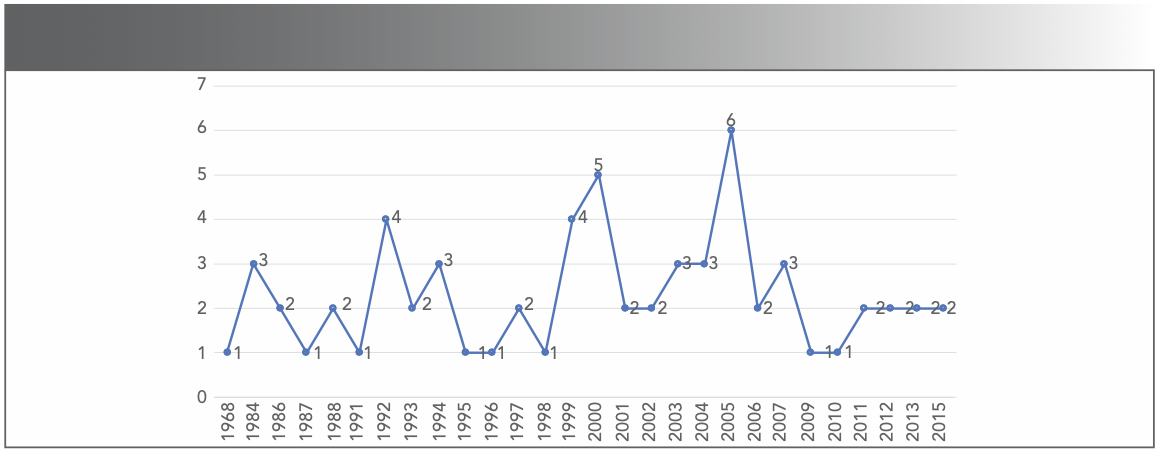
Table II shows the breakdown of the 64 H-classics with authors, titles, sources, quartile rankings, impact factor, total citation count, average citation count (citation count per year since the document was published), and average citation count of the first 10 years since publication. Table II includes the ranking by total citation count (Rank TC), average citation count (Rank AC), and average citation count of the first 10 years (Rank A10C). Currently, it is sorted based on Rank TC.
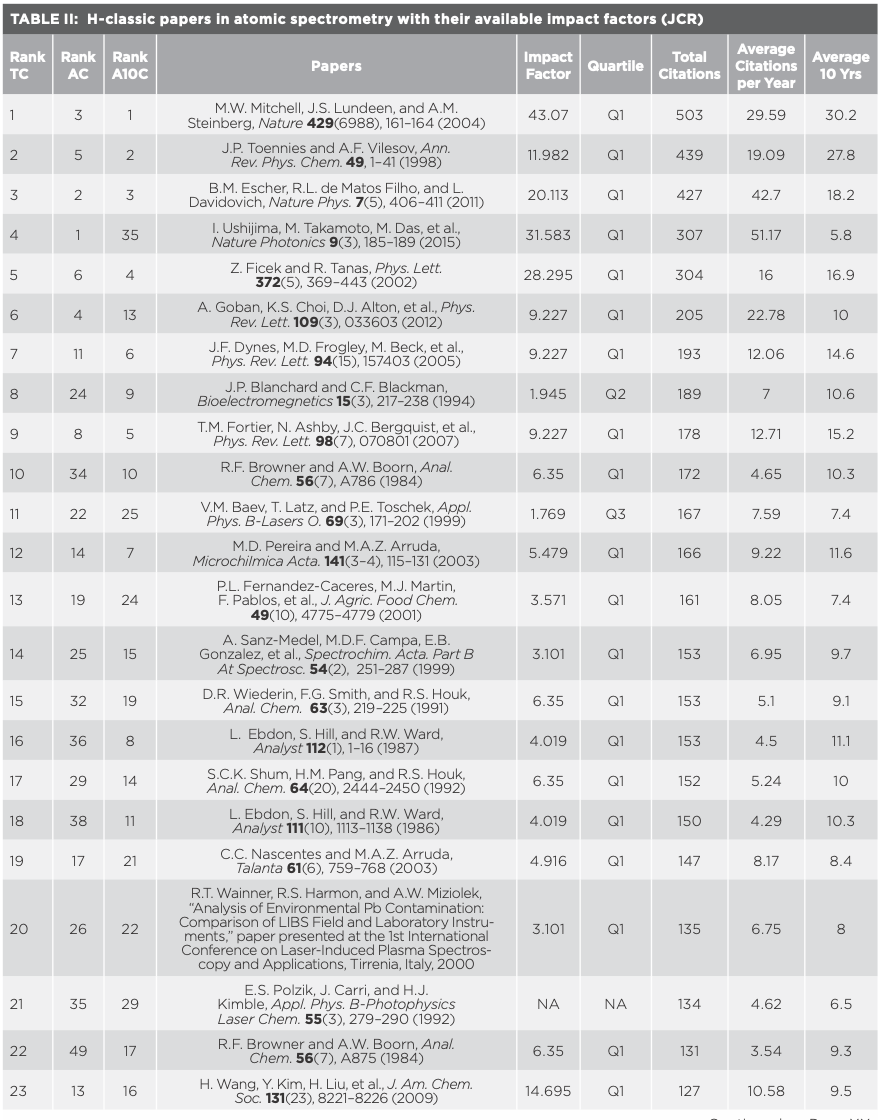
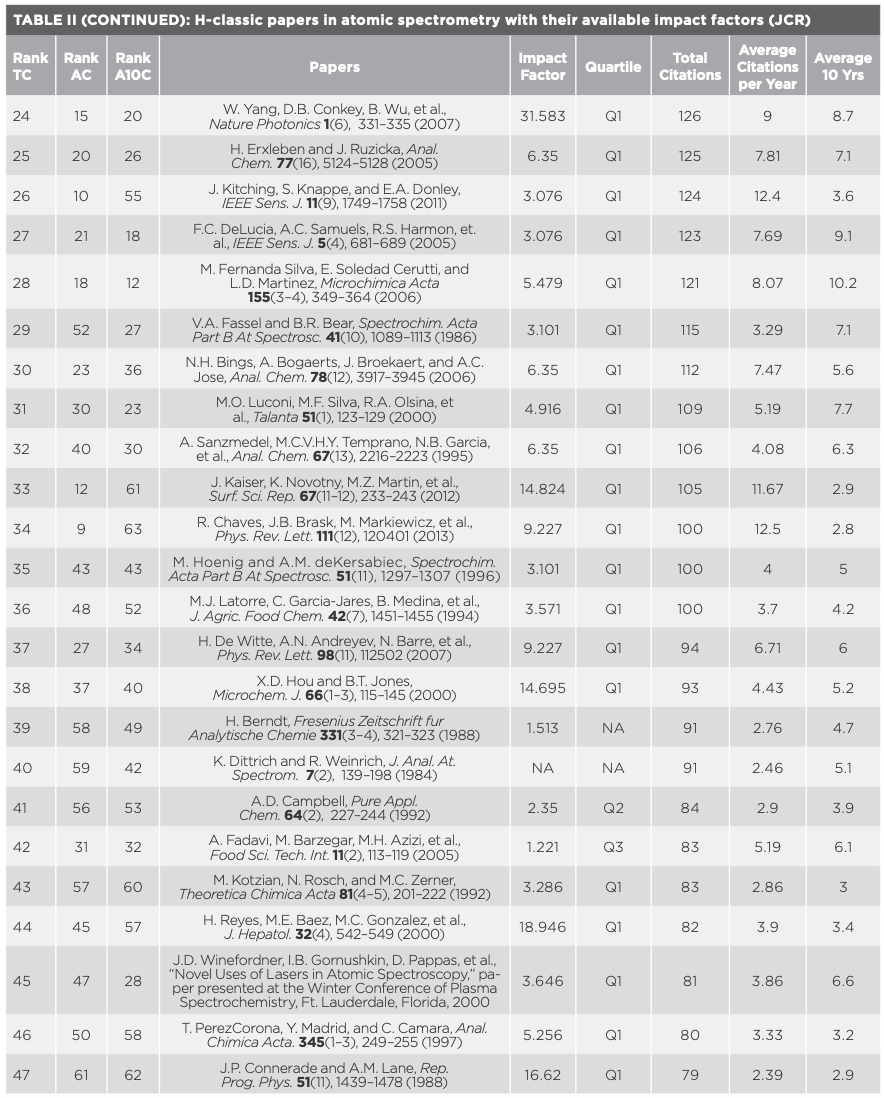
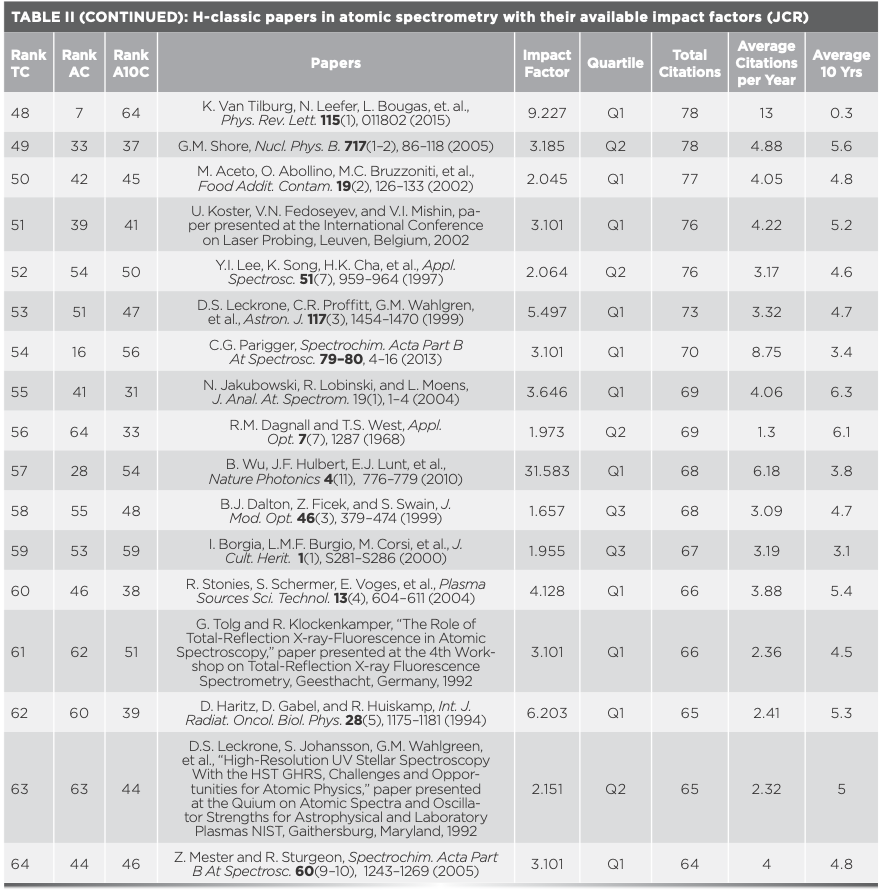
Amongst all 64 H-Classics, a paper authored by Mitchell and others received the maximum citation count of 503. The paper was published in Nature in 2004, which focused on super-resolving phase measurements with a multiphoton entangled state. A subsequent paper, with maximum citation count of 439, was by J.P. Toennies and others that focused on spectroscopy of atoms and molecules in liquid helium. That paper was published in 1998 (36).
In terms of average citation count (citation count per year since it was published), the paper that ranked at the top was published by Ushijima and others. The article focused on cryogenic optical lattice clocks and was published in Nature Photonics (37). This paper ranked fourth in terms of total citation count (307). It is interesting to note that paper (38) ranked seventh in terms of average citation count (n = 13) is ranked 48th in terms of total citations (n = 78).
In terms of average citation count for the last 10 years, the paper which ranked 12th, published by Fernanda Silva and others in D. Microchimica Acta in 2006, focused on coupling cloud point extraction to instrumental detection systems for metal analysis. This paper (39) is ranked 28th with respect to total citations (n = 121) and ranked 18th in terms of average citation count (citation count per year since it was published).
Such detailed analysis of the average citation count and the average citation count for the last 10 years gives a broader perspective regarding the significance of contributions, rather than only focusing on total citations.
Statistical Analysis
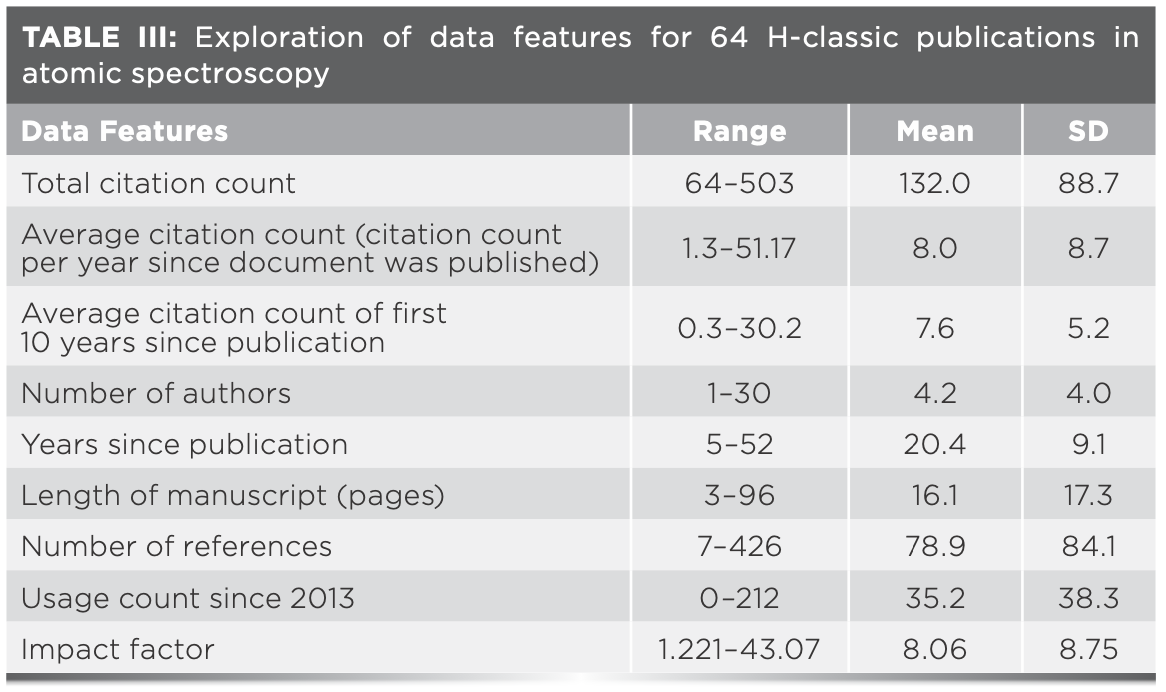
Exploratory data analysis was performed, which refers to a set of procedures for producing descriptive summaries of data. It allows for examination of the data as they are (without any assumptions) and understand the relationships among variables. An IBM SPSS Statistics 24.0 was used to perform the statistical data analysis. Table III lists key data features from the available dataset in terms of range, mean, and standard deviation.
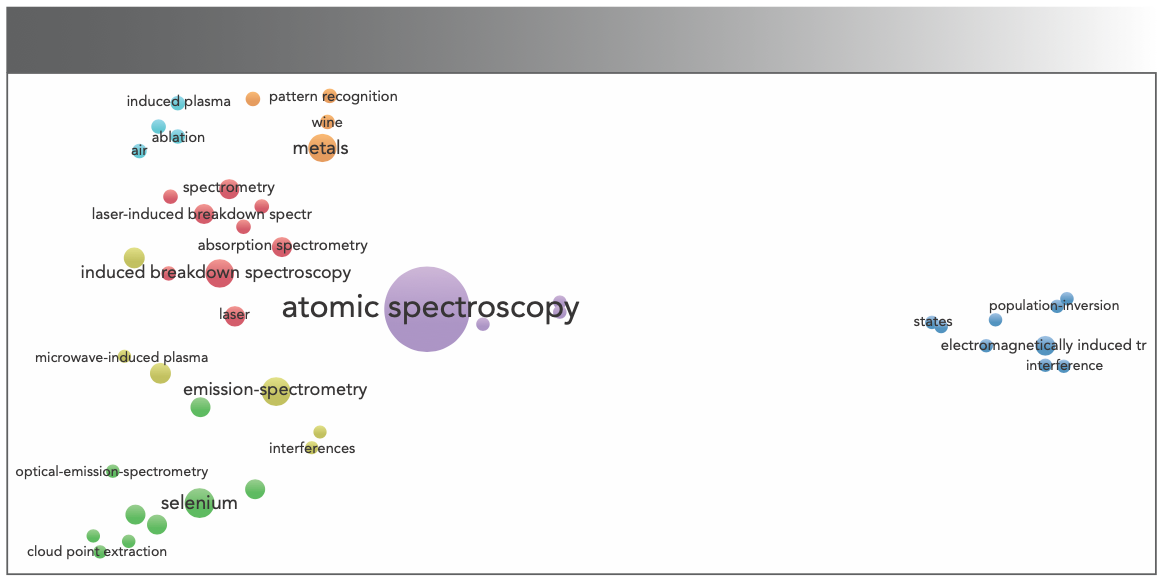
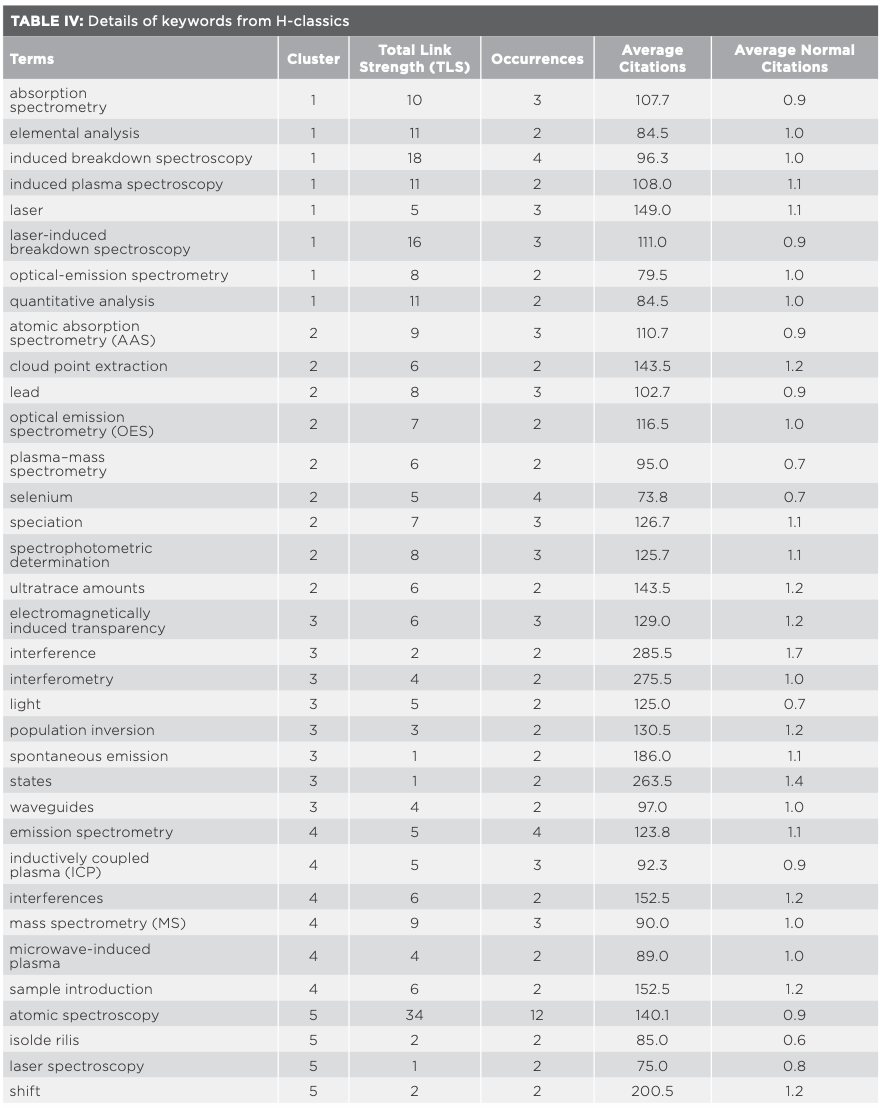
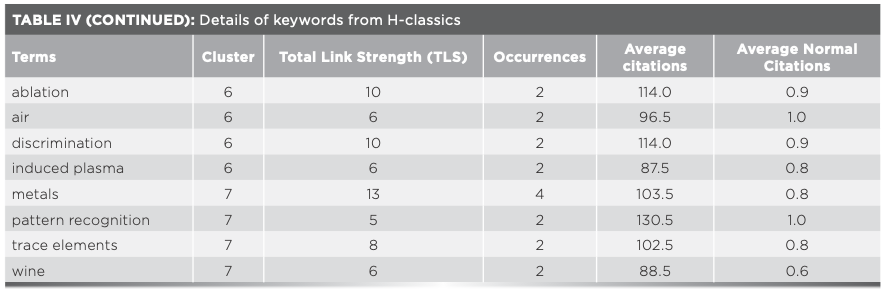
VOSviewer, a powerful tool that analyzes structures of the scientific field, was used to visualize different types of bibliometric networks. A bubble map was generated to visualize the data and the impact terms. Each circle represents the term used in the titles and abstracts of the H-Classic publications. The terms are located based on co-occurrences in the titles and abstracts. The higher the number of co-occurrence of two terms, the closer they will be located. The binary counting method was selected, and this method counts multiple occurrences within a single publication as one. All other visualization settings were chosen as the “Default.” Peripheral or general terms were excluded manually (by visual inspection) from the map generated. 45 terms appeared in H-Classic publications and were grouped into seven clusters as shown in Figure 2. The average citations of all 45 terms was 125.59. H-Classic publications with specific terms with average citation counts are included in Table IV. The outcome of the result implies that the emergence of topics related to interference, interferometry, induced breakdown, selenium, and spontaneous emission, seems to be set to continue and flourish in the future.
FIGURE 2: Term map of keywords from H-classic publications of atomic spectroscopy; 1.1. data-network visualization, with a bubble map visualizing terms in titles and abstracts.
Citation Networks
Figure 3 represents the citation network among the 64 H-Classics of atomic spectroscopy. Amongst them, six were non-interlinked papers. The network is formed based on the interlinked papers with the publication year and the first author. The larger the bubble size is, the higher the citation count is. The bubble color represents research topics, which are classified into four topics: (1) introduction and plasma–atomic spectroscopy (red, n = 5, citations = 723); (2) detection techniques (green, n = 4, citations = 543); (3) chromatography (blue, n = 2, citations = 303); and (4) cadmium determination (yellow, n = 2, citations = 259).
FIGURE 3: Co-citation of documents; map visualizing citation networks.
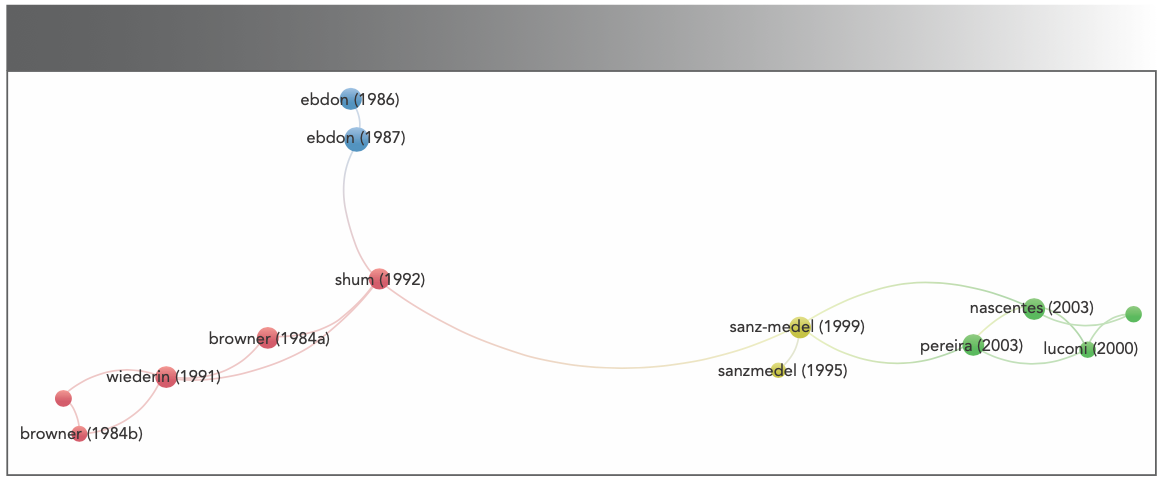
Cluster 1 and 2, which focus on plasma–atomic spectroscopy and detection techniques, gained maximum attention and importance. Overall, all the H-Classic papers received balanced attention.
Major Contributors
This section elaborates on the contribution of authors, countries, journals, institutions, and funding agencies in the 64 H-Classics for atomic spectroscopy.
Authors
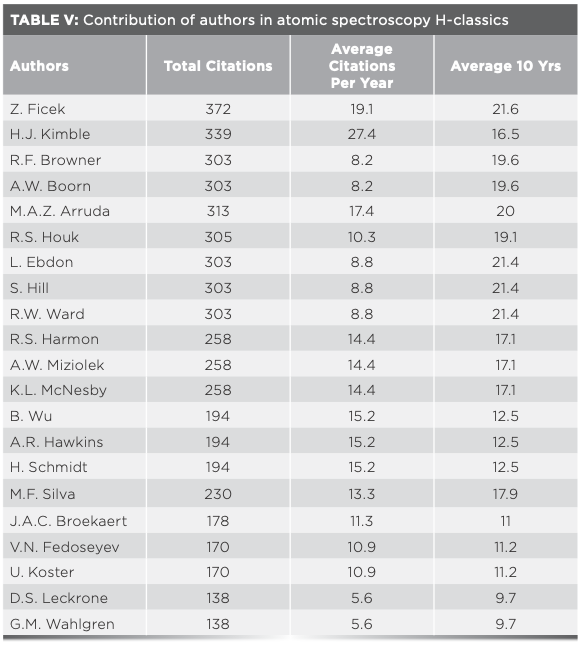
An analysis of the influence and contributions of authors, based on the frequency of occurrences with two or more H-Classics publications, was conducted. The top prolific authors who contributed the most are listed in Table V. In terms of total citations, Ficek achieved the maximum citations of 372. In terms of average citations per year, Ushijima ranked as the top candidate, whereas in terms of average citation for the first 10 years, Mitchell (40) ranked at the top.
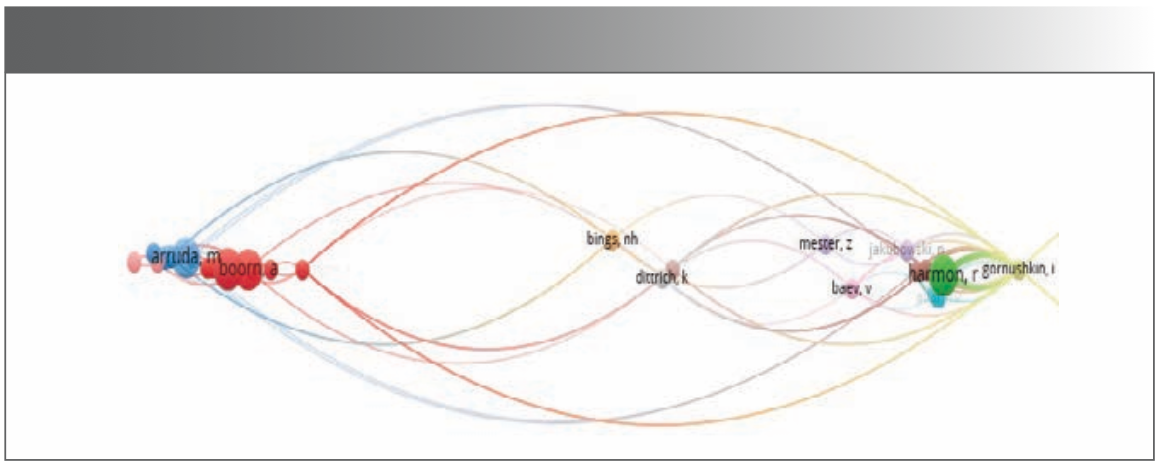
A visualized output of bibliographic coupling (41) helps in knowing the relationship between papers. A reference document cited by two papers indicates a relationship between them. The map presents a visual representation of the productivity of co-citations, which are indicated by network connections among the documents. It deals with sharing of one or more references by two documents. Two citing documents are bibliographic coupled if they cite the same publications. The strength of coupling between citing documents, depends upon the total number of citations they have in common. The higher the number of common references, the higher is the coupling strength of the papers. Bibliographic coupling is a fixed and permanent relation and does not change with time.
Figure 4 illustrates the bibliographic coupling perspective of authors amongst the 64 H-Classics of atomic spectroscopy. The authors Gornushkin, Matveev, Pappas, Smith, and Winefordner form the main core of authors with a TLS that equals 915. The map visualizes authors who are either co-authors or have similar research profiles.
FIGURE 4: Map of bibliographic coupling of authors that publish in atomic spectroscopy.
Countries
The contribution from countries and territories was determined based on the address provided by the authors in their publications. Figure 5 plots the global geographical distribution of the 64 H-Classic publications in atomic spectroscopy. The leading country that contributed the most was the United States (n = 25, 39%), followed by Germany (n = 14, 22%), the United Kingdom (n = 8, 13%), Spain (n = 6, 9%), Canada (n = 5, 8%), Belgium and France (n = 4, 6%), Brazil, Poland, Sweden, and Switzerland (n = 3, 5%), and finally Argentina, Australia, Italy, Russia, and South Korea (n = 2, 3%). In regards to regions of the world, European countries contributed the most (n = 54, 84%), followed by North America (n = 30, 47%), South America (n = 5, 8%), Oceania (n = 3, 5%), and Asia (n = 2, 3%). It shows that European countries contributed strongly, especially Germany.
FIGURE 5: Global geographical distribution of H-classic publications in atomic spectroscopy.
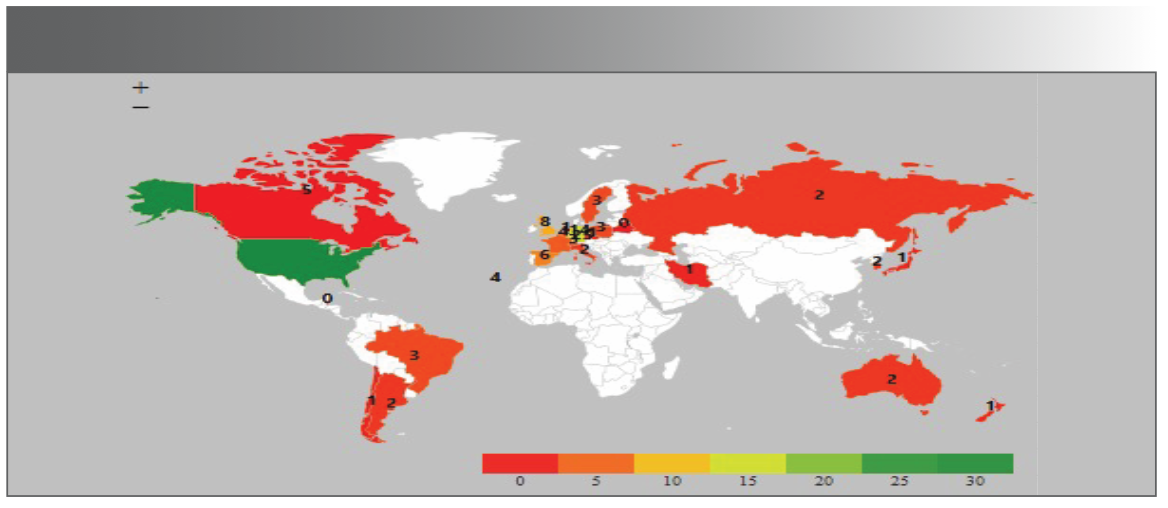
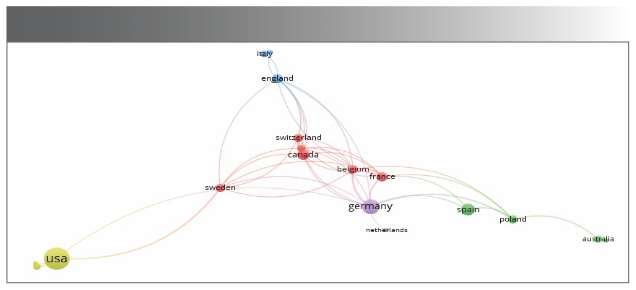
Figure 6 shows the co-authorship across countries and authors from which published H-Classics in atomic spectroscopy. It reflects the degree to which researchers in different countries communicate with each other. The details of the co-authorship network components (bubble) are as follows:
- color—the diversification of research initiatives
- size—influential countries (number of papers published)
- link—the extent of cooperative relationship
- distance—level of cooperation.
The link strength between countries, with number of papers, citations, and other details, are mentioned in Table VI.
FIGURE 6: Co-authorship of countries who published H-classics in atomic spectroscopy.
Journals
Contributions from the top 10 journals, each with more than one H-Classic paper, include Spectrochimica Acta Part B-Atomic Spectroscopy (n = 8, 5.1%), Analytical Chemistry (n = 7, 4.4%), Physical Review Letters (n = 6, 3.8%), Nature Photonics (n = 3, 1.9%), IEEE Sensors Journal, Microchimica Acta, Analyst, Talanta, Journal of Agricultural and Food Chemistry, Journal of Analytical Atomic Spectrometry, Microchimica Acta, and Talanta (n = 2, 1.2%). The details of the H-Classic papers with their available impact factors (JCR) and quartile rankings are presented in Table II. One of the papers was published in Nature (IF = 43.07) and three papers in Nature Photonics (IF = 31.583). It is noteworthy that 80% of H-Classics papers were published in Q1 ranked journals, 9% in Q2 and 6% in Q3. This implies that H-Classic papers were not limited only to prestigious Q1 indexed journals as 17% of these papers were published in Q2 and Q3 ranked journals. Such insights answer the question about the impact and ranking of prolific papers in atomic spectroscopy.
Figure 7 shows the co-citations network of cited journals with 20 clusters (nodes). The details of the co-citation network components (bubble) are as follows:
- color—group to which bubble (cluster) is assigned
- size—activity of journal (number of papers published)
- distance—determines the citation frequency (the smaller the distance, the higher number of citations).
FIGURE 7: Journal co-citation network of H-classics in atomic spectroscopy.
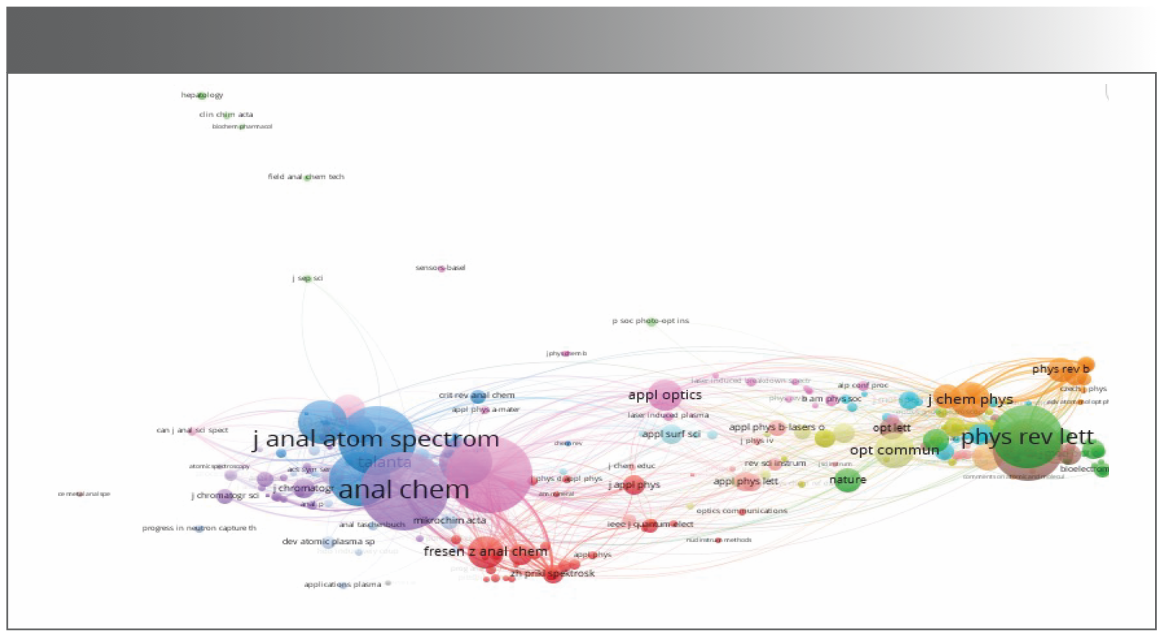
The co-citation analysis of journals assists in extrapolating the overall structure, and the characteristics of journals in terms of subject categories. The network shows that Spectrochim. Acta B. ranked at the top, followed by Anal. Chem., J. Anal. Atom Spectrom., and Phys. Rev. A. The distribution of a few major journals for H-Classics in atomic spectroscopy can be broadly classified into Analytical Chemistry, Applied Chemistry, Physical Chemistry, Applied Physics, Optics, Food Science & Technology, and Instrumentation and Multidisciplinary Agriculture.
Institutions
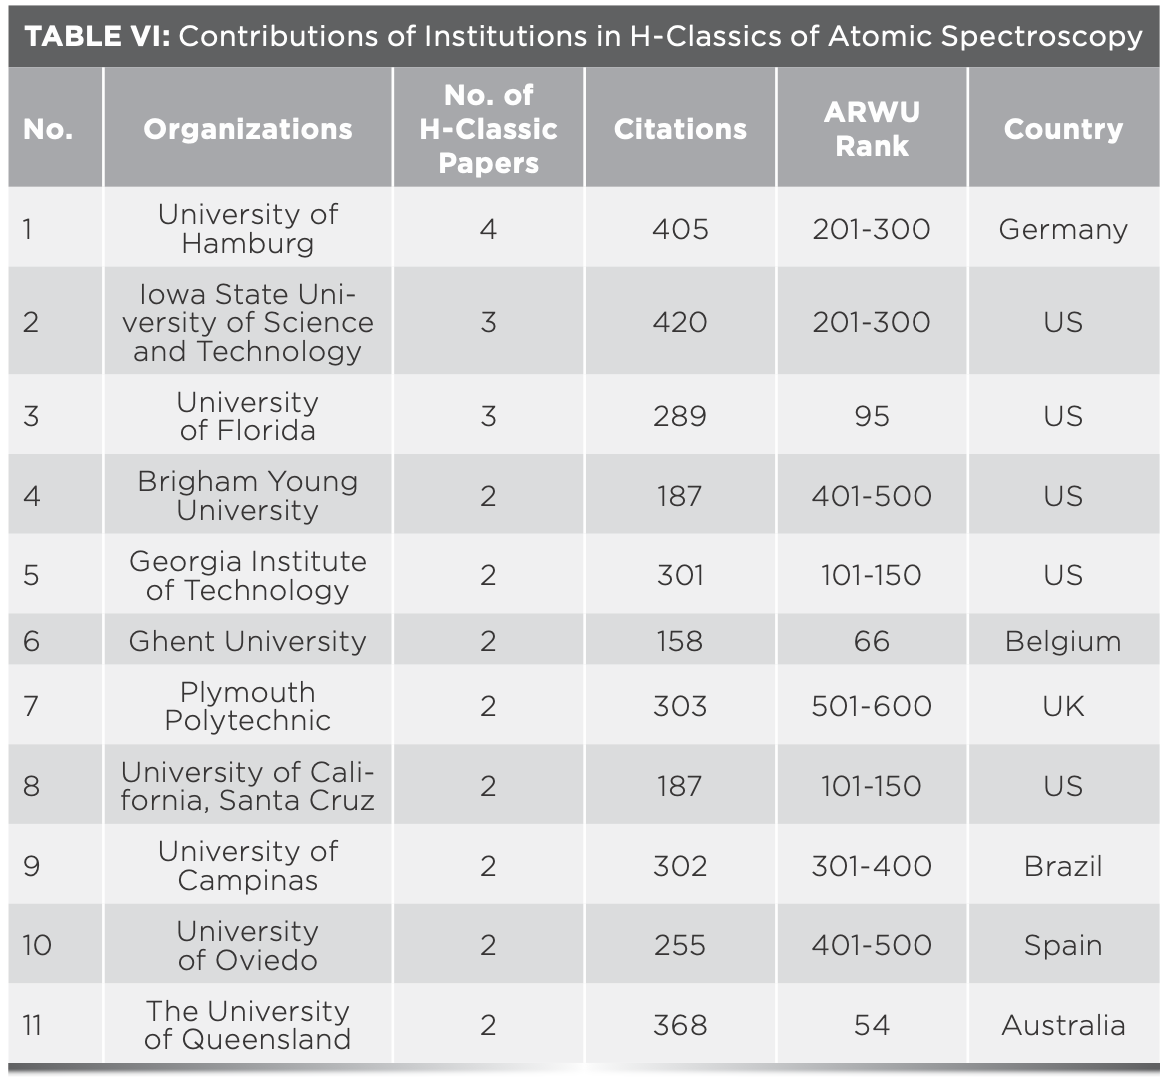
Contributions from institutions is determined based on the address provided by authors in their publications. Table VI illustrates the scientific influence of institutions, in terms of publications (with more than one publication) and citation counts.
It is observed that a few H-Classics papers in atomic spectroscopy were published by authors from lower ranked or unranked universities, which include Universidade Federal do Rio de Janeiro (Brazil), Adam Mickiewicz University (Poland), Universidad Nacional de San Luis (Argentina). This information negates the general perception that only top ranked institutions publish high-quality papers.
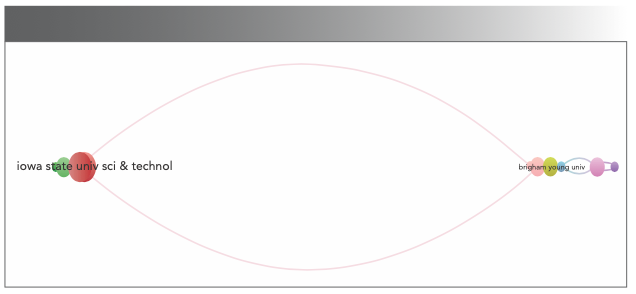
Figure 8 illustrates the bibliographic coupling perspective of institutions (based on the affiliation of authors). The interconnections show the author of institutions citing the same reference document with similar profiles. Iowa State University stands out with three papers. In terms of citations, University of Toronto ranked as the top institution (n = 503) followed by Universidade Federal do Rio de Janeiro, Brazil (n = 427).
FIGURE 8: Bibliographic coupling perspective of institutions.
Conclusion
This paper provides an insight into historical developments in the field of atomic spectroscopy using H-Classics. A few key findings are summarized below:
- 64 Atomic Spectroscopy H-Classic papers were identified between 1968–2015, and the total citation count ranges from 64 to 503.
- Amongst those 64 H-Classics, paper authored by Mitchell (40) and others published in Nature about super-resolving phase measurements with a multiphoton entangled state received the max citations.
- Ficek (42) from The University of Queensland authored most H-Classic publications in atomic spectroscopy with a max citations total of 372.
- Iowa State University of Science and Technology, the University of Florida, and the University of Hamburg were the major contributors for H-Classics in atomic spectroscopy.
- The United States appeared to be the most productive country and forms the major core of journals, followed by Germany, Canada, and Spain.
- 80% of H-Classics papers were published in Q1 ranked journals, 9% in Q2 ranked journals, and 6% in Q3 ranked journals, which implies that H-Classic papers were not limited only to prestigious Q1 indexed journals since 17% of these papers were published in Q2 and Q3 ranked journals.
- 56.2% of H-Classic papers were funded by agencies worldwide. Funding was overwhelmingly supported by the United States (Defense Advanced Research Projects Agency (DARPA), National Science Foundation (NSF), and the United States Department of Defense) followed by European Union agencies for atomic spectroscopy.
Finally, this study is quite significant in understanding past, current, and future trends in atomic spectroscopy. It will contribute to create awareness about trends in atomic spectroscopy, amongst research communities, government organizations, and funding bodies.
References
(1) D. Mishra et al., Ind. Manag. Data Syst. 116, 1331–1355 (2016).
(2) P. Kokol, Cybern. Syst. 49, 95–102 (2018).
(3) Y. Cai, W. Lu, L. Wang, and W. Xing, Int. J. Softw. Eng. Knowl. Eng. 25, 551–571 (2015).
(4) V. Garousi and J.M. Fernandes, Inf. Softw. Technol. 71, 108–128 (2016).
(5) J.A. Moral-Munoz, M.J. Cobo, F. Chiclana, A. Collop, and E. Herrera-Viedma, IEEE Trans. Intell. Transp. Syst. 17, 993–1001 (2016).
(6) J.M. Merigo, M.J. Cobo, S. Laengle, D. Rivas, and E. Herrera-Viedma, Soft Comput. 23, 1477–1497 (2019).
(7) D. Simon, K. Fischbach, and D. Schoder, Commun. Assoc. Inf. Syst. 32 (2013). doi:10.17705/1CAIS.03201.
(8) T. Bertoncel, M. Mesko, and M.P. Bach, Big Data for Smart Factories: A Bibliometric Analysis (IEEE, New York, 2019).
(9) H. Chen, R.H.L. Chiang, and V.C. Storey, Mis Q. 36, 1165–1188 (2012).
(10) D. Gupta and R. Rani, J. Inf. Sci. 45, 322–340 (2019).
(11) H. Liao et al., Sustainability 10, 166 (2018).
(12) D. Mishra, A. Gunasekaran, T. Papadopoulos, and S.J. Childe, Ann. Oper. Res. 270, 313–336 (2018).
(13) F. Blanco-Mesa, J.M. Merigo, and A.M. Gil-Lafuente, J. Intell. Fuzzy Syst. 32, 2033–2050 (2017).
(14) W. Liu and H. Liao, Int. J. Fuzzy Syst. 19, 1–14 (2017).
(15) J.M. Merigo, A.M. Gil-Lafuente, and R.R. Yager, Appl. Soft Comput. 27, 420–433 (2015).
(16) F. Mukhlif, J.O. Hodonu-Wusu, K. A. Bin Noordin, Z. M. Kasirun, in 2018 IEEE Student Conference on Research and Development (IEEE, New York, 2018).
(17) A. Eshraghi, N.A. Osman, H. Gholizadeh, S. Ali, and B. Shadgan, Biomed. Eng. OnLine. 12, 119 (2013).
(18) N.A. Mahon and C.W. Joyce, J. Plast. Surg. Hand Surg. 49, 52–58 (2015).
(19) F. O’Kelly, G.J. Nason, L.C. McLoughlin, H.D. Flood, and J.A. Thornhill, J. Pediatr. Urol. 11(2), 85 (2015). doi:10.1016/j.jpurol.2014.11.022.
(20) N.A. Mahon, C.W. Joyce, S. Thomas, E. Concannon, and D. Murray, Arch. Plast. Surg. 42, 559 (2015).
(21) A.W.K. Yeung, T.K. Goto, and W. K. Leung, Front. Hum. Neurosci. 11 (2017).
(22) A. Fornari and C. Carboni, Int. Urogynecology J. 29, 1429–1433 (2018).
(23) Y. Huo et al., Int. J. Surg. 18, 28–33 (2015).
(24) V. Perez-Cabezas et al., Scientometrics 116, 555–568 (2018).
(25) A.W.K. Yeung, Front. Hum. Neurosci. 12 (2018).
(26) L. A. Holzer, A. Leithner, and G. Holzer, J. Osteoporos 2015, 1–12 (2015).
(27) K. Arul and A. Mesfin, J. Racial Ethn. Health Disparities 4, 854–865 (2017).
(28) S. Adnan and R. Ullah, J. Endod. 44, 1650–1664 (2018).
(29) Y.-T. Yang et al., Comput. Methods Programs Biomed. 122, 471–479 (2015).
(30) Z. Rahman and V.P. Singh, Environ. Monit. Assess. 191, 419 (2019).
(31) L.B.M.L.S. Brown, Spectroscopy 30, 8–13 (2015).
(32) D. Tranfield, D. Denyer, and P. Smart, Br. J. Manag. 14, 207–222 (2003).
(33) E. Garfield, Science 144, 649–654 (1964).
(34) M.A. Martínez, M. Herrera, J. López-Gijón, and E. Herrera-Viedma, Scientometrics 98, 1971–1983 (2014).
(35) A.-R. Ramos-Rodríguez and J. Ruíz-Navarro, Strateg. Manag. J. 25, 981–1004 (2004).
(36) J. Toennies and A. Vilesov, Ann. Rev. Phys. Chem. 49, 1–41 (1998)
(37) I. Ushijima, M. Takamoto, M. Das, T. Ohkubo, and H. Katori, Nature Photonics 9, 185–189 (2015).
(38) K. Van Tilburg, N. Leefer, L. Bougas, and D. Budker, Phys. Rev. Lett. 115, 011802 (2015).
(39) M.F. Silva, E.S. Cerutti, and L.D. Martinez, Microchim. Acta. 155, 349 (2006).
(40) M.W. Mitchell, J.S. Lundeen, and A.M. Steinberg, Nature 429, 161–164 (2004).
(41) M.M. Kessler, Am. Doc. 14, 10–25 (1963).
(42) Z. Ficek and R. Tanaś, Phys. Rep. 372, 369–443 (2002).
Muhammad Rahil Rafiq and Sadiq M. Sait are with the Center of Communications and IT Research in the Research Institute at King Fahd University of Petroleum & Minerals, in Dhahran, Saudi Arabia. Direct correspondence to: sadiq@kfupm.edu.sa ●
This article was the subject of a Letter to the Editor piece as well as its response from the editors of Spectroscopy.
Atomic Perspectives: Highlights from Recent Columns
March 3rd 2025“Atomic Perspectives,” provides tutorials and updates on new analytical atomic spectroscopy techniques in a broad range of applications, including environmental analysis, food and beverage analysis, and space exploration, to name a few. Here, we present a compilation of some of the most popular columns.