A Highly Selective Colorimetric and “Turn-Off” Fluorimetric Probe Based on Unsymmetrical Naphthalene Formaldehyde Derivatives for the Detection of CN− in Aqueous Media
A novel hydrazone-based CN− fluorescent probe, HNT, was synthesized by 1-hydrazine methyl-2-naphthol and 2,3,4-trihydroxybenzaldehyde. CN− has stronger basicity and a superior hydrogen-bonding ability than other anions. Therefore, CN− can deprotonate naphthalene hydroxyl in fluorescent probe HNT, which induced the bright yellow fluorescence that was quenched before changing the color of the solution from yellow to orange. This color change indicates that fluorescent probe HNT showed selective recognition of CN− and was not interfered with by other anions. HNT can quantitatively detect CN−, and the detection limit is 6.93 × 10⁻⁷ M. The manufactured HNT test strip could also quickly detect CN−, which indicates that HNT has certain application value.
Cyanogen has attracted extensive attention because of its outstanding virulence and practicability among many anions. The toxicity of CN− can cause serious harm to the environment and living organisms (1). When living organisms ingest a certain amount of CN− through respiration, their digestive tract, or the surface of their skin, CN− will inhibit the activity of various enzymes in cells, causing symptoms such as vomiting, convulsions, and even central respiratory failure and death (2–4). Cyanide is also widely used in industrial production to synthesize polymers fibers and resins, extract gold, and synthesize various herbicides, which increases the possibility of life being harmed by CN− (5–7). The United States and the World Health Organization (WHO) stipulates that the maximum content of CN− in drinking water should not exceed 1.9 μmol/L (8). Given this regulation, the synthesis of a fluorescent probe with a high sensitivity, low manufacturing cost, short response time, and specific recognition of CN−, is significant to the environment and organisms. In the literature, probes mainly detect CN− through mechanisms such as addition, hydrogen bonding, and deprotonation (9–13). Among them, deprotonation uses CN with strong basicity to undergo deprotonation reaction with the hydroxyl or imino group in the probe to change the electron distribution in the probe molecule and generate corresponding photoelectrochemical changes. Currently, the probe is the most effective method for detecting CN− concentration (14–18). Our team is also very interested in such probes (19–28).
In this work, 2-hydroxy-1-naphthaldehyde derivatives were used as luminescent groups because of their good spectral characteristics (14,29,30), which improves the sensitivity of these probes. To ensure the probe has better selectivity and recyclability, we designed a probe based on naphthaldehyde (31–33). After the probe reacted with CN−, the molecule was deprotonated because of the strong basicity of CN−. The fluorescence and UV spectrum of the molecule changed simultaneously, the color of the solution changed from yellow to orange, and the fluorescence was quenched at λex = 365 nm. The results show that the HNT flourescence probe can selectively recognize CN−. The detection limit of the HNT probe for cyanide has been as low as 6.93 × 10⁻⁷ M. In addition, we have made a test strip for the HNT probe, which can quickly identify and detect the contents of water samples. According to the mechanism of the above process, we verified it by 1H nuclear magnetic resonance (NMR), UV-vis, and other different methods. Besides that, we also made density functional theory (DFT) calculations.
Experimental
Reagents and Apparatus
All reagents and solutions are commercially available and analytically pure without further purification. The experimental water was double distilled and prepared by a standard method. The tetrabutyl ammonium salt (F−, Cl−, Br−, I−, AcO−, ClO−, HSO−, and H2PO4−) of the anion and the sodium salt (CN− and SCN−) of the anion were analytically pure and purchased from Alfa-Aesar Chemical Reagent Co. and stored in a vacuum dryer.
UV-vis spectra were measured on a Shimadzu UV-2550 UV spectrometer. The fluorescence emission spectrum was recorded on a Shimadzu RF-5301 fluorescence spectrometer; 1H NMR used tetramethylsilane (TMS, δ grade) as the internal standard and was measured at 600 MHz on a Mercury-400BB spectrometer. The melting point was measured on the X-4 digital micro melting point meter. Electrospray ionization–mass spectrometry (ESI-MS) was measured on a ZAB-HS instrument.
Synthesis and Characterization of Probe HNT
The intermediate 1-hydrazine methyl-2-naphthol was synthesized according to the method in the literature (34). 2-hydroxy-1-naphthalaldehyde hydrazine (0.9309 mg, 5 mM) and 2,3,4-trihydroxybenzaldehyde (0.7706 mg, 5 mM) were added to a round bottom flask with dimethylformamide (DMF) (25 mL) as the solvent and refluxed under stirring at 120 °C for 7 h before being cooled to room temperature, filtered to obtain a yellow solid, and crystallized with water ethanol to obtain a pure product (Scheme 1). The yield was 72% (m.p. > 300 °C). 1H-NMR spectral conditions and results are as follows: H-NMR (600 MHz, DMSO-d6): 12.92 (s, 1H),11.20(s, 1H), 10.00 (s, 1H), 8.91 (s, 1H), 8.65 (s, 1H), 8.57 (s, 1H), 8.53 (s, 1H), 8.04 (d, 1H), 8.00 (d, 1H), 7.60 (s, 1H), 7.43 (s, 1H), 7.24 (s, 1H), 7.01 (s, 1H). IR(KBr; cm−): 3442 (s), 1625 (s), 1390 (m), 1353 (m), 1320 (m), 1177 (m), 993 (w), 840 (w), 786 (m), 742 (w); m/z (ES+): 321.08 [C18H13O4N2-H]+.
SCHEME 1: The synthetic procedure for sensor HNT.

Results and Discussion
The synthesis steps of fluorescence probe HNT were introduced in detail, and its structure has been characterized by 1H NMR, infrared (IR) spectroscopy, and ESI–MS. Next, the influence of different anions (F−, Cl−, Br−, I−, AcO−, H2PO4−, HSO4−, ClO4−, CN-, and SCN-) (1.0 × 10⁻² M) on the spectral changes of chemical probe were studied by UV spectroscopy and fluorescence spectroscopy.
After adding 50 equivalents of different anions (F−, Cl−, Br−, I−, AcO−, H2PO4−, HSO4−, ClO4−, CN-, and SCN-), a dimethyl sulfoxide (DMSO):water (1:1, v:v) solution containing the fluorescence probe HNT was utilized as the host to fully react and observe the changes of the solution. The results showed that the color of the solution containing the HNT probe changed from bright yellow to orange only after CN− was added. At the same time, the corresponding absorption spectrum data showed that the strong absorption peak at 375 nm disappeared, and a new absorption peak appeared at 428 nm. However, other anions (F−, Cl−, Br−, I−, AcO−, H2PO4−, HSO4−, ClO4−, CN-, and SCN-) did not cause any significant change in the absorption spectrum of the HNT solution. (Figure 1a).
FIGURE 1: (a) Absorbance luminosity change spectrum of various anions added to sensor HNT solution (2.0 × 10⁻⁵ M). Inset: Photographs of other anions and CN− color changes added to HNT solution under visible light. (b) The fluorescence intensity change spectrum of various anions added to sensor HNT solution (2.0 × 10⁻⁵ M). Inset: Photographs of other anions and CN− color changes added to HNT solution under 365 nm light.
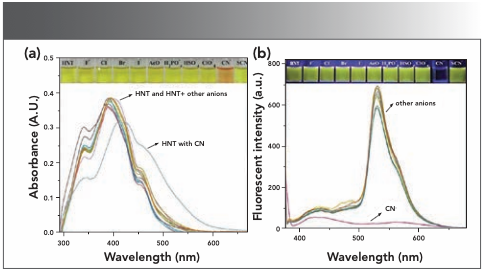
The dimethyl sulfoxide:water (1:1, v:v) solution containing the host HNT was excited at 365 nm of the UV lamp. The emission peak at 533 nm was significantly reduced only when the CN− ions were added (Figure 1b). Under the 365 nm of lamp, the solution was observed to change from bright yellow to colorless. When other anions were present in solution, the fluorescence color and emission intensity of the host HNT had no obvious change.
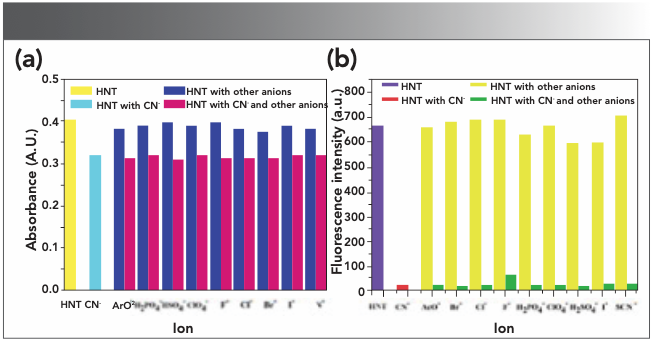
To verify the anti-interference ability of the probe HNT, we investigated the recognition ability of the probe HNT to CN− in the presence of various anions (F-, Cl-, Br-, I-, AcO-, H2PO4-, HSO4-, ClO4-, CN-, and SCN-) by recording the UV-vis spectrum and fluorescence spectrum. As shown in Figure 2a, there was no obvious photochemical change in dimethyl sulfoxide:water (1:1, v:v) solution with other anions and host HNT. When CN− was added to each group of solutions, the UV-vis spectrum and emission intensity were similar to the solutions, which contain CN− only. The results showed that the existence of other competitive ions had an inconsiderable effect on the specific detection of CN− (Figure 2b).
FIGURE 2: (a) Absorbance spectrum change diagram of adding 20 equivalents of various anions and 20 equivalents of CN− to probe HNT solution (2.0 × 10⁻⁵ M) (λem = 428 nm). (b) The fluorescence intensity change diagram of adding 20 equiv. of various cations and 20 equivalents of CN− to probe HNT solution (2.0 × 10⁻⁵ M).
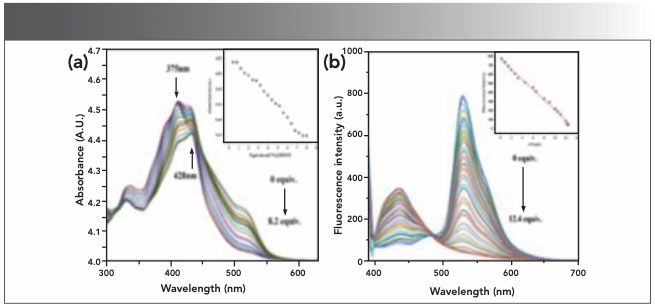
The interaction between HNT and CN− was further studied by UV-vis and fluorescence titration. As shown in Figure 3a, once the concentration of CN− increased from 0.0 to 8.2 equivalents, the absorption peak at 375 nm decreased and at 428 nm it increased gradually. With the increased CN− concentration, the emission intensity at 533 nm decreased gradually under a 365 nm excitation wave. When the concentration of CN− increases to 12.4 equivalents, the fluorescence emission intensity is the weakest (Figure 3b).
FIGURE 3: (a) Absorption spectrum of HNT (2.0 × 10⁻⁵ M) in various concentrations of CN− are acquired in DMSO:H2O (1:1, v/v) solution. Inset: Diagram of the relationship between absorbance and the number of equivalents of CN−. (b) Fluorescence spectra of HNT (2.0 × 10⁻⁵ M) in various concentrations of CN− are acquired in dimethyl sulfoxide:water (1:1, v/v) solution. Inset: Diagram of the relationship between fluorescence intensity and the number of equivalents of CN−.
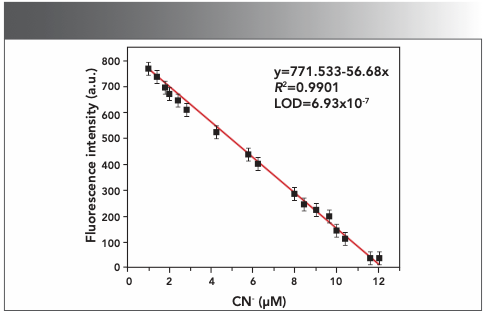
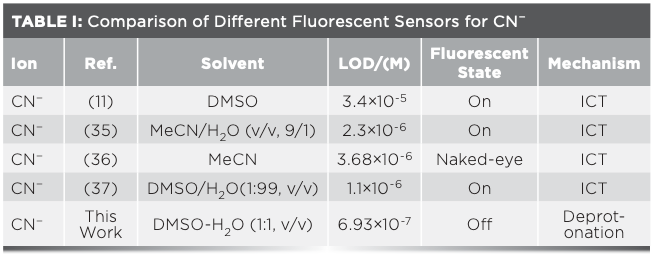
According to fluorescence titration spectrum, the changes in the fluorescence intensity of HNT with CN− were almost linear (Figure 4). We calculated the fluorescence detection limit of the HNT probe for CN− by using formula 3SB/S (where S is the slope of calibration curve and SB is the standard deviation of blank solution). The results showed that the detection limit of the fluorescence spectrum was 6.93 × 10⁻⁷ M for cyanide, which was far lower than the maximum level of cyanide in drinking water from the WHO guidelines. Using the same calculation formula, the detection limit of UV-vis titration is 2.73 × 10⁻⁶ M. Compared with the recently reported cyanide fluorescent probe, HNT could detect cyanide with lower concentration by UV and fluorescence methods (Table I).
FIGURE 4: Fluorescence detection limit of HTN on CN− in dimethyl sulfoxide:water (1:1, v/v) solutions.
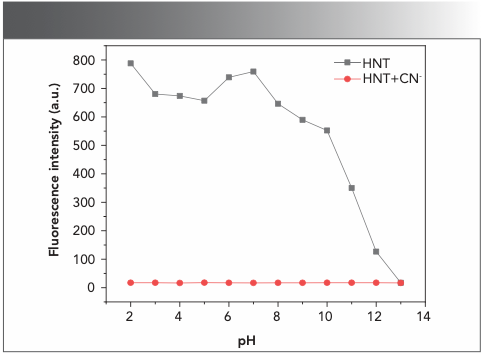
To further study the applicable range of probe HNT when mixed with CN−, we used fluorescence spectrometry. Using fluorescence spectrometry allowed us to study the effect of pH on the recognition process. CN− was added to the HNT buffer solution at different pH levels, and its fluorescence emission intensity was measured. As shown in Figure 5, the probe HNT showed significant fluorescence reduction to CN− in the pH range of 2.0–9.0, and there was no obvious change in other working ranges. This result indicated that pH has some influence on the recognition of CN−.
FIGURE 5: pH response of HNT and HNT-CN− in the dimethyl sulfoxide:water (v:v, 1:1) solution.
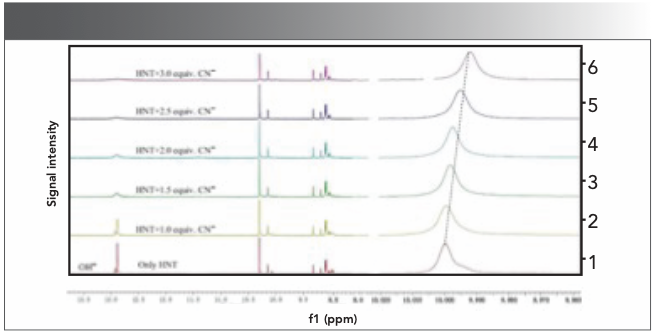
We further discussed the recognition mechanism of probe molecules to CN− through 1H NMR titration and DFT calculation: Through 1H NMR titration experiments, we can see that the host molecules showed characteristic structural changes after CN− was added to the solution of host HNT. As shown in Figure 6, the host HNT molecule has a strong peak corresponding to naphthalene hydroxyl at 12.48 ppm. When 1 equivalent of CN− (0.1 mol/L, DMSO-d6) was added to the host molecule in total, the -OH peak at 12.48 ppm disappears. Because the strong basicity of CN−, a deprotonation reaction with strong acid is caused easily. Moreover, through 1H NMR spectra, we found that the position of aromatic peak gradually moved to the up field with the increase of CN−. After adding CN−, electron delocalization and intramolecular charge transfer occurred inside the host HNT.
FIGURE 6: Partial 1H NMR spectra of HNT in dimethyl sulfoxide upon addition of CN−.
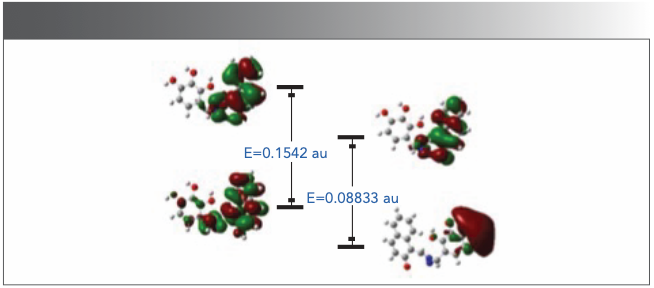
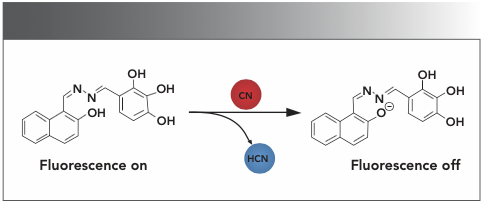
To further explore the reaction mechanism of HNT and CN−, DFT calculation was carried out and analysis was carried out according to B3LYP/6-31G theory. As shown in Figure 7, it showed that the highest unoccupied molecular orbital (HOMO) and the lowest unoccupied molecular orbital (LUMO) of HNT-related molecules were almost distributed on the naphthalene ring. After adding CN−, the hydroxyl group in the naphthalene ring was deprotonated, and the electrons in LUMO were transferred to the benzene ring of 2,3,4-trihydroxybenzaldehyde. The energy gaps between them is 0.15452 au and 0.08831 au, respectively. The energy gaps indicated that the energy gap decreases and the system is more stable after the interaction between HNT and CN-. Based on the 1H-NMR titration and DFT results, a possible recognition mechanism of the system was carried out by the Scheme 2.
FIGURE 7: The DFT calculates a graph of LUMOs, HOMOs, and energy gap for HNT and HNT with CN−.
Scheme 2: Proposed binding mode of chemosensor HNT with anions in the solution.
Application
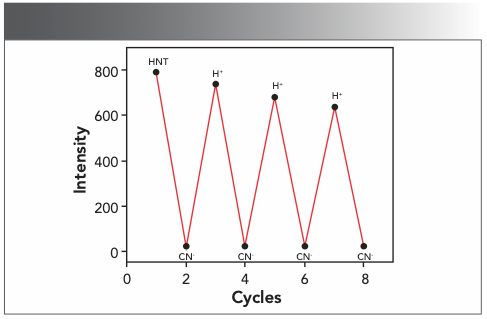
We tested the reversibility of detection and recognition of CN− by adding hydrochloric acid to the mixed solution of HNT and CN−. As shown in Figure 8, the fluorescence intensity of the HNT solution with CN− was marked as “Off”, and the fluorescence emission intensity was significantly reduced at 533 nm. When concentrated hydrochloric acid was added to solution of HNT and CN−, the fluorescence emission intensity was significantly enhanced, and the labeling phenomenon was labeled as “On.” After adding CN− continuously, the mixed solution showed a decrease in fluorescence intensity, which indicated that the HNT has reversibility when recognizing and detecting CN−. In repeated operations, the phenomenon of “Off–On–Off” was repeated many times with almost no fluorescence loss.
FIGURE 8: By adding H+ and CN− alternately in a dimethyl sulfoxide:water v/v = 1:1) solution of HNT-CN-, the reversibility of the sensor HNT was achieved (λex = 365 nm, λem = 533 nm).
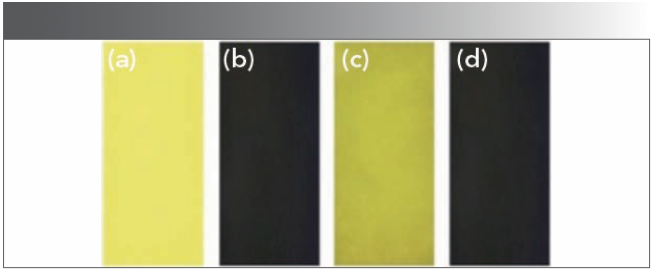
To verify the recognition and detection of CN− by host HNT in actual environment, we have made a test paper based on host HNT. Test strips that were 4 cm long and 1 cm wide were prepared, soaked in a dimethyl sulfoxide solution of main HNT (0.01 mol/L) completely, and then dried in a vacuum drying oven. As shown in Figure 9, when the CN− reserve liquid is dripped onto the test strip, yellow color of the test strip changed to orange, and the yellow color was disappeared under the UV lamp. The above phenomenon proved that the test strips were used for rapid detection of CN− in aqueous solution.
FIGURE 9: Images of HNT on test papers under irradiation at 365 nm. (a) Only HNT, (b) after immersion in DMSO:H2O (v:v, 1:1) solution with CN−, (c) after immersion in a DMSO:H2O (v:v, 1:1) solution with other anions, and (d) after immersion in a DMSO:H2O (v:v, 1:1) solution with CN- and other anions.
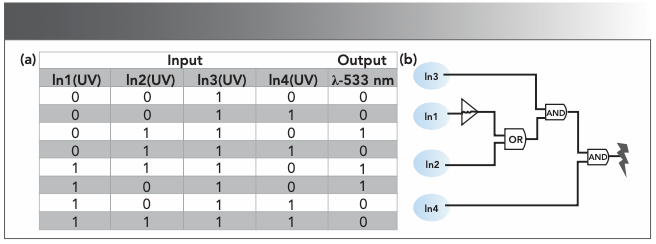
Based on the above properties, we used the photochromic ability of HNT under UV-vis light stimulation to design a logic circuit containing input and output signals (38). The logic circuit was designed with four types of input signals: (In1: 254 nm UV light; In2: >500 nm visible light; In3: CN; and In4: HCl) and output signal (OUT1: emission intensity at 533 nm). The “open” state is assigned the boolean value “1”, and the “closed” state is assigned the boolean value “0”. When the emission intensity at 533 nm drops to the lowest, the output signal is regarded as an open state, the boolean value is “1”. The situation is regarded as closed, and the boolean value is “0”. The logic circuit diagram corresponding to the truth table is shown in Figure 10.
FIGURE 10: (a) Truth table for the logic circuit; (b) Implication logic gates represented by IEEE-recommended symbols.
Conclusions
In this paper, we designed and synthesized a new type of high-sensitivity sensor HNT, which could colorimetric and fluorescent response to CN− in aqueous solution, and the minimum detection limit is 6.93 × 10⁻⁷ M. Fortunately, the fluorescence of HNT changes after adding CN− and AcOH, so it can be applied to the ultra-sensitive Implication logic circuit. In addition, we have produced test strips that were used to quickly and easily detect CN−. Based on the various properties and applications of probe HNT, it was concluded that probe HNT is a promising CN− indicator with strong anti-interference abilities, easy operation, fast response, and low detection limit.
Acknowledgment
We gratefully acknowledge the support of the National Nature Science Foundation of China (No. 21467012).
Declaration of Competing Interest
There are no conflicts to declare.
References
(1) R. Ali, S. K. Dwivedi, H. Mishra, and A. Misra, Dye and Pigment 175, 108163 (2020).
(2) S. Ahmadi, H.A. Dabbagh, P. Grieco, and S. Balalaie, Spectrochim Acta - Part A Mol Biomol Spectrosc. 228, 117696 (2020).
(3) Ö. Şahin, Ü.Ö. Özdemir, N. Seferoğlu, B. Aydıner, M. Sarı, and T. Tunç, Tetrahedron 72, 5843–5852 (2016).
(4) C.B. Bai, X.Y. Liu, J. Zhang, R. Qiao, K. Dang, and C. Wang, ACS Omega 5, 2488–2494 (2020).
(5) A. Mondal, A. Hazra, J. Chakrabarty, J.C. Bose, and P. Banerjee, ACS Omega 5, 6576 (2020).
(6) M.S. Kim, D. Yun, J.B. Chae, H. So, H. Lee, and K. Kim, Sensors 19, 5458 (2019).
(7) P. Alreja and N. Kaur, Inorg. Chem. Commun. 110, 107600 (2019).
(8) X.S. Shang, N.T. Li, Z.Q. Guo, and P.N. Liu, Dyes and Pigments 4, (2016).
(9) J.M. Jung, D. Yun, H. Lee, K.T. Kim, and C. Kim, Sensors Actuators, B Chem 297, 126814 (2019).
(10) S. Dini and H. Khanmohammadi, Spectrochim Acta - Part A Mol Biomol Spectrosc. 222, 117157 (2019).
(11) J. Chao, M. Xu, Y. Liu, Y. Zhang, F. Huo, and C. Yin, ChemistrySelect 4, 3071–3075 (2019).
(12) X.G. Tang, H.L. Liu, and S.Z. Pu, Photochem. Photobiol. Sci. 15, 1579–1585 (2016).
(13) X.S. Shang, N.T. Li, Z.Q. Guo, and P.N. Liu, Dye Pigment 132, 167–176 (2016).
(14) X.Q. Ma, Y. Wang, T.B. Wei, L.H. Qi, X.M. Jiang, and J.D. Ding, Dye Pigment 164, 279–286 (2019).
(15) G.F. Gong, Y.Y. Chen, Y.M. Zhang, Y.Q. Fan, Q. Zhou, and H.L. Yang, Soft Matter 15, 6348–6352 (2019).
(16) Q Zhao, G.F. Gong, H.L. Yang, Q.P. Zhang, H. Yao, and Y.M. Zhang, Polym. Chem. 11, 5455–5462 (2020).
(17) H.H. Yang, P.P. Liu, J.P. Hu, H. Fang, Q. Lin, and Y. Hong, Soft Matter 16, 9876–9781 (2020).
(18) W.J. Qu, H.H. Yang, J.P. Hu, P. Qin, X.X. Zhao, and Q. Lin, Dye Pigment 186, 108949 (2021).
(19) C. Long, J.H. Hu, Q.Q. Fu, and P.W. Ni, Spectrochim Acta - Part A Mol Biomol Spectrosc. 219, 297–306 (2019).
(20) P.W. Ni, Y. Yao, Q.Q. Fu, C. Long, and J.H. Hu, J. Appl. Spectrosc. 87, 904–910 (2020).
(21) C. Long and P.W. Ni, J. Photochem. Photobiol. A Chem. 379, 105–111 (2019).
(22) Q.Q. Fu, J.H. Hu, Y. Yao, Z.Y. Yin, K. Gui, and N. Xu, J. Photochem. Photobiol. A Chem. 391, 112358 (2020).
(23) J.H. Hu, C. Long, Q.Q. Fu, P.W. Ni, and Z.Y. Yin, J. Photochem. Photobiol. A Chem. 379, 105–111 (2019).
(24) J.H. Hu, Y. Sun, J. Qi, Q. Li, and T.B. Wei, Spectrochim. Acta - Part A Mol. Biomol. Spectrosc. 175, 125–133 (2017).
(25) Z.Y. Yin, J.H. Hu, K. Gui, Q.Q. Fu, Y. Yao, and F.L. Zhou, J. Photochem. Photobiol. A Chem. 396, 112542 (2020).
(26) P.X. Pei, J.H. Hu, Y. Chen, Y. Sun, and J. Qi, Spectrochim. Acta - Part A Mol. Biomol. Spectrosc. 181, 131–136 (2017).
(27) P.X. Pei, J.H. Hu, C. Long, and P.W. Ni, Spectrochim Acta - Part A Mol. Biomol. Spectrosc. 198, 182–187 (2018).
(28) J.H. Hu, J.B. Li, Y. Sun, P.X. Pei, and J. Qi, RSC Adv. 7, 29697–29701 (2017).
(29) J.H. Kang, S.Y. Lee, H.M. Ahn, and C. Kim, Sensors Actuators, B Chem. 6, 24225–24234 (2017).
(30) X.Q. Ma, Y. Wang, T.B. Wei, L.H. Qi, X.M. Jiang, and J.D. Ding, Dye Pigment 164, 279–286 (2019).
(31) L. Patra, K. Aich, S. Gharami, and T.K. Mondal, J. Lumin. 201, 419–426 (2018).
(32) P. Ravichandiran, A. Boguszewska-Czubara, M. Masłyk, A.P. Bella, P.M. Johnson, and S.A. Subramaniyan, Dye Pigment 172, 107828 (2020).
(33) K. Rezaeian, H. Khanmohammadi, and A. Talebbaigy, Anal. Methods 12, 1759–1766 (2020).
(34) D. Roy, C. Ahakraborty, and R. Ghosh, Spectrochim. Acta - Part A Mol. Biomol. Spectrosc. 191, 69–78 (2018).
(35) W. Wang, M. Wu, H. Liu, Q. Liu, Y. Gao, and B. Zhao, Tetrahedron Letter 60, 1631–1635 (2019).
(36) A. Ozdemir and S. Erdemir, J. Photochem. Photobiol. A Chem. 390, 112328 (2020).
(37) R.V. Rathod, S. Bera, and D. Mondal, Spectrochim Acta - Part A Mol. Biomol. Spectrosc. 238, (2020).
(38) G. Sun, W. Chen, Y. Liu, X. Jin, Z. Zhang, and J. Su, Dye Pigment 176, 108224 (2020).
Ying Yao, Kai Gui, Xu-Mei Fu, Hui-Xin Liu, and Jing-Han Hu are with the College of Chemical and Biological Engineering at Lanzhou Jiaotong University, in Lanzhou, China. Correspondence should be addressed to Jing-Han Hu at the following e-mail address: 435832314@qq.com. ●

New Study Reveals Insights into Phenol’s Behavior in Ice
April 16th 2025A new study published in Spectrochimica Acta Part A by Dominik Heger and colleagues at Masaryk University reveals that phenol's photophysical properties change significantly when frozen, potentially enabling its breakdown by sunlight in icy environments.
Tracking Molecular Transport in Chromatographic Particles with Single-Molecule Fluorescence Imaging
May 18th 2012An interview with Justin Cooper, winner of a 2011 FACSS Innovation Award. Part of a new podcast series presented in collaboration with the Federation of Analytical Chemistry and Spectroscopy Societies (FACSS), in connection with SciX 2012 ? the Great Scientific Exchange, the North American conference (39th Annual) of FACSS.
New Fluorescence Model Enhances Aflatoxin Detection in Vegetable Oils
March 12th 2025A research team from Nanjing University of Finance and Economics has developed a new analytical model using fluorescence spectroscopy and neural networks to improve the detection of aflatoxin B1 (AFB1) in vegetable oils. The model effectively restores AFB1’s intrinsic fluorescence by accounting for absorption and scattering interferences from oil matrices, enhancing the accuracy and efficiency for food safety testing.
Can Fluorescence Spectroscopy Evaluate Soil Dissolved Organic Matter Dynamics?
February 20th 2025A new study published in Chemical Engineering Journal by researchers from Northeast Agricultural University in China reveals that biochar aging, influenced by environmental factors like UV exposure and wet-dry cycles, alters dissolved organic matter composition and affects its effectiveness in remediating cadmium-contaminated soil.
Geographical Traceability of Millet by Mid-Infrared Spectroscopy and Feature Extraction
February 13th 2025The study developed an effective mid-infrared spectroscopic identification model, combining principal component analysis (PCA) and support vector machine (SVM), to accurately determine the geographical origin of five types of millet with a recognition accuracy of up to 99.2% for the training set and 98.3% for the prediction set.