High-Resolution ICP-OES for the Determination of Trace Elements in a Rare Earth Element Matrix and in NdFeB Magnetic Materials
Rare earth elements (REEs) have become indispensable in many electronic, optical, magnetic, and catalytic applications because of their specific properties such as magnetism and phosphorescence, as well as their ability to both donate and accept electrons.
Rare earth elements (REEs) have become indispensable in many electronic, optical, magnetic, and catalytic applications because of their specific properties such as magnetism and phosphorescence, as well as their ability to both donate and accept electrons. Production of high-purity REEs is now required for advanced technology applications. Therefore, it is important to be able to determine impurity levels. In the REE mining process, the extracted REE contains many other REEs and because of the line-rich spectra emitted by these elements in inductively coupled plasma–optical emission spectrometry (ICP-OES), the quality of the final result may be compromised. The quality of the results will also be more important when the application involves NdFeB magnetic materials. Results obtained on analysis of REE impurities at the parts-per-million level in cerium oxide and gadolinium oxide matrices and on NdFeB magnetic materials are shown and discussed here.
Rare earth elements (REEs) are being used progressively in advanced technologies because of their unique properties. One example where REEs impact our daily lives is smart phones. REEs exhibit not only magnetic properties, but also fluorescent properties. They are widely used for wind-power generators, computer disk drives, hybrid electric vehicles, and fluorescent lamps. REEs include 17 elements, all from the lanthanides group, and also yttrium. They are mainly extracted from the Earth's crust. Extracted ore usually contains 14 REEs combined together. Then there is a need to refine the ore to produce high-purity materials. Recycling is an alternative source for REEs, mainly from fluorescent lamps. In both cases, the refining process consists of several reduction and complexation reactions and, thus, there is a need for quality control of the refined high purity product. The analysis of traces of REEs in an REE matrix is then mandatory to control the quality of the refining process and the final product.
The NdFeB magnets are widely used for applications involving magnetic properties of REEs. The quality control of final NdFeB products is required to ensure that the expected magnetic properties are obtained. Analysis requires the capability to determine the major elements Nd, Fe, and B, and also traces of multiple elements with a high iron content.
Several techniques are available for elemental analysis, but inductively coupled plasma–optical emission spectrometry (ICP-OES) seems to be the most adequate. Thanks to its tolerance of the high salt concentration and its capability to determine trace and major elements in a single run because of the numerous wavelengths emitted by REEs or iron all over the spectrum, high-resolution ICP-OES seems to have definitive advantages for such applications.
This article describes the use of high-resolution ICP-OES for the analysis of refined REE materials, CeO2 and Gd2O3, and NdFeB magnet quality control.
Experimental
High-Purity REE Preparation
High-purity CeO2 and Gd2O3 were supplied and prepared by a customer who specialized in the REE recycling industry. No detail was given for the sample preparation.
CeO2 was prepared at 500 g/L and diluted to 20 g/L for analysis of La2O3 as impurity and diluted to 100 g/L for the analysis of Ca, Na, and K at low concentrations.
High-purity Gd2O3 was prepared at 100 g/L and diluted to 20 g/L for analysis of Tm2O3, Yb2O3, and Lu2O3 as impurities.
NdFeB Magnet Sample Preparation
NdFeB magnets were prepared using acid digestion at 10 g/L and analyzed directly with the ICP-OES system. Acid digestion was performed using nitric acid (5 mL HNO3 for 0.5 g of sample).
Calibration
For both high-purity REE and NdFeB magnet analysis, it was decided to use the standard addition technique. External calibration was not used to avoid sample effects and to ensure accuracy for sample analysis.
Standard addition was chosen because it allowed us to work directly in the high-purity sample; external calibration would have required the use of reagents that may affect accuracy because of potential impurities they may contain.
For standard addition preparation, Spex CertiPrep single-element standard solutions were used.
Choice of Wavelengths
Because REEs, and also iron at high concentrations, emit numerous wavelengths over the spectral range of the ICP-OES, the choice of analytical wavelengths should be conducted with great care. For these applications, the wavelength selection was done using tools that were provided with the ICP-OES instrument and also by taking advantage of the know-how of application laboratories on such applications.

Table I: Wavelengths used for analysis of CeO2 and Gd2O3 matrices
The wavelengths used for the analysis of CeO2 and Gd2O3 are shown in Table I. Table II displays the wavelengths used for NdFeB magnets analysis.
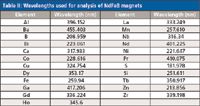
Table II: Wavelengths used for analysis of NdFeB magnets
Instrument
A Horiba Scientific Ultima Expert High Resolution ICP-OES system was used for the analysis. This instrument uses a 1-m focal length optic and is equipped with an optional high-density dual-grating system that uses a 4320-g/mm grating at 160–450 nm with resolution of <5 pm and a 2400-g/mm grating at 450–800 nm with a resolution of <11 pm. This dual-grating system is specially designed for REE-based applications, because most of these elements emit multiple wavelengths and require high resolution in the range of 300–450 nm.
A vertical radially viewed torch was used with the "Total Plasma View" feature and the original sheath gas device. The sheath gas device allows for the introduction of a high concentration of salts into the plasma, up to 300 g/L NaCl, without sacrificing performance. The "Total Plasma View" feature allows for the measurement of the whole normal analytical zone of the plasma where all atoms and ions emit their wavelengths.
Plasma parameters were optimized to obtain the best compromise between sensitivity and robustness. For the optimization of the sensitivity, the signal-to-background ratio (SBR) was optimized; the detection limit is inversely proportional to the SBR value (1,2). The robustness was monitored using the magnesium ratio because it is known as an effective method to evaluate robustness for ICP-OES (3,4).
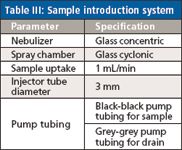
Table III: Sample introduction system
All parameters and details for the sample introduction system are given in Tables III and IV.
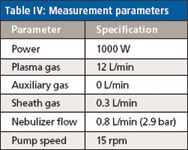
Table IV: Measurement parameters
Results and Discussion
High-Purity REE Analysis
Evaluation of the Need for High-Resolution ICP-OES
To evaluate the need for high resolution, profiles of samples were acquired using a low-resolution ICP-OES system with resolution at <8 pm on the spectral range.
Profiles obtained for La at 333.749 nm in the cerium matrix sample, using low-resolution and high-resolution ICP-OES, are shown in Figure 1. The profiles clearly show that low-resolution ICP-OES will not allow for accurate measurement because it is not possible to separate the wavelength of lanthanum, the impurity, from the wavelengths of cerium, the matrix. Using high-resolution ICP-OES solves the issue, and separation of the wavelength of lanthanum from the doublet of cerium is possible. Because an overlap is still observed, particular attention should be paid to accuracy and stability of the measurement for the high-purity REE sample analysis.
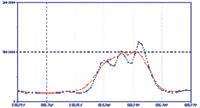
Figure 1: Profiles of La 333.749 nm with low resolution (red) and high resolution (blue).
Because of this overlap of the lanthanum wavelength with the cerium doublet, profiles were obtained for both the sample and the standard additions to evaluate the capability of the ICP-OES to accurately measure each addition. The obtained profiles (Figure 2) show a good separation for all analyzed solutions and no shift for the central wavelength of the lanthanum. This analysis confirms that the separation of the wavelengths is accurate enough and that intensities measured will not be affected by the overlap. It also confirms the ability of high-resolution ICP-OES to perform measurements of concentration in the expected range.
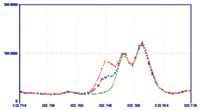
Figure 2: Profiles of La 333.749 nm for matrix 1 (green), standard addition 1 (20 ppm, blue), and standard addition 2 (40 ppm, red).
Profiles obtained for the sample and the standard addition for the analysis of lutetium at 261.542 nm in the gadolinium matrix are given in Figure 3. The obtained profiles clearly show that high resolution is again mandatory to ensure accuracy of the measurements and the final result. Even with a slightly lower resolution, the separation of the two wavelengths will not be effective, and then analysis will not be possible. The profiles obtained for the sample and the standard additions made for the calibration show that measurement is possible in the expected concentration range and that the overlap doesn't affect the shape of the peak and, consequently, the accuracy of the measurement.
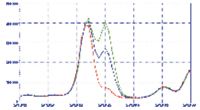
Figure 3: Profiles of Lu 261.542 nm for matrix 2 (red), standard addition 1 (5 ppm, blue), and standard addition 2 (10 ppm, green).
Evaluation of Sensitivity and Accuracy
The capability of high-resolution ICP-OES to accurately determine concentrations in different samples was evaluated. For this purpose, the analysis was performed on unspiked and spiked samples for each matrix. The sample used for the spike came from a different batch than the one analyzed without the spike; this possibly caused some variations in the original content even if both were expected to be quite similar. Results obtained for both spiked and unspiked samples are given in Tables V–VII.

Table V: Results obtained for the analysis of La2O3 in CeO2 matrix
All samples analyzed were in accordance with the specification, as shown by the results obtained on the unspiked sample. The results obtained show that a high sensitivity can be reached; some elements were measured at the sub-part-per-million level, corresponding to a few micrograms per liter of the element in the solution measured. The results obtained proved the capability of high-resolution ICP-OES to determine low concentrations of both REEs and other elements in a complicated matrix, down to a few parts per million in the original sample.

Table VI: Results obtained for the analysis of Ca, Na, and K in CeO2 matrix
The spikes were consistent with the high sensitivity required for these samples. Typically, spikes of 1 ppm were done for both the CeO2 and the Gd2O3 matrices, corresponding to concentrations down to 20 μg/L in samples. The results obtained on the spiked samples exhibit excellent accuracy, proving the capability to provide sensitive and accurate analysis for high-purity REEs.

Table VII: Results obtained for the analysis of Lu2O3, Tm2O3, and Yb2O3 in Gd2O3 matrix
Evaluation of Stability
Accuracy is not sufficient for the analysis of such matrices that can be done on batches of multiple samples, it is also necessary to evaluate the stability of the instrument over time. Thus, analyses of La in CeO2 nitrate as well as Tm, Lu, and Yb in Gd2O3 nitrate were conducted over 2 h and 90 min, respectively. The relative intensity, compared to the average value over the stability test was plotted as a function of time and the relative standard deviation was calculated. Results obtained (Figures 4 and 5) show perfect stability over time for both the CeO2 and the Gd2O3 matrix for all elements. The relative standard deviation (RSD) obtained was <1% for all elements in both matrices, which is similar to what can be expected in water with extreme values not varying more than 2% from the average value. When looking at Figures 4 and 5, absolutely no drift can be identified, proving the stability of the instrument and its capability to handle many samples with perfect accuracy.
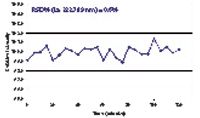
Figure 4: Stability test on La 333.749 nm in CeO2 20g/L.
NdFeB Magnetic Materials Analysis
Analysis of Major and Minor Elements
For the analysis of NdFeB magnetic material, there is great interest in being able to measure not only trace elements, but also major elements on a single sample preparation.
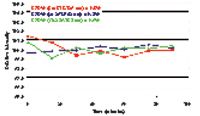
Figure 5: Stability test on Tm 313.126 nm (red), Lu 261.542 nm (blue), and Yb 289.138 nm (green) in Gd2O3 20 g/L.
High-resolution ICP-OES was evaluated for the analysis of low concentration elements in three samples, sample 4030, sample 4240 (powder), and sample 4240 (solid), as well as for the analysis of low-concentration elements along with major elements, such as Nd, Fe, and B, in samples 1 and 2.
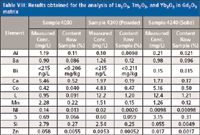
Table VIII: Results obtained for the analysis of Lu2O3, Tm2O3, and Yb2O3 in Gd2O3 matrix
The results obtained (shown in Tables VIII and IX) show the capability of the ICP-OES to determine elements from low concentration, down to the part-per-million level and up to 65% in a single run. This simplifies the sample preparation and the analysis because no further dilution is required for the analysis of major elements. This reduces the time required to prepare the samples.
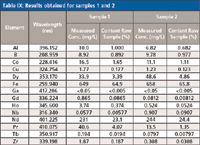
Table IX: Results obtained for samples 1 and 2
Evaluation of Accuracy and Stability
As for high-purity REE samples, the accuracy and stability are both important. Any lack of accuracy can have consequences on the quality of the magnet produced and, subsequently, on its performance. Any lack of stability may have similar effects and will be a limitation for the analysis of batches of multiple samples.
To evaluate the accuracy and the stability of the instrument, sample 4030 was spiked with four elements at concentrations consistent with their amount in the original sample, and analysis was conducted. The results obtained (shown in Table X) show excellent recoveries for all the elements, indicating the ability of high-resolution ICP-OES to provide accurate results for such samples.
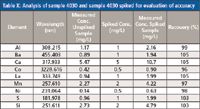
Table X: Analysis of sample 4030 and sample 4030 spiked for evaluation of accuracy
The stability was evaluated on Ba at 455.403 nm over 50 min. The stability is shown in Figure 6 as the plot of intensity versus time. The relative standard deviation obtained was excellent, with less than 1.5%, similar to what is obtained in water. The results in Figure 6 show no drift over time, meaning that it is possible to analyze multiple samples without the need for periodic recalibration.
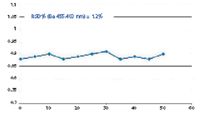
Figure 6: Stability test on Ba 455.403 nm in sample 4030.
Conclusion
The analysis of high-purity REE matrices and NdFeB magnet samples requires high accuracy and stability to ensure the performance of the finished product in an advanced technology application. As shown for the high-purity REE samples, high resolution is necessary to make it possible to analyze several elements and ensure the accuracy of the results. Without high-resolution ICP-OES, separation of the wavelength of analyte and matrices isn't always possible and will lead to a huge bias in results, or even make it impossible to perform the analysis.
The evaluation of high-resolution ICP-OES for analyzing high-purity REE matrices and NdFeB magnet matrices shows that accuracy and stability can be provided without any complicated and tedious method optimization, just by using the intrinsic performance of the instrument. The specific radially viewed mode of the instrument used for this study allowed for the analysis of trace elements down to microgram-per-liter concentrations and parts-per-million in the solid, for improved performance.
High-resolution ICP-OES for REE-based applications provides accurate, sensitive, and stable results to ensure a desirable performance for technologies using these specific elements.
Matthieu Chausseau and Alice Stankova are with Horiba Jobin Yvon in Cedex, France. Zhaofen Li is with Horiba China in Shanghai, China. Philippe Hunault and Hassanali Savadkouei are with Horiba Instruments Incorporated in Edison, New Jersey. Direct correspondence to: hassanali.savadkouei@horiba.com
References
(1) P.W.J.M. Boumans, Spectrochim. Acta 46B, 431–445 (1991).
(2) P.W.J.M. Boumans, Spectrochim. Acta 46B, 641–665 (1991).
(3) J.M. Mermet, Anal. Chim. Acta 250, 85–94 (1991).
(4) E. Poussel, J.-M. Mermet, and O. Samuel, Spectrochim. Acta 46B, 851–868 (1991).

High-Speed Laser MS for Precise, Prep-Free Environmental Particle Tracking
April 21st 2025Scientists at Oak Ridge National Laboratory have demonstrated that a fast, laser-based mass spectrometry method—LA-ICP-TOF-MS—can accurately detect and identify airborne environmental particles, including toxic metal particles like ruthenium, without the need for complex sample preparation. The work offers a breakthrough in rapid, high-resolution analysis of environmental pollutants.
Trending on Spectroscopy: The Top Content of 2024
December 30th 2024In 2024, we launched multiple content series, covered major conferences, presented two awards, and continued our monthly Analytically Speaking episodes. Below, you'll find a selection of the most popular content from Spectroscopy over the past year.