Identifying Textiles with Extended-Range NIR Spectroscopy

Both Raman and infrared spectroscopy techniques have been used to characterize textiles and fabrics for incoming inspection of raw materials, and to assess the authenticity of products produced from these materials. In the case of colorful textiles and fabrics, infrared spectroscopy is sometimes preferred to Raman to avoid the strong Raman background spectrum that can arise from the dyes found in brightly colored textiles.
Experimental Conditions
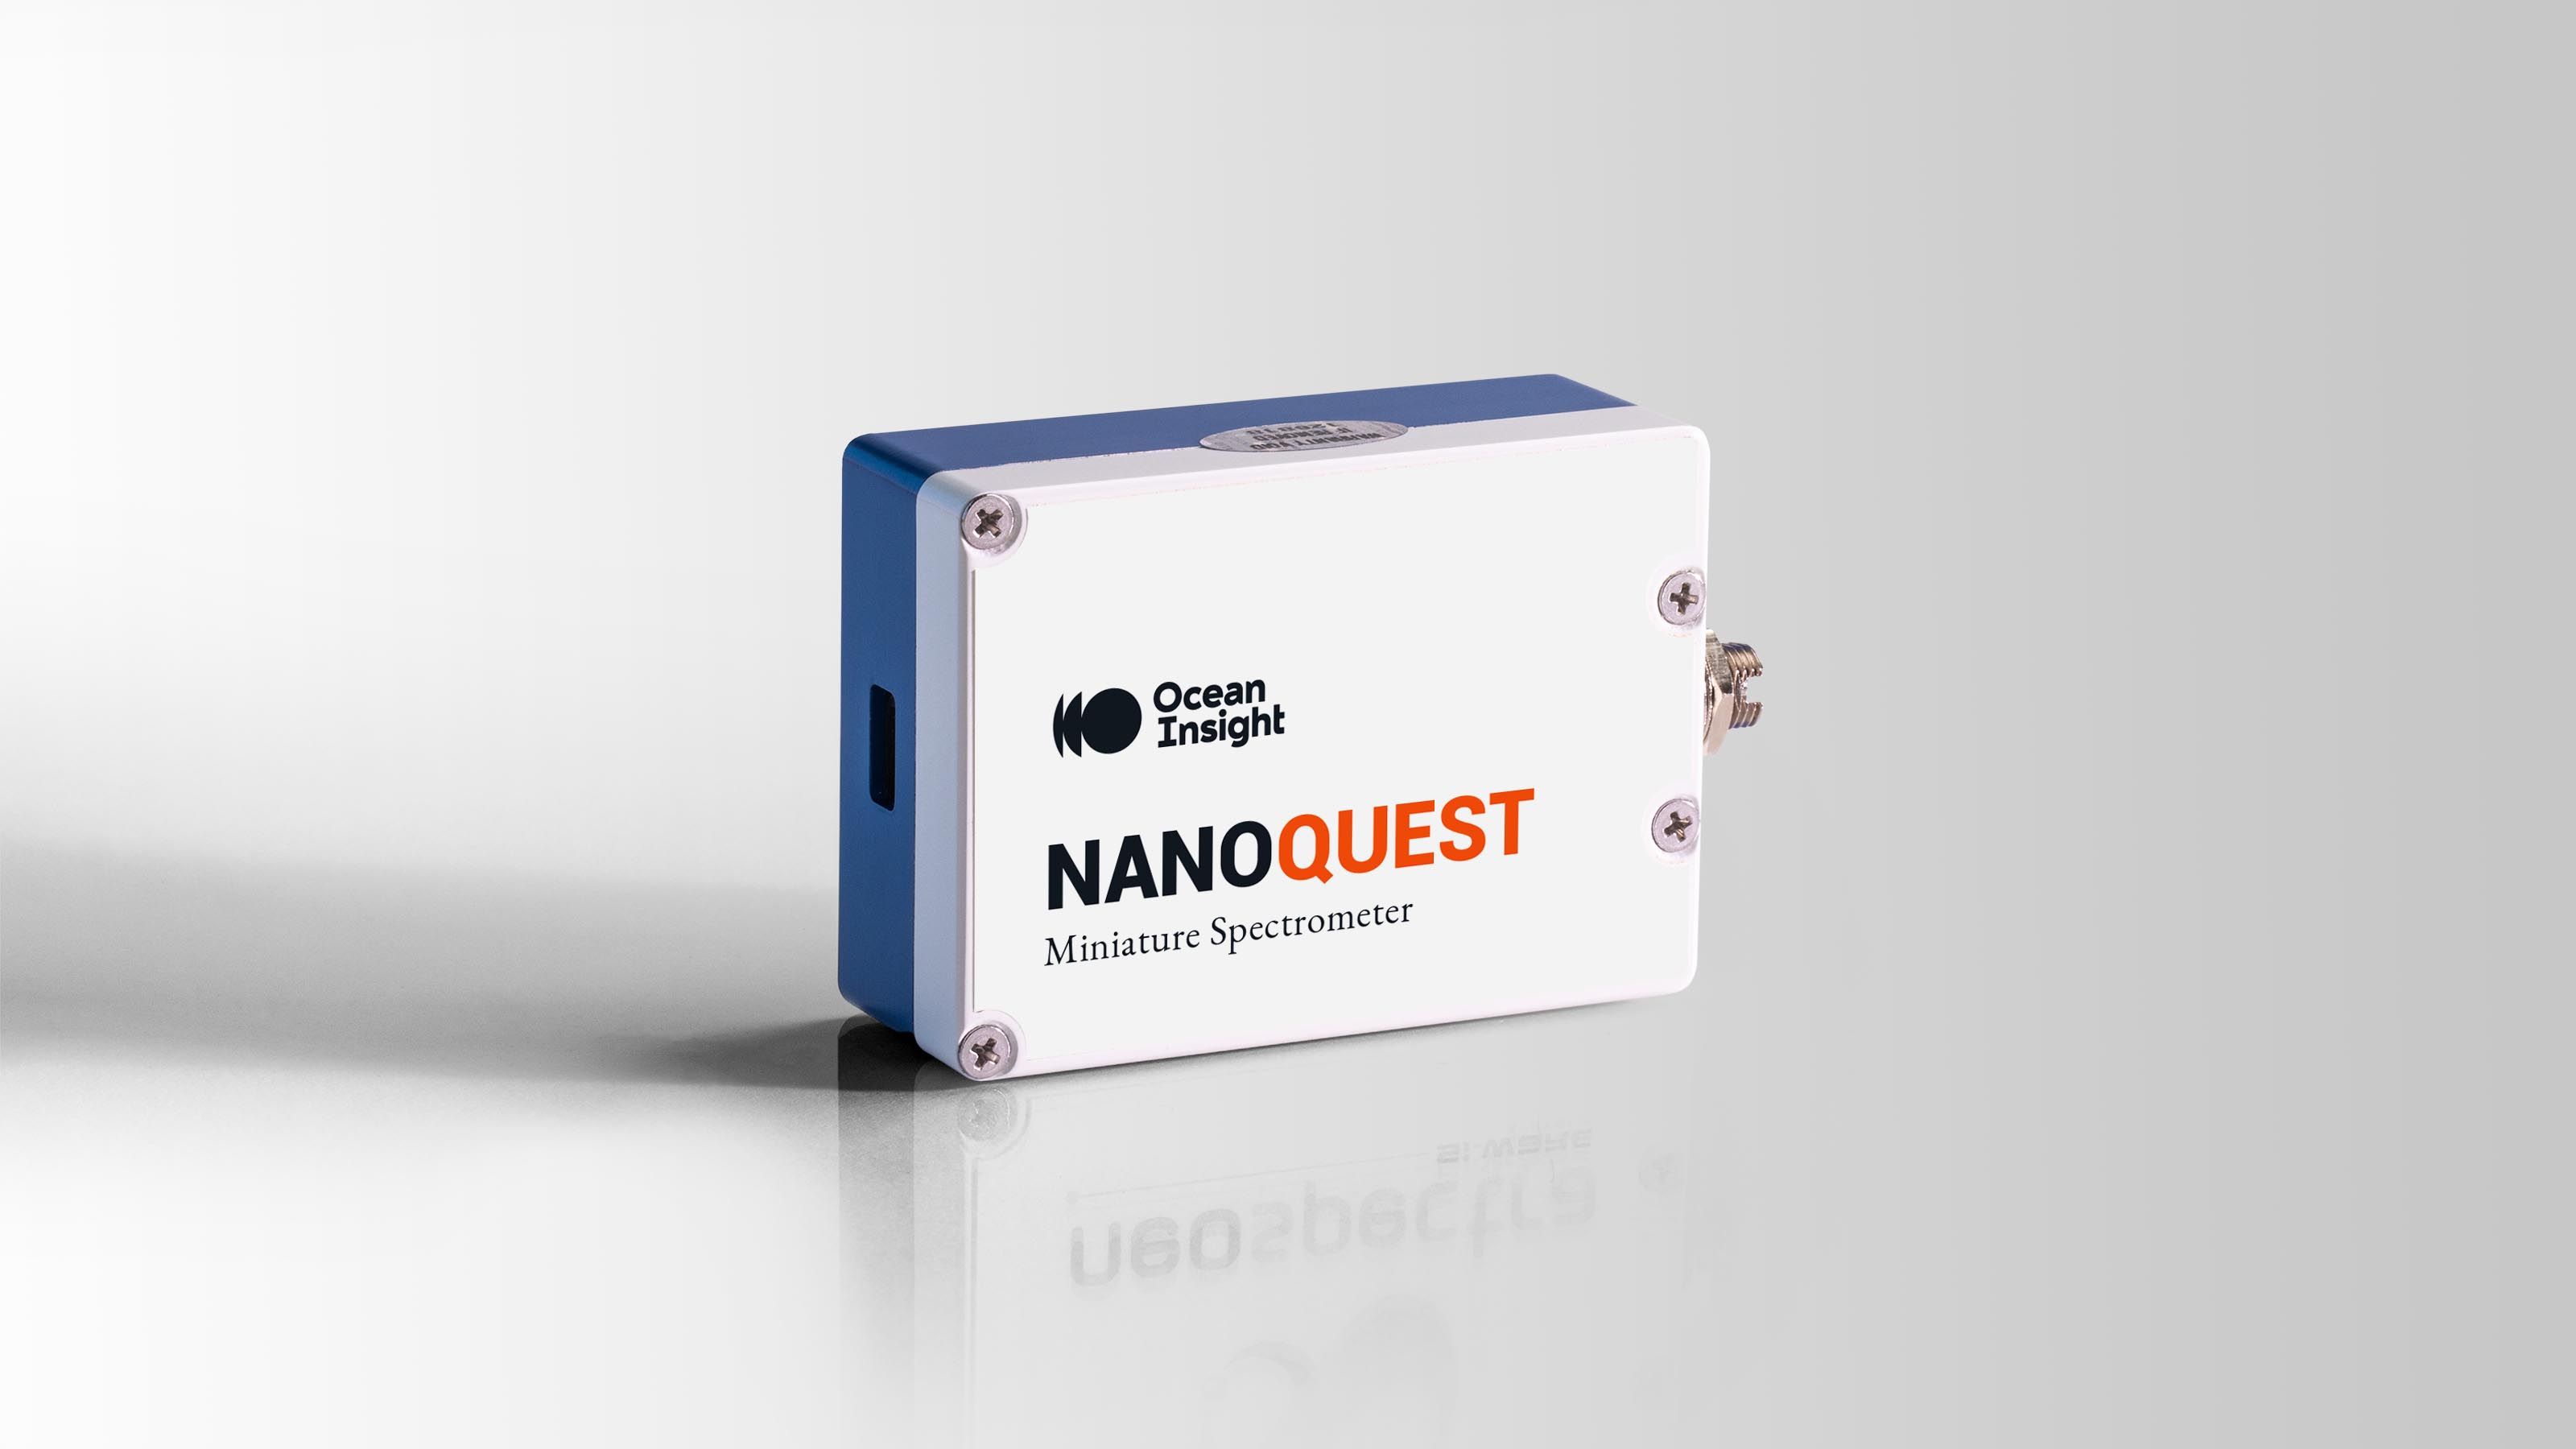
Reflectance from 100% cotton, nylon, and satin textile samples was measured across the extended near-infrared (NIR) wavelength range (1350–2500 nm) using the Ocean Insight NanoQuest spectral sensor with a high-powered tungsten halogen light source and 600 µm visible-NIR reflection probe. Measurements were made with the probe oriented at 90 degrees relative to the fabric surface using a manual optical stage. All measurements were referenced to a PTFE (Teflon) diffuse reflection standard.
NanoQuest is based on Fourier transform infrared (FT-IR) technology. Its patented micro-electro-mechanical systems (MEMS) technology allows for a continuous-wave Michelson interferometer to be created monolithically on a MEMS chip, enabling detection of all wavelengths simultaneously across the 1350–2500 nm range.
In the NanoQuest software, optical resolution was set to 8 nm (FWHM) and a custom gain setting was generated to optimize the signal-to-noise ratio for the measurement setup. Each sample was measured at five different locations with resulting spectral data pretreated by a second derivative with smoothing, and a standard normal variate (SNV) was applied. Principal component analysis (PCA) was applied to the dataset.
Results
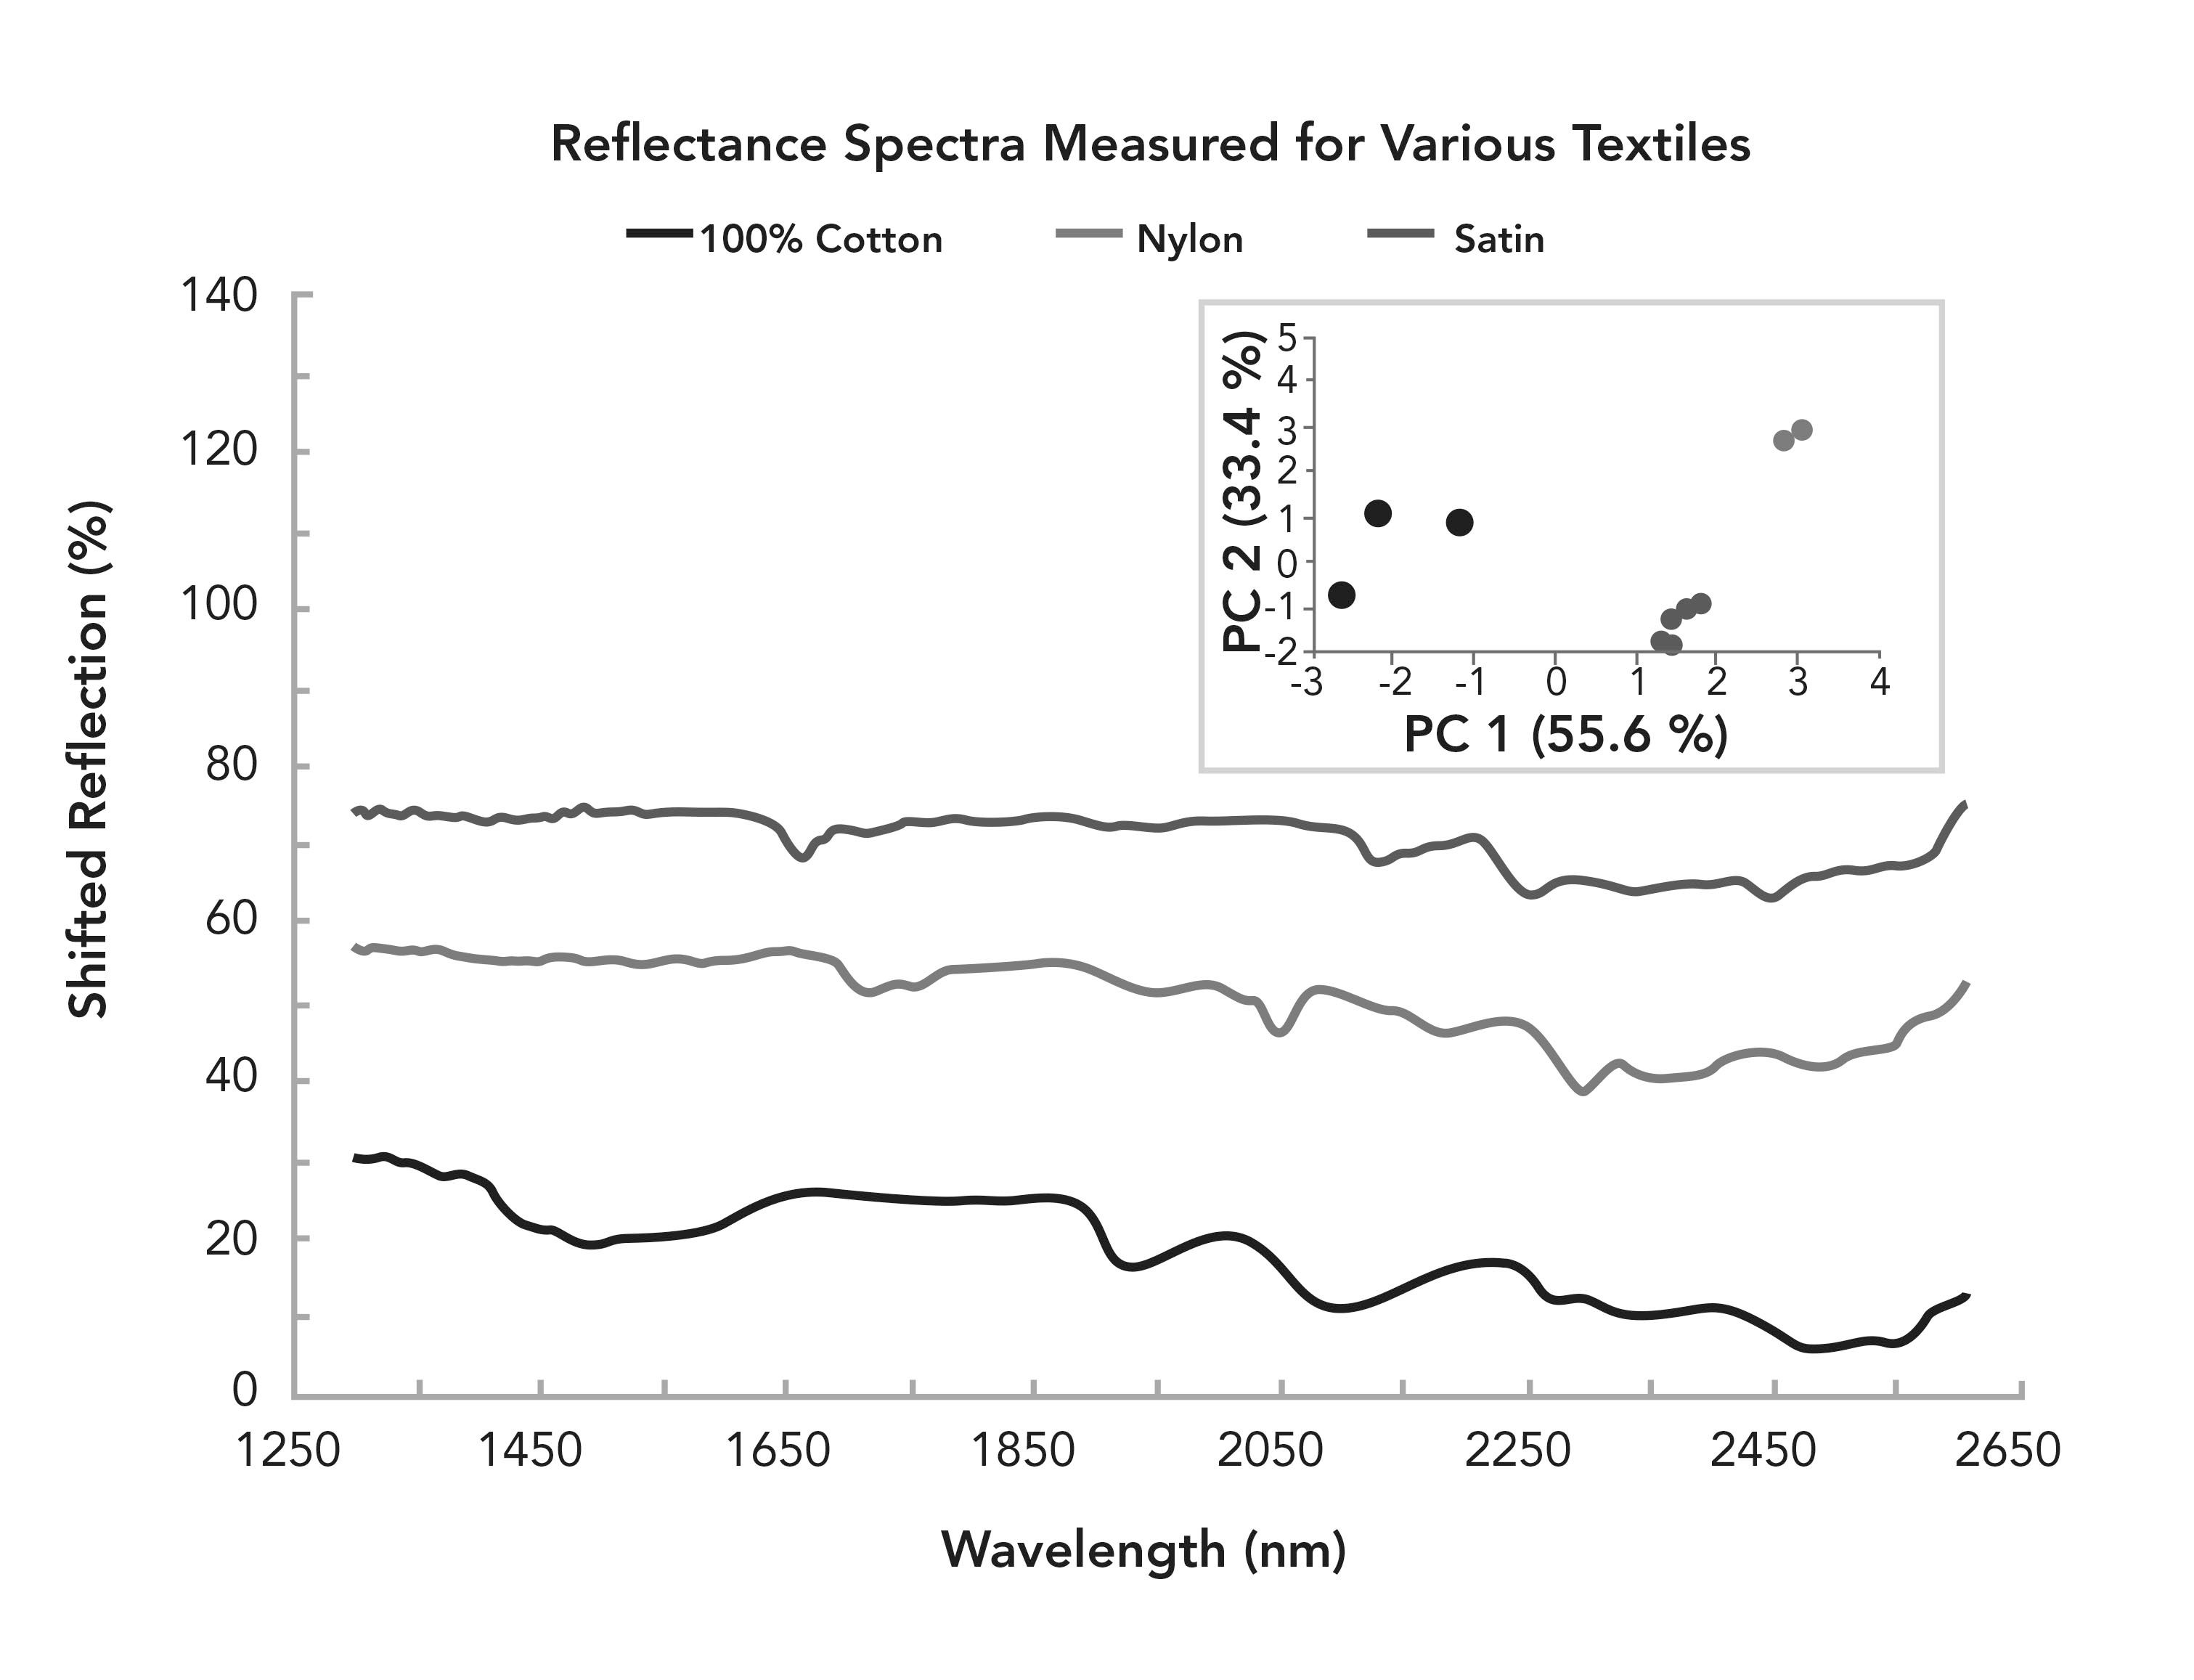
The NIR spectra measured with the NanoQuest can easily discriminate among the different textile types. Figure 1 shows the reflectance spectra of the three textiles measured: cotton, nylon, and satin. Differences in the spectral profile for each sample can be seen readily, and the inset PCA plot shows distinct separation between the clusters for each textile sample.
Figure 1: Comparison of three textile samples measured with NIR reflectance. The inset PCA scatter plot shows results after pretreatment by 2nd derivative and SNV.


Conclusion
The experiments clearly demonstrate that NIR spectra measured with the NanoQuest have unique features helpful to identify both natural and synthetic textiles. Application of PCA to the spectra further demonstrated the distinction among textile samples. Additional investigation may include testing unknown textile samples to correctly identify them.
In addition to authentication of textiles, polymers, and other materials, NanoQuest application areas include food and agriculture (soil analysis and soybean screening) and biomedical and life sciences (bodily fluids analysis).
Ocean Insight
3500 Quadrangle Blvd, Orlando, FL 32817.
Tel. +1 (727) 733-2447
Website: OceanInsight.com
