The Importance of Tight Laser Power Control When Working with Carbon Nanomaterials
A few key steps will protect your samples and help ensure accurate results.

The field of carbon nanomaterials is growing rapidly and Raman spectroscopy is gaining popularity as a characterization tool because of the wealth of information that it can provide about these materials. A few factors are important to consider before you get started characterizing carbon nanomaterials with Raman spectroscopy. One of the most important considerations is understanding the impact that excitation laser power can have on carbon nanomaterial samples. It is particularly important that you have precise control over your excitation laser power. This column installment will discuss these important factors further and will provide guidelines on how to accurately characterize carbon nanomaterials with Raman spectroscopy.
One of the most important factors to consider in characterizing carbon nanomaterials with Raman spectroscopy is the impact that excitation laser power can have on samples. The impact of laser power is twofold. First, it is important to be aware that with some materials it is possible to damage or alter the sample with the excitation laser. This damage can be very obvious in extreme cases in which the laser burns a hole in the sample, although in other cases the damage can be more subtle and if you have not taken care to avoid damaging the sample it may result in spectra that do not represent the true sample and could easily be misinterpreted. Figure 1 provides an example of one such situation with a sample of C60 fullerene. Here we can see that the C60 begins to break down into other structures, probably amorphous carbon, with as little as 0.5 mW of laser energy applied to the sample. It turns out that C60 is one of the more sensitive carbon nanomaterials, but even when dealing with more laser-tolerant materials such as carbon nanotubes, you have to exercise some caution as it is possible that surface modifications to these materials may not be as laser-tolerant as the base materials.
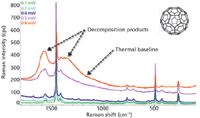
Figure 1: Effect of increasing laser power on C60 (532-nm excitation laser).
The second way that laser power can impact samples of carbon nanomaterials is by changing the temperature of the sample. The Raman spectra of many carbon nanomaterials can be very sensitive to even small temperature changes. Figures 2 and 3 provide examples of multiwall carbon nanotubes and single-wall carbon nanotubes, respectively, that demonstrate the effect that relatively small changes in laser power can have on the Raman spectra by inducing small temperature changes in the samples. Most carbon nanomaterials are black in color and will absorb significant amounts of visible light. Most of this absorbed energy will be converted to heat and this will change the temperature of the sample in the locality where the excitation laser is applied.
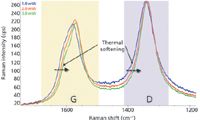
Figure 2: Effect of thermal softening with increasing laser power on multiwall carbon nanotubes (532-nm excitation laser).
In both of these examples we see significant shifts in the G-band, and in the multiwall carbon nanotube example we also see some shifting of the D-band. This is the effect of thermal softening of the planar graphene configuration of the tubes. As the temperature increases from the laser excitation the bonds become somewhat looser, which results in a lower vibrational energy and hence a shifting of the G-band to lower wavenumbers. The band shifts that we can observe here are certainly significant to any attempt to characterize the samples based on a fine interpretation of the Raman spectrum, and in some cases they may even be significant for simple quality assessments of the sort that are routinely done by comparing the ratio of the intensity of the D-band to the intensity of the G-band. In the example presented in Figure 2, the D-band/G-band intensity ratio decreases by 6% as we increase the laser power from 1 mW to 2 mW and then decreases by 3% when we further increase the laser power from 2 mW to 3 mW. This may or may not be significant to the quality assessment depending on how tight the tolerances are, but in any case it certainly magnifies the variation that is present in the measurement.
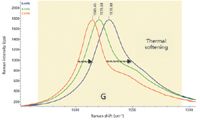
Figure 3: Effect of thermal softening with increasing laser power on single-wall carbon nanotubes (780-nm excitation laser).
There are some relatively simple solutions to controlling these effects. For starters, when beginning to characterize new materials or materials with new modifications, always start with very low laser power. If you expect to characterize a number of samples of the same material, then take a small area of one sample before you start and test it for laser tolerance by collecting spectra at different laser powers and identifying how much power can be applied before you begin to see damage in the Raman spectrum. After you understand the upper limit of laser power that your material can safely handle, then you can move forward with your measurements with confidence. In addition, precise control of laser power and an ability to fine tune the power steps are also extremely important. This has been approached in many ways including the use of neutral density or even gradient neutral density filters coupled to a laser power meter.
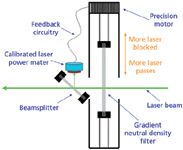
Figure 4: Principle of operation of a laser power control scheme.
After you have worked out the safe limits for your material, it is time to think about controlling any temperature effects that you observe. The approach to controlling temperature effects follows two avenues. The first, which may sound obvious, is to avoid exciting a larger area of the sample than the area over which emissions will be collected and focused on the detector. Any portion of the sample that is exposed to the excitation laser but is out of the view of the detector, is not generating Raman signal and is only generating heat at the sample. An optical design matching the laser spot size area to the detector area and an accurate alignment process ensuring the excitation laser spot is always positioned over the area of the sample that the detector sees will minimize sample heating and provide the best control of temperature effects.
Finally, with many of these samples it is necessary to operate with a very low excitation laser power. Even if the samples are not damaged by higher laser power, it is easier to control thermal effects if you reduce the amount of heat that is being generated on the sample. As you increase the laser power and hence the heat being generated at the sample, the more fluctuation in temperature and variability in the spectra due to temperature effects you will have. If you keep the laser power low and avoid generating a lot of heat, it is easier for the sample to dissipate the heat and the sample temperature will remain more stable. Because we will need to operate with low laser power and consequently low Raman emissions, it is also important to have a system that performs well under these conditions. Again, the ability to maintain a system in a well aligned state is going to be key to achieving good sensitivity under conditions of low Raman emissions.
Joe Hodkiewicz is a marketing operations manager at Thermo Fisher Scientific in Waltham, Massachusetts.

Joe Hodkiewicz

New Deep Learning AI Tool Decodes Minerals with Raman Spectroscopy
May 21st 2025Researchers have developed a powerful deep learning model that automates the identification of minerals using Raman spectroscopy, offering faster, more accurate results even in complex geological samples. By integrating attention mechanisms and explainable AI tools, the system boosts trust and performance in field-based mineral analysis.
Nanometer-Scale Studies Using Tip Enhanced Raman Spectroscopy
February 8th 2013Volker Deckert, the winner of the 2013 Charles Mann Award, is advancing the use of tip enhanced Raman spectroscopy (TERS) to push the lateral resolution of vibrational spectroscopy well below the Abbe limit, to achieve single-molecule sensitivity. Because the tip can be moved with sub-nanometer precision, structural information with unmatched spatial resolution can be achieved without the need of specific labels.
The Rise of Smart Skin Using AI-Powered SERS Wearable Sensors for Real-Time Health Monitoring
May 5th 2025A new comprehensive review explores how wearable plasmonic sensors using surface-enhanced Raman spectroscopy (SERS) are changing the landscape for non-invasive health monitoring. By combining nanotechnology, AI, and real-time spectroscopy analysis to detect critical biomarkers in human sweat, this integration of nanomaterials, flexible electronics, and AI is changing how we monitor health and disease in real-time.

.png&w=3840&q=75)

.png&w=3840&q=75)


.png&w=3840&q=75)


.png&w=3840&q=75)


