Ion Manipulation by Digital Waveform Technology
Special Issues
Digital waveform technology is emerging as a powerful tool in mass spectrometry (MS). Digital quadrupoles rely on precise control of frequency rather than voltage, which allows these devices to access a greatly extended mass range
Digital waveform technology is emerging as a powerful tool in mass spectrometry (MS). Digital quadrupoles rely on precise control of frequency rather than voltage, which allows these devices to access a greatly extended mass range. A more subtle but equally powerful aspect of digital systems is their ability to precisely control and rapidly switch waveform duty cycle. This additional parameter may seem less important than frequency or voltage, but it enables or simplifies many MS techniques. In short, digital waveform technology is poised to radically alter our ability to explore complex biological systems. Recent advances in the theory and application of this technology are discussed.
Mass spectrometry (MS) is a standard detection method for liquid chromatography (LC) and gas chromatography (GC) separations. Mass spectrometers, which sort ionized analytes by their mass-to-charge ratio (m/z), are indispensable tools in almost every analytical laboratory. Collecting mass spectra can be achieved by many techniques, but most atmospheric sampling mass spectrometers today rely on the quadrupole ion guide to collect, select, and transfer ions (1). Since their commercial introduction in the early 1960s, quadrupoles have been operated using sinusoidal potentials. In the past decade, a handful of research groups have explored the use of digitally produced rectangular waveforms to drive these devices (2–6).
The theory underpinning digitally driven quadrupoles was developed in the 1950s (7) and was first applied to mass spectrometry in the 1970s (8). The technological developments required to allow digital quadrupoles to match the performance of sinusoidal devices matured in the 1990s. These advances include direct digital synthesis (DDS), high-voltage metal oxide field effect transistors (MOSFETs)-based pulsers, and field programmable gate arrays (FPGAs). They provide the frequency precision and agility to create the high-voltage waveforms required to drive digital guides and traps and enable their unique capabilities. This article outlines the operation, demonstrates the utility, and predicts future applications of these digital devices.
Overview and Waveform Basics
Comparison of Digital and Sinusoidal Waveform Driven Devices
Sinusoidal quadrupoles are driven by resonantly tuned circuits that operate at a fixed frequency. The applied voltage is varied to affect the stability of the ions in the device. The m/z values are proportional to the voltage, which inherently limits the maximum accessible mass. In contrast, digital quadrupoles are driven by fixed voltage rectangular waveforms and the frequency is varied to affect the stability of the ions. In digital devices, m/z is inversely proportional to the square of the frequency. These devices have no inherent mass limit. Both types may also apply a DC offset between the electrodes to narrow the range of stable m/z or superimpose dipolar waveforms to achieve resonant excitation for ejection, isolation, or collision-induced dissociation (CID) (9).
The ability to manipulate the waveform duty cycle of the applied waveforms is unique to digital waveform–driven devices. The purpose of this article is to expose some of the new capabilities of digital quadrupole devices. To do so, the terms used to describe the applied digital waveforms need to be defined.
Defining Digital Waveforms
Figure 1a depicts in blue and red, respectively, the two two-state driving waveforms applied to the rod electrodes on the x- and y-axes of a linear quadrupole. Both waveforms have the same period, T, but may have different duty cycles. The duty cycle, tn/T, is the fraction of the waveform during which the "high" potential (V+) is applied. From an ion's perspective, the voltage levels relative to ground potential do not matter; their motion is defined by the potential difference between the electrodes illustrated in Figure 1a. This difference, depicted in Figure 1b, creates a three-state waveform. The first quadrupolar interval, when Vx > Vy, is defined by t1 while the second quadrupolar interval, when Vx < Vy, is described by t. The portion of the waveform when no quadrupolar field is present is defined by t2 because all electrodes are at the same high or low potential (Vx = Vy). During the t2 portion of the waveform cycle, a potential may exist between the rods and the end-cap electrodes, allowing ions to be axially trapped or ejected. Because all four rods have the same potential, the ions are not radially confined during t2/T. For this reason, radial and axial trapping trade off during the waveform period. Surprisingly, radial trapping is not altered appreciably at the small values of t2 that are typically applied. For example, to change radial pseudopotential well experienced by an ion at a given frequency by 5%, t2/T must be larger than 0.15. This simplifies instrumentation by permitting any linear quadrupole to be operated as an ion trap with tunable axial well depth without substantially changing the driving potentials or switching end-cap voltages to gate ions.
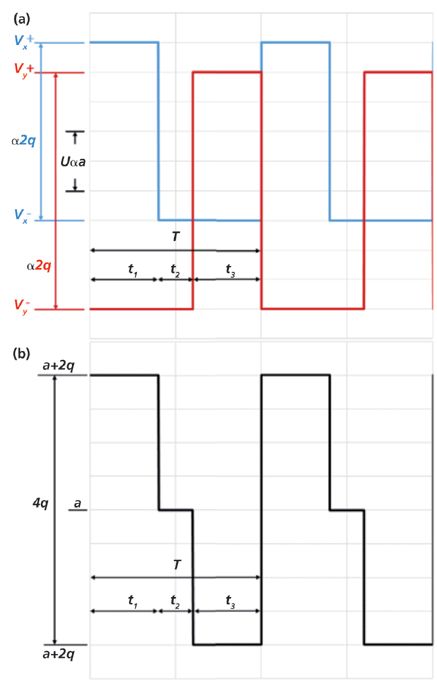
Figure 1: (a) The rectangular waveforms applied to linear quadrupoles are defined in terms of the Mathieu parameters a and q and the three periods of constant potential, t1, t2, and t3. (b) Depiction of the potential difference between the x- and y-electrodes as required by the matrix method for solving the Hill equation. The simplifying assumptions Vx- = Vy- and Vx+ = Vy+ are applied. Shorthand notation for the wave depicted is 40/-20/40.
To aid discussion, it is handy to have a simple and unambiguous means to describe the three state waveforms like the one presented in Figure 1b. The t1, ±t2, and t3 convention is used throughout this manuscript, where each segment is expressed as a percentage of the waveform cycle and where the sign on t2 indicates whether V+ or V- is applied to all electrodes. For instance, the axial trapping waveforms in Figure 1 may be expressed as 40/-20/40. The corresponding ejection waveform would then be 40/+20/40.
Modulating the driving waveforms changes the stability and motion of the ions in guides or traps. Qualitatively, the axial trapping or ejection potential increases with increasing t2 and the range of radially stable m/z narrows as the t1/t3 ratio deviates from 1. The quantitative effects may be found by solving the Hill equation, (3,7,8,10,11), which describes ion motion in any periodically oscillating electric field.
Influence of Duty Cycle on Stability Diagrams
The q, a stability diagram, for a particular driving waveform, defines the region of (q, a) space where the ions are stable in the quadrupolar device. Each diagram is composed of two regions (blue and yellow), which describe ion stability along orthogonal axes. Figure 2 includes stability diagrams for a linear quadrupole. Stable motion along the radial x-axis is shaded in blue and stable motion along the radial y-axis is shaded in yellow. The region of overlap where ions exhibit stable motion in both directions is shaded in green. The equivalent orthogonal axes in a three-dimensional (3D) device (not pictured) are r and z. These diagrams are traditionally presented in terms of the dimensionless Mathieu parameters a and q, which are related to the DC and AC voltages, respectively. Two stability diagrams in (q, a) space for the 50/0/50 and 55/10/35 duty cycle waveforms are pictured in Figures 2a and 2b.
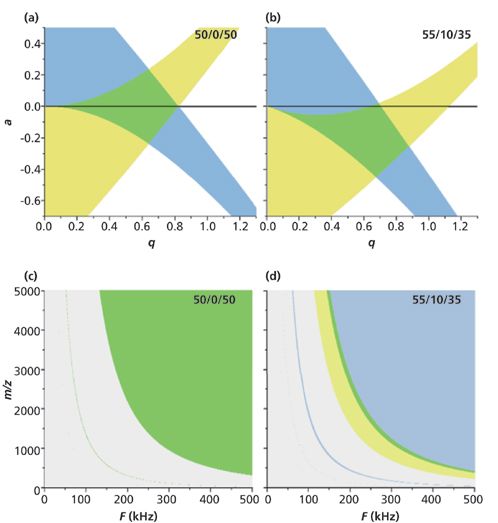
Figure 2: (a, b) Traditional (a, q) stability diagrams for two different applied waveforms. Stable motion in the guide's x-dimension is represented by blue shading and the y-dimension by yellow. Green shading represents the stability region where ions experience stable periodic motion on both x and y. (c, d) The same stability diagrams in the frequency and mass-to-charge domains. They reflect ion stability in one instrument in our laboratory, an unstretched linear ion guide with r0 = 5.5375 mm driven with Vx+ = Vy+ = 200.0 V and Vx- =Vy- = -200.0 V.
For an unstretched linear quadrupole the expressions for a and q are given in equations 1 and 2 (12):

where e is the charge of an electron, m is the ion mass, ro is the quadrupole radius, and Ω is the radial driving frequency expressed in radians per second. The DC offset between the rods, U, and the peak-to-peak amplitude, V, are defined by equations 3 and 4:

Several techniques have been proposed to generate stability diagrams that account for the time-averaged DC potential between the electrodes (5,13). The diagrams in Figure 4 were calculated using the matrix method to analytically solve the Hill equation (3,7,11). Unlike the time-averaged approaches, the matrix method yields a result based on the instantaneous potential during each constant-voltage interval. Any permanent DC offset is explicitly accounted for by the definition of U, but any change in the DC level resulting from the waveform duty cycle is accounted for implicitly in the matrix operation.
Stability diagrams in (q, a) space are true for all ions under all instrumental parameters, but are not very intuitive to navigate. In the laboratory, experiments are designed based on the mass-to-charge ratio of the ions of interest and driving frequencies of the device; plotting the stability diagram on these axes makes it more user-friendly. A stability diagram in F, m/z space may be generated by inputting instrumental parameters (like quadrupole radius and the zero-to-peak AC voltage) and fixing the value of a/q. The value of a is generally set to zero because it is instrumentally and computationally easier to operate quadrupoles without a permanent DC offset (that is, when Vx- = Vy- and Vx+ = Vy+). Moreover, this can be done without sacrificing any capabilities. Figures 2c and 2d are two such diagrams, pictured below their corresponding (q, a) diagrams. The range of stable masses at a given frequency is immediately obvious as are the stable frequencies for the m/z species of interest.
Both types of stability diagram shift in predictable ways when the duty cycle is changed. Increasing t2 causes the stable zone of the (q, a) stability diagram to stretch along the q axis while maintaining nearly constant values of a (11). As a result, the (F, m/z) diagram predicts the low frequency cutoff for a given value of m/z decreases with increasing t2. The effect of t2 on axial ion stability is not illustrated by either diagram. Changing the value of t1/t3 causes the stable zone of the (q, a) stability diagram to twist about the origin. The (F, m/z) diagram, which is generated at a/q = 0, exhibits a changing band of stable masses. When t1/t3 = 1, only a low mass cutoff is present; as this ratio diverges from a value of one, a high mass cutoff is introduced. As the divergence increases, the stable band narrows until no ions are stable on either radial axis. This occurs when t1/t3 or t3/t1 = 1.578. Figure 2d illustrates the narrow mass band generated by a waveform with t1/t3 = 1.571. Spreadsheets (MS Excel) to generate stability diagrams like those in Figure 2 for both two-dimensional (2D) and 3D quadrupoles have been generated in our laboratory (11). These programs are available for free on our group website: reilly.chem.wsu.edu/digital-waveform-stability-diagrams-2/.
Instrumentation
The high-voltage waveforms used to drive the device begin as low-voltage pulse trains. Our laboratory uses a waveform generator comprising a field programmable gate array (FPGA) board and a function generator to generate the low-voltage rectangular waveforms (National Instruments Inc.). NI LabView serves as a graphic user interface for the low-voltage waveform generation system and for managing data acquisition. This system can generate a programmed sequence of more than 58,000 unique waveforms with sub-μHz frequency resolution and ~1 ppm duty cycle precision. Agilely switching both parameters is crucial to unlocking the unique abilities of digital quadrupoles. Temporal jitter, a limiting factor in the mass resolving power of frequency-based digital systems, is currently about 100 ps RMS. For each pair of rod electrodes, a high-voltage pulser (IXYS Corp.) amplifies the low-voltage waveforms by synchronously switching between the positive and negative voltage levels provided by two DC power supplies. Because digital waveform technology may generate a time-averaged DC potential between the rod pairs, there is no need to implement a fixed DC potential; the two power supplies can be used to create the high-voltage waveforms for all four rods. Diagonal wire electrodes were placed between the rods along the asymptotes of the quadrupolar field to provide a small field along the z-axis that keeps ions moving toward the exit of the device.
Abilities
Axial Control
Digital waveform technology allows precise control of ion motion in both the axial and radial directions. Axial control comes from t2, the period in the waveform when all electrodes have the same potential. During this time, a potential may be created between the rods and the end-cap electrodes. The time-averaged axial potential that results from nonzero values of t2 is illustrated in Figure 3. This potential relative to ground is V± × t2/T.
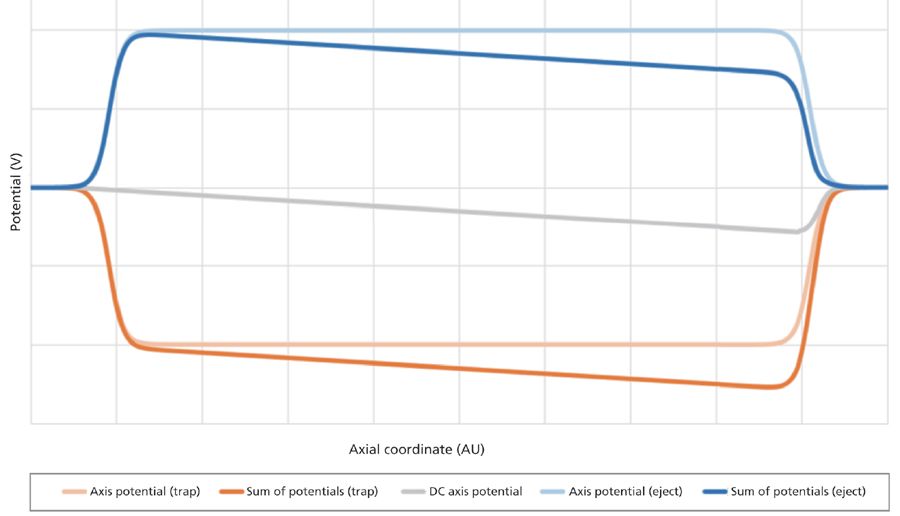
Figure 3: Qualitative description of axial potential in a linear quadrupole. Auxiliary electrodes generate fixed axial gradient (gray) while waveform duty cycle generates variable axis potentials (light blue = ejecting, light orange = trapping). Ions are guided to exit at the end of the quadrupole and may be trapped (orange) or ejected on demand (blue) by the summed potentials.
Ion Trapping
If the time-averaged potential of the rods is lower than the end-cap potential, ions remain axially trapped (light orange trace in Figure 3). If it is higher, the ions near the ends of the quad are ejected (light blue trace in Figure 3). Ions in the middle of the linear quadrupole "feel" no effect when there is a potential difference between the rods and the end-cap electrodes because the axial fields do not penetrate very far into the device. Without auxiliary electrodes, the axial potential gradient along the quadrupole axis is zero. Before they are ejected, ions must diffuse to the ends of the device, a process which may take minutes or hours for biomolecules. On the time scale of mass spectrometers, these ions are essentially lost. Segmented rods, cusp electrodes, or diagonal guide wires resolve this problem by generating a small axial field (14) (gray trace, Figure 3) to gently move ions toward the exit. In trapping mode with the application of an axial field, the ions trap at the point where the axial forces balance. This occurs at the summed potential minimum (orange trace, Figure 3). The exact location of the trapped ion packet and its physical dimensions are determined by the value of t2/T, the end-cap potential, q, and the auxiliary applied axial potential. This control makes axial trapping and ejection easily tunable.
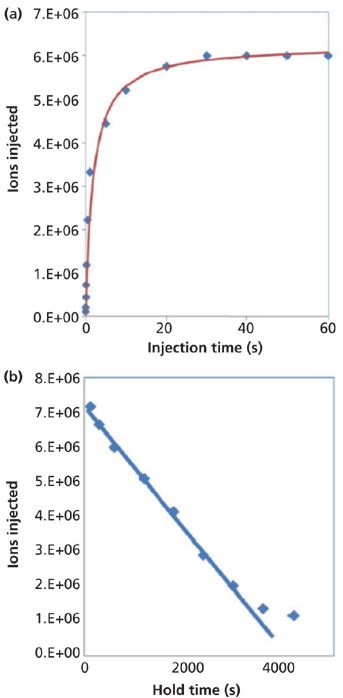
Figure 4: (a) BSA+ population in .0055 m r0 linear quadrupole as a function of fill time. (b) BSA+ population following saturation as a function of holding time. Adapted with permission from reference 15.
A digital linear ion guide has been used in our laboratory to trap and hold millions of ions for extended periods, from small molecules to singly charged 3 gigadalton (GDa) particles (15). In Figure 4, singly charged BSA (m/z = 66 kDa) ions were confined axially by the time-averaged DC potential between the end cap and rod electrodes generated by a 40/-20/40 waveform. The depth of this frequency-independent axial well is defined by the duty cycle of the driving waveform and is expressed in equation 5:

Ions introduced to the linear quadrupole are axially confined by this potential. As the ion population increases, charge-charge repulsion increases and reduces trapping efficiency. Eventually the ion volume is saturated with charges, and a maximum steady-state population is reached when the rate of ions entering the device equals the rate that they "leak" out. Figure 4a illustrates the saturation process.
In another experiment, ion introduction was stopped after saturation and the ion packet was held in the trap. After various holding times, the ion packet was ejected and measured using a Faraday plate. Figure 4b illustrates ion leakage at saturation in our system over the course of 1 h. It shows that the ion loss rate decreases as ion population (space charge) decreases. There were 1 × 10⁶ ions still trapped after 4000 s in the trap. Our experiments indicate that even large ions may be held or collected over an extended time (hours) without significant ion loss. The longest tandem MS applications require trapping on the second timescale where ion leakage is not appreciable. The ability to trap ions for an extended time is also applicable to trace analysis by allowing the accumulation of low abundance ions for milliseconds or even minutes, until enough are available for analysis. When this approach is combined with mass filtering or isolation (discussed below), it should be possible to primarily collect the ion of interest while avoiding space charge effects to enable trace analysis.
The ability to axially trap ions in the linear ion guides provides several benefits. Currently, on the order of 1% of the continuously generated ion beam that passes through the quadrupole ion guide system and into the pusher region of time-of-flight (TOF) analyzers is actually sampled into the flight tube for mass analysis. The vast majority of the steady stream of ions entering the pusher is wasted. Collecting and holding ions until the mass analyzer is ready can increase the instrument duty cycle to nearly 100%. This approach is especially useful for low abundance species because it increases sensitivity by two orders of magnitude just by concentrating the ions before analysis.
Trapping the ions and holding them at a single fixed point also presents the opportunity to subject ions to gas-phase chemistry. Gas-phase hydrogen-deuterium exchange is an obvious application (16). The trapped ion packet in the quadrupole may also be subjected to various optical spectroscopic techniques (17,18). Similar work has been carried out in a 3D sinusoidal ion trap (SIT), but the larger ion volume makes linear ion guides more appealing for this application (19).
Another application not yet fully explored is electron-capture dissociation (ECD). Ding and Brancia (20) recently demonstrated ECD in a digital 3D ion trap without the use of an axial magnetic field. This tandem MS technique yields unique protein fragmentation and relies on very low energy electrons disrupting the peptide backbone. ECD has been demonstrated in sinusoidal rf quadrupole devices, but it requires the application of an external magnetic field to keep electrons (which are far below the low-mass cutoff) from detrapping and to prevent electron energy from exceeding the ~1 eV required for ECD (21,22).
In contrast, no magnetic field is required in a digital ion trap. The well-defined and constant (on the microsecond scale) potentials used mean "electron energy is well-defined for each point along the trajectory so that [injected electrons] reach the minimum of the potential well at the center of the ion trap with the correct kinetic energy" (20). Ding and Brancia took advantage of this property of the digital ion trap to fragment several peptides, including substance P (Figure 5). The ring electrode is operated at 500 V0-p, resulting in a potential at the center of the trap of -250 V when the applied potential is low. After multiply charged peptide ions were trapped, electrons were repeatedly injected through the end cap with 250 eV of kinetic energy. When the electrons reached the center of the trap and changed direction, they had ~1 eV of kinetic energy, a typical value for ECD experiments. The efficiency of precursor-to-product conversion for several peptides was reported to be ~5.5%.
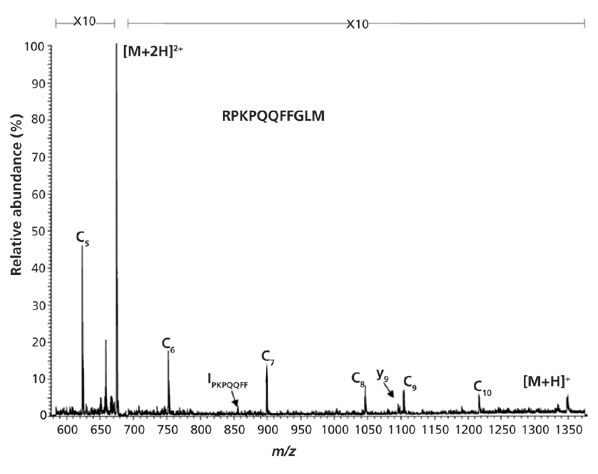
Figure 5: ECD spectrum of [M + 2H]2+ substance P acquired after accumulation of 250 scans in DIT. An ECD interaction period of 416 ms was used in the experiment. Adapted with permission from reference 20.
ECD has not yet been demonstrated in a digital linear quadrupole, but the operation would be analogous to the 3D ion trap work described above because the ions are also trapped in a small volume with the application of an axial field. ECD has emerged as an important technique in top-down proteomics, but it is normally performed in an ion cyclotron resonance (ICR) cell. The relatively low cost, extended m/z range, large ion volume, and high transfer efficiency of digital quadrupoles make them a tantalizing area for further research.
Ion Ejection
After ions are collected at the end of the quadrupole, they may be ejected on demand simply by changing the waveform duty cycle. The DC potential between the quadrupole axis and end cap defines each ions kinetic energy as it leaves the device. The kinetic energy of ions leaving the device is defined by equation 6:

The waveform may be rapidly switched from trapping to ejection to replace other gating techniques. Duty cycle-based ejection has the important benefit of collimating ions as they leave the device. SIMION modeling performed by our group indicated that the dispersion of ions decreases with increasing t2/T. This effect has the potential to increase the sensitivity of mass analyzers. Off-axis ion motion negatively impacts the resolving power of time-of-flight and orbital ion trap systems. To maintain high resolution, current systems pass ions through spatial filters, which physically intercept off-axis strays; these ions represent a significant fraction of the total ion population. In contrast, a well-collimated ion beam obviates the need for spatial filters and increases the number of ions that reach the detector or are coherently injected into a trap while maintaining high resolving power.
Modeling in SIMION shows that ions ejected from linear quadrupoles in this way exhibit very little off-axis motion when axially ejected even at low kinetic energy (23). This is a marked contrast to sinusoidal devices, which show significant dispersion from the central axis. Figure 6a shows ion trapping and subsequent ion ejection with a 50% duty cycle with 1.78 eV of kinetic energy. It is essentially the equivalent of sinusoidal trapping with the same ejection energy. Figure 6b reveals the same trapping process followed by duty cycle base ejection with a 40/20/40 ejection with a 1.72 eV ejection kinetic energy. This unique ability to maintain ion packet collimation even at low ejection kinetic energy has implications for downstream mass analysis. It increases sensitivity by increasing the number of ions that reach their destination and also increases the resolving power of orthogonal-acceleration TOF mass analyzers by minimizing the radial spatial and velocity components of the ion packet as it is injected into the pusher. This is one of the primary reasons that our group obtained a resolving power of 8000 up to m/z 200,000 and beyond (24,25).
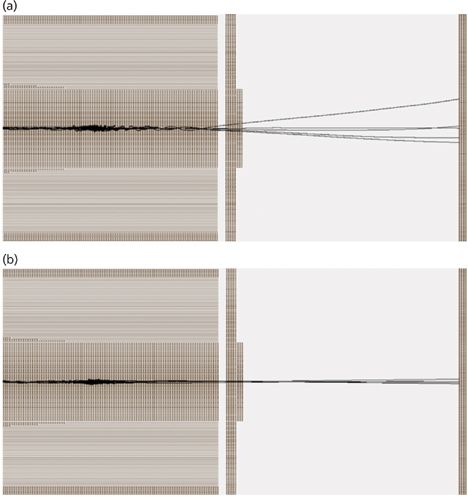
Figure 6: Direct comparison of axial ejection with (a) 50/0/50 duty cycle and (b) 40/20/40. Ions in both cases have similar kinetic energy but those in (a) exhibit 24° dispersion while those in (b) exhibit only 2° dispersion. Adapted with permission from reference 23.
The ability to axially eject ions as collimated packets with well-defined kinetic energy has numerous applications including MS-MS in a collision cell (6). The extent of collision induced dissociation may be tuned by varying the waveform duty cycle used to eject the ions. The kinetic energy of the ejected ions may be varied continuously from a fraction of an electronvolt to z × V+.
Drift time or kinetic energy (KE) loss may be measured as ions pass through the cell to find the collision cross section (CCS) (26,27). CCS is a measure of an ion's physical size and has given critical insight into the gas-phase structure of ions from explosives to intact viral capsids (28,29). CCS separation may be performed at elevated pressure before ions are introduced to the mass spectrometer (30,31), but most ion mobility experiments occur at Torr pressures in mass spectrometers equipped with traveling wave or collision cells (32). The speed of mobility separation depends on the instrumentation used, but milliseconds are required to separate ions within the working range of most commercial mass spectrometers (m/z < 10,000). Separating truly large ions (29) may take hundreds of milliseconds.
If ions are ejected into a collision cell filled with buffer gas, their transit time or kinetic energy upon exiting the cell may be measured and used to calculate each species' CCS. The resolving power of collision cell ion mobility is limited by the initial spatial and energy distribution of ions. Digital waveform technology allows precise control of the kinetic energy of ejected ions, but limiting spatial spread is crucial. SIMION modeling performed by our group (7) indicates that ions are trapped as a tight packet, but their starting position within the quadrupole, which may be selected by biasing the exit end cap, determines their ultimate distribution. Figure 7 illustrates this effect by comparing the trajectories of native CCS IgM+ ions (MW = 970 kDa) trapped at the point where dV/dz is maximized (Figure 7a) and with those ions trapped at the point where V is maximized (Figure 7b). Despite having only half the kinetic energy of those in (Figure 7b), the ions in (Figure 7a) arrive at the detector 45% faster and remain in a tight packet because they have no time to diffuse at the top of the potential curve (Figure 7c).
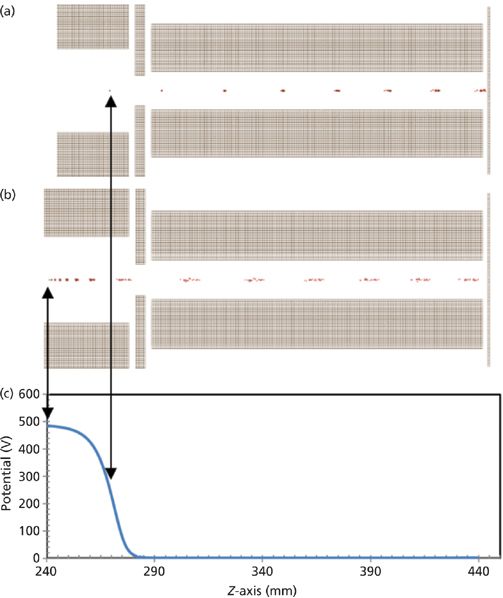
Figure 7: The position dependence of the quadrupole axis potential during ejection with a 0/100/0 duty cycle. The two different trapping and ejection points are shown and the corresponding time lapse diagrams are above. Ejection at a greater voltage gradient reduced axial spread and increased temporal resolution.
Ions ejected in this way are expected to exhibit rapid mobility separation. The simulated baseline resolution of 2000 native CCS IgM+ and 110% native CCS IgM+ in a 160-mm-long quadrupole containing 7.5 mTorr N2 buffer gas is presented in Figure 8. The simulated resolving power of this technique is ~90 (tD/ΔtD, full width half maximum [FWHM]), which is in line with typically observed values for traveling wave and drift tube mobility separations. The separation modeled here occurs on a much shorter timescale (<1 ms) than either traveling wave or drift tube ion mobility spectrometry (IMS), both of which require milliseconds to separate even low m/z ions. After this technique is implemented, it will allow the acquisition of CCS and MS data rapidly enough to keep up with liquid chromatographic separation of proteins.
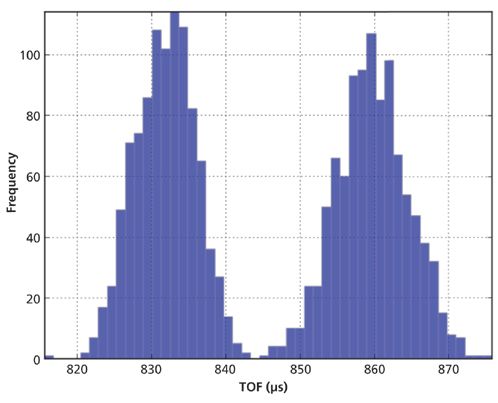
Figure 8: The simulated baseline resolution of 2000 native CCS IgM+ and 110% native CCS IgM+ in a 160-mm-long linear ion guide.
Radial Control
Radial control comes from the adjustment of the t1/t3 ratio. These waveform parameters define the quadrupolar field in the device. If the two intervals are equal in duration, the device exhibits a low mass cut-off only. As the ratio of t1/t3 deviates from a value of one, the time-averaged DC potential between the electrodes increases, and the "window" of stable masses narrows and shifts. By systematically varying the duty cycle, these stable mass windows may be manipulated to select a single ion species or a band of m/z values to remain in the device. The ability to facilely manipulate the boundaries of the stable region around the parent ion also enables several unique methods of MSn in linear quadrupoles.
Ion Isolation
Digital waveform technology permits precise manipulation of radial ion motion in the quadrupole. The ability to introduce a DC potential between the rod sets of a linear quadrupole allows the quad to act as a mass filter. The ability to quickly and accurately modulate this time-averaged DC in a digital quadrupole allows precise control of radial stability and opens up a wide array of functions without sinusoidal ion trap analogs.
The most straightforward application of this time-averaged potential is ion selection and was first demonstrated by Richards and colleagues (8). Later, Brancia and Ding (13) collected cytochrome c ions generated by electrospray ionization in a segmented digital linear ion guide and then gated them into a 3D digital ion trap for mass analysis by resonant ejection. A DC bias between the segments was used to axially trap the ions (t2 = 0). The duty cycle of the driving waveform was varied to perform digital asymmetric waveform isolation (DAWI). By increasing the ratio of t1/t3 to 1.506, the time-averaged DC between the rod pairs narrowed the stable mass band to pass only the 13+ charge state. The effect of increasing time-averaged DC was clearly shown in this publication (13). Ion isolation is a technical challenge because the precision of a digital mass filter depends on the ability to fine tune the duty cycle of the driving waveforms. Narrowing the stable band by only 1 Da under the conditions used requires 200 ppm duty cycle control.
Another method of ion isolation is possible if the frequency and duty cycle of digital waveforms may be changed on the fly. Instead of operating with a fixed waveform, the frequency may be rapidly switched to eliminate high- then low-mass ions (6). The procedure for the isolation of reserpine ([M+H]+ = 609 Da) is illustrated on the m/z, F stability diagram in Figure 9. The waveform duty cycle is set to generate a wide stable mass window to capture the ions. The frequency is then adjusted to F1 where the desired ion species is near the low mass boundary. The frequency is then switched to F2 where the desired species is near the high mass boundary. Only ions that are stable at both F1 and F2 remain in the ion guide. Though superficially equivalent to DAWI, this technique has three notable advantages:
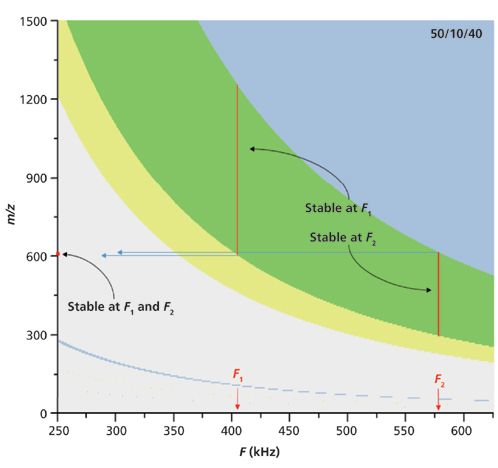
Figure 9: A m/z, F stability diagram illustrating ion isolation by frequency hopping. After ions are trapped, the driving frequency is hopped to F1 then to F2. Ions that are unstable at either frequency are expelled from the quadrupole, leaving only the desired narrow mass band.
- Collecting the ions before manipulation is much more efficient than filtering the ion into the trap because the ions are translationally cooled before they are mass isolated.
- Frequency is much more accurately adjusted than duty cycle allowing greater precision than DAWI.
- Because ions may be collected at a single point in a linear quadrupole with an axial field, variation in ro is negligible; any ion guide may be used for precise mass isolation regardless of small variations in the quadrupole radius along the length of the device.
Minimizing duty cycle jitter makes the stability boundaries as sharp as possible and allows more precise isolation. Likewise, precise frequency generation is required to separate species with close values of m/z.
Tandem Mass Spectrometry
Controlling the boundaries of the stability diagram makes it possible to destabilize ion motion. This enables several methods of exciting ions for CID (6). In addition to fragmentation by axial collision cell CID, ions may be radially excited by at least two methods: boundary excitation and pulsed instability. Both techniques may be performed in a single linear quadrupole multiple times (MSn).
Boundary CID occurs when ions are positioned near the boundary of the stability diagram by changing the driving waveform frequency, duty cycle, or voltage. At the boundary, ions are as radially excited as they can be without being ejected from the device. Collisions with the buffer gas convert precursor ion kinetic energy to internal energy and may result in fragmentation. If the ion is excited at the high mass boundary, the precursor and many of its lower m/z fragments are stable in the device for the whole operation. MS-MS of reserpine was recently demonstrated in our laboratory. A 40/-20/40 waveform was applied to the ion guide to axially confine ions; the m/z, F stability diagram is illustrated in Figure 10a and the position of the reserpine ions in the diagram is depicted by the black dot. The duty cycle was then switched to 47/-10/43 to introduce a high mass cut-off to the stability diagram, depicted in Figure 10b. At the operational frequency, intact reserpine represented by the black dot was just inside the stability diagram. After 100 ms, the duty cycle was switched to 40/-20/40 to allow the ions to cool. Finally, the duty cycle was switched to 45/10/45 to eject all ions waiting for the orthogonal-acceleration-TOF mass analyzer. Figures 10c and 10d show the resulting mass spectra without and with the excitation interval. The device was operated at 500 kHz and 200 V0-p throughout the experiment.
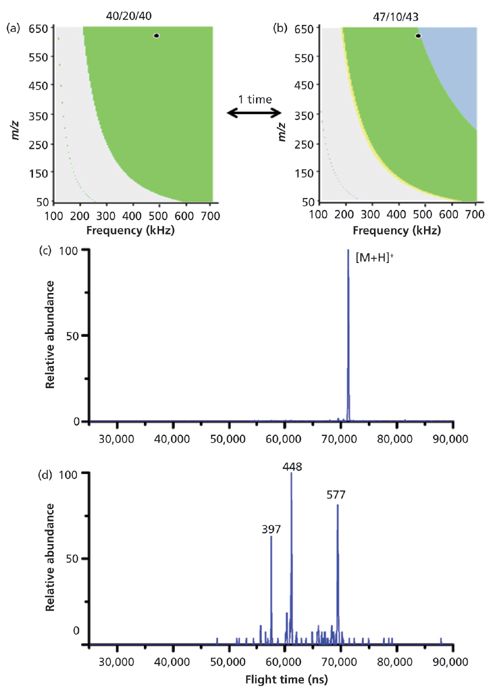
Figure 10: MS-MS of reserpine by duty cycle induced boundary CID. Adapted with permission from reference 6.
Ions may also be excited by briefly moving them outside of the stable (green) zone in the diagram. Once moved into an unstable region, it takes several periods of the driving waveform before the ions accumulate enough kinetic energy to be radially ejected from the quadrupole. If they can be returned to a stable green region of the diagram before they radially eject, the kinetic energy imparted to the ions during the sojourn into the unstable region will be converted to internal energy and may then result in fragmentation. Brief excursions into instability may be achieved by hopping the frequency of the driving waveform to move the ion to an unstable value of q or by hopping the duty cycle to move the stability boundary. Both of these approaches have been demonstrated in our laboratory using reserpine as a model system (6). Precursor ions were trapped using a 40/-20/40 waveform; the m/z, F stability diagram is illustrated in Figure 11a. Switching the duty cycle to 49/-14/37 moved the high mass cutoff to below the mass of the precursor ion, resulting in instability, illustrated in Figure 11b. The ion was allowed to accumulate kinetic energy for 10 μs (five periods of the driving waveform) before the duty cycle was switched back to 40/-20/40 for 100 μs (50 periods) to permit cooling by collisions with buffer gas. Ions were pulsed into the unstable region 10 times and cooled before being axially ejected for mass analysis. The mass spectra without and with pulsed instability are pictured in Figures 11c and 11d. Figure 11 shows excitation by switching the driving waveform duty cycle at constant frequency, but pulsed instability has also been achieved by rapidly hopping the frequency to move the ion briefly across the boundary of a fixed stable region.
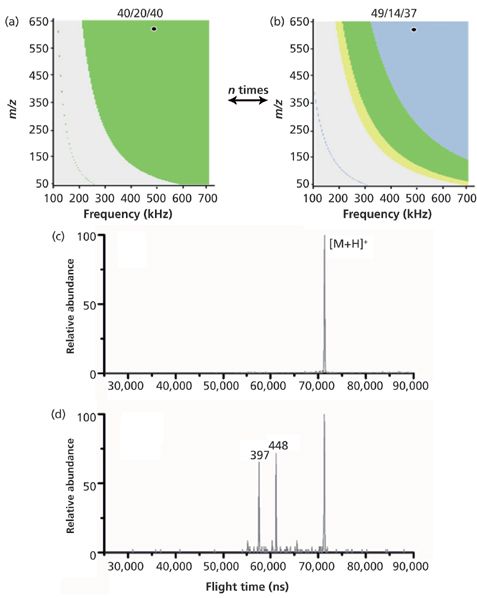
Figure 11: MS-MS of reserpine by duty cycle induced pulsed instability CID. Adapted with permission from reference 6.
Conclusion
Digital waveform technology is an important emerging tool for mass spectrometry. Precise and agile control of waveform duty cycle and frequency promises to simplify many existing MS techniques and enable several that are not yet commonplace. The ability to independently manipulate ion stability along each of the device's spatial axes makes digitally driven ion guides and traps powerful tools that can improve resolution, selectivity, and sensitivity. They also permit serial experimentation in a single device. We expect digitally driven ion traps and guides to soon supplant sinusoidally driven devices in commercial mass spectrometers and enable the development of cutting edge mass spectrometry for years to come.
Gregory F. Brabeck and Peter T. A. Reilly are with Washington State University in Pullman, Washington. Direct correspondence to: pete.reilly@wsu.edu
References
(1) M.P. Balogh, LCGC North Am. 26(12), 1006–1021 (2008).
(2) L. Ding, M. Sudakov, F. L. Brancia, R. Giles, and S. Kumashiro, J. Mass Spectrom.39, 471–484 (2004).
(3) N.V. Konenkov, M. Sudakov, and D.J. Douglas, J. Am. Soc. Mass Spectrom.13, 597–613 (2002).
(4) H. Koizumi, B. Jatko, W.H. Andrews, W.B. Whitten, and P.T.A. Reilly, Int. J. Mass Spectrom.292, 23–31 (2010).
(5) S. Bandelow, G. Marx, and L. Schweikhard, Int. J. Mass Spectrom.353, 49–53 (2013).
(6) G.F. Brabeck, H. Chen, N.M. Hoffman, L. Wang, and P.T.A. Reilly, Anal. Chem.86, 7757–7763 (2014).
(7) L.A. Pipes, J. Appl. Phys.24, 902–910 (1953).
(8) J.A. Richards, R.M. Huey, and J. Hiller, Int. J. Mass Spectrom. Ion Phys.12, 317–339 (1973).
(9) R.E. March and J.F.J. Todd, Quadrupole Ion Trap Mass Spectrometry, 2nd Edition (John Wiley & Sons, Hoboken, New Jersey, 2005).
(10) R. Singh, V. Jayaram, and P.T.A. Reilly, Int. J. Mass Spectrom.343–344, 45–49 (2013).
(11) G.F. Brabeck and P.T.A. Reilly, Int. J. Mass Spectrom. 364, 1–8 (2014).
(12) R.E. March and R.J. Hughes, Quadrupole Storage Mass Spectrometry, 1st Ed. (John Wiley & Sons, New York, New York, 1989).
(13) F.L. Brancia, B. McCullough, A. Entwistle, J.G. Grossmann, and L. Ding, J. Am. Soc. Mass Spectrom. 21, 1530–1533 (2010).
(14) B.E. Wilcox, C.L. Hendrickson, and A.G. Marshall, J. Am. Soc. Mass Spectrom.13, 1304–1312 (2002).
(15) X. Wang, H. Chen, J. Lee, and P.T.A. Reilly, Int. J. Mass Spectrom.328–329, 28–35 (2012).
(16) I.A. Kaltashov, V.M. Doroshenko, and R.J. Cotter, Proteins: Struct., Funct., Bioinf.28, 53–58 (1997).
(17) M. Forbes and R. Jockusch, J. Am. Soc. Mass Spectrom.22, 93–109 (2011).
(18) F. Talbot, S. Sciuto, and R. Jockusch, J. Am. Soc. Mass Spectrom.24, 1823–1832 (2013).
(19) J. Friedrich, J. Fu, C.L. Hendrickson, A.G. Marshall, and Y.-S. Wang, Rev. Sci. Instrum.75, 4511–4515 (2004).
(20) L. Ding and F.L. Brancia, Anal. Chem.78, 1995–2000 (2006).
(21) T. Baba, Y. Hashimoto, H. Hasegawa, A. Hirabayashi, and I. Waki, Anal. Chem.76, 4263–4266 (2004).
(22) O. Silivra, F. Kjeldsen, I. Ivonin, and R. Zubarev, J. Am. Soc. Mass Spectrom.16, 22–27 (2005).
(23) J. Lee, M.A. Marino, H. Koizumi, and P.T.A. Reilly, Int. J. Mass Spectrom.304, 36–40 (2011).
(24) J. Lee, H. Chen, T. Liu, C.E. Berkman, and P.T.A. Reilly, Anal. Chem.83, 9406–9412 (2011).
(25) H.J. Chen, J. Lee, and P.T.A. Reilly, Proteomics12, 3020–3029 (2012).
(26) T. Covey and D.J. Douglas, J. Am. Soc. Mass Spectrom.4, 616–623 (1993).
(27) G.F. Brabeck, R. Singh, V. Jayaram, and P.T.A. Reilly, "Duty Cycle-Based Cross Section Measurement of Large Singly-Charged Proteins," poster presented at American Society for Mass Spectrometry Annual Conference, Minneapolis, Minnesota, 2013.
(28) G. Reid Asbury, J.R. Klasmeier, and H.H. Hill, Jr., Talanta50, 1291–1298 (2000).
(29) C. Uetrecht, I.M. Barbu, G.K. Shoemaker, E. van Duijn, and A.J.R. Heck, Nat. Chem.3, 126–132 (2011).
(30) C.L. Crawford, B.C. Hauck, J.A. Tufariello, C.S. Harden, V. McHugh, W.F. Siems, and H.H. Hill, Jr., Talanta101, 161–170 (2012).
(31) J.F. de la Mora, S. Ude, and B.A. Thomson, Biotechnol. J.1, 988–997 (2006).
(32) J.A. McLean, B.T. Ruotolo, K.J. Gillig, and D.H. Russell, Int. J. Mass Spectrom.240, 301–315 (2005).
.

LIBS Illuminates the Hidden Health Risks of Indoor Welding and Soldering
April 23rd 2025A new dual-spectroscopy approach reveals real-time pollution threats in indoor workspaces. Chinese researchers have pioneered the use of laser-induced breakdown spectroscopy (LIBS) and aerosol mass spectrometry to uncover and monitor harmful heavy metal and dust emissions from soldering and welding in real-time. These complementary tools offer a fast, accurate means to evaluate air quality threats in industrial and indoor environments—where people spend most of their time.
NIR Spectroscopy Explored as Sustainable Approach to Detecting Bovine Mastitis
April 23rd 2025A new study published in Applied Food Research demonstrates that near-infrared spectroscopy (NIRS) can effectively detect subclinical bovine mastitis in milk, offering a fast, non-invasive method to guide targeted antibiotic treatment and support sustainable dairy practices.
Smarter Sensors, Cleaner Earth Using AI and IoT for Pollution Monitoring
April 22nd 2025A global research team has detailed how smart sensors, artificial intelligence (AI), machine learning, and Internet of Things (IoT) technologies are transforming the detection and management of environmental pollutants. Their comprehensive review highlights how spectroscopy and sensor networks are now key tools in real-time pollution tracking.